Bitcoin Cash&Ethereum&Bitcoin&Matic Analysis/14.02.22-Right perspective
The posts on this page are not investment advice .I am not a financial advisor. Just sharing my thoughts.
Hello everyone!
My motto is Keep things simple.
Follow the Trendlines, not the Headlines.
I will try to show you what I see.We will look at many altcoin analyzes.
Today,
We will examine 4 charts.
Firstly, remember the market is uneasy right now, we have to be ready for the downturns.Fed statement scares investors.Let's continue to study our charts but we have to consider the bad possibilities.
Let's start with Bitcoin Cash (We all love this don't we :)
Market Cap
6,364,770,955$
Currently Price
$335.30
(https://coinmarketcap.com/currencies/bitcoin-cash/)

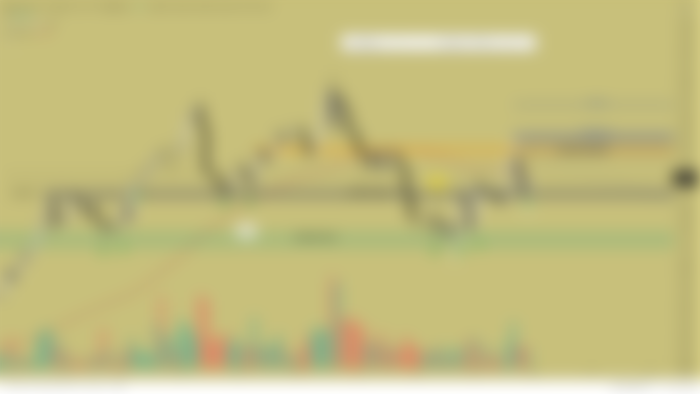
How did our gray zone work , you decide please :) I showed this area yesterday.
Level 328 is now working to get us up.The orange zone might push us a bit.The resistance level, I wrote on the left side as the s/r flip zone in my previous article has now turned into a support level. S/R Flips: Firstly S/R stands for Support/Resistance, the idea behind the flip is that this method of setup is confirmed when price reclaims a level that was previously lost, then uses that now taken level as new support or resistance.
Next is Bitcoin
Market Cap
803,180,847,903$
Currently Price
42,367.92$
(https://coinmarketcap.com/currencies/bitcoin/)

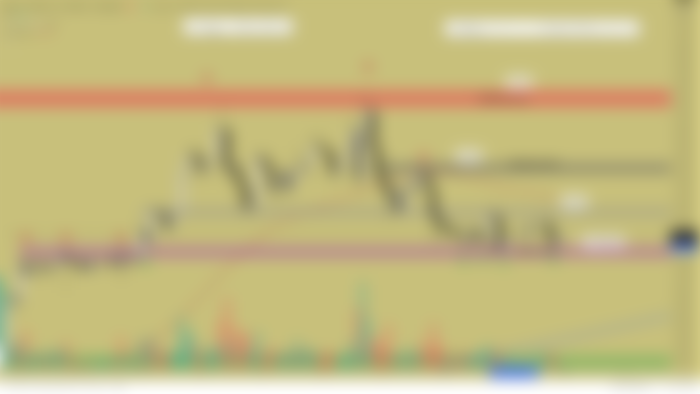
How our support zones work my friends :)Purple support zone still does its job great..I don't want to say too much, let's stick to our plan.We're fine as long as we don't fall below the purple line.We have to cross that 42,800, then we can get a response from 43,900.Unless the bad news comes...This is important.
Next is MATIC(Polygon)
Market Cap
12,516,649,004$
Currently Price
$1.67
(https://coinmarketcap.com/currencies/polygon/)

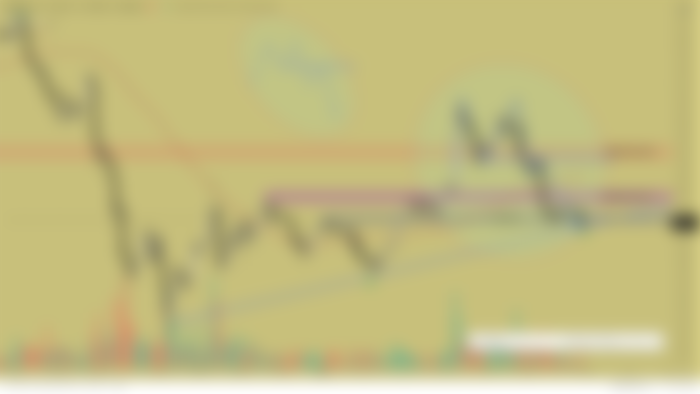
Watch out for the blue support line coming from the bottom, this is testing the zone for the 3rd time.We have to stay above the gray support zone.If bitcoin breaks out nicely, and we stay above the 1,750 zone,the rise can be very quicly.
Please attention the structure I circled :) how well it worked ?I can explain this later.
Next is Ethereum
Market Cap
346,893,778,936$
Currently Price
2,878.06$
(https://coinmarketcap.com/currencies/ethereum/)

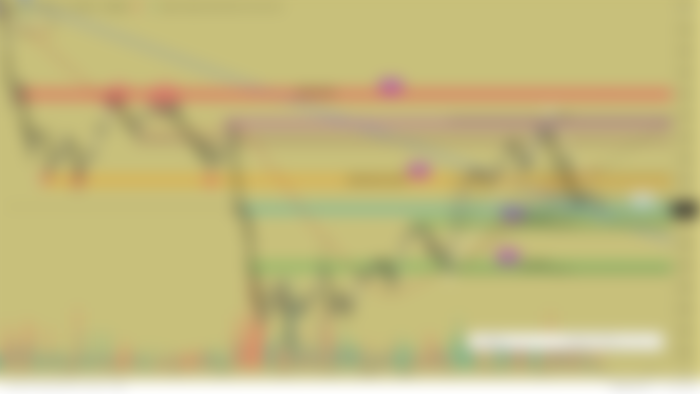
I want to show you how Fibonacci is a wonderful thing..You can see very clearly how each level works, I have colored it for you.Fibonacci, known as the golden ratio, seems to be returning from the (0.618 level).So point c. If you want to rise, we need to go above 3000 level.Frankly, the market is very unstable right now. We need to be careful.Our levels are clear, I'll keep sticking to the plan.
Btw I'm thinking of increasing the analysis of altcoins day by day.
Those were my market comments today, thank you for reading.
See you again soon. I will be here after this.
Respects.


I am always reading your articles but i still can't Understand how to read a chart🥺