$5,700,000 in pending fees
[Update 2023-03 Five years after writing this article in 2017 (and then transferring it to a new platform in 2019), it is still valid and a good illustration.]
One of the many benefits of Bitcoin Cash (BCH) is low fees: less than 1 US cent for common transactions (example: moving $2,000,000 for less than $0.01). I would like to share a perspective from the recent past that shows what happens when we do not guarantee low fees.
First, what makes Bitcoin Cash (BCH) fees low?
BCH aims to be a very high volume, low cost, permissionless network that supports the whole world. To do that, one design target is to include all pending (mempool) transactions in the next block at all times. In other words, there should be about zero competition to get your transaction into the next block. Instead, miners require a minimum cost per transaction.
What happens when blocks fill up on the Bitcoin Cash (BCH) chain?
As above, the short answer is that they should not fill up because BCH miners and devs keep the size large enough to handle all activity.
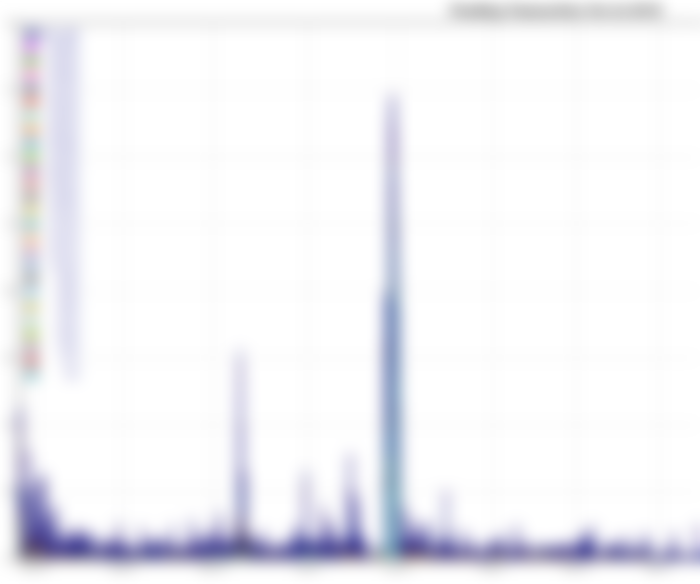
Here is the worst case I could find of blocks filling up in the post-fork history of BCH. The graph shows the total fees for pending transactions. This is an important measure that shows how much money is on the table right now for miners to take user transactions.

Most importantly, you can see that pending fees continuously drop back down to zero, indicating that all pending transactions are being included in blocks quickly. The spike around Jan 15, 2018 was maybe the worst that has happened. 1.4 BCH @ $1,300 → about $1,800 in pending fees. [Update 2019-12 This kind of thing has become an issue of the past for BCH as max block size increased after the fork and node behavior has continued to improve].
What happens when blocks fill up on Bitcoin (BTC) chain?
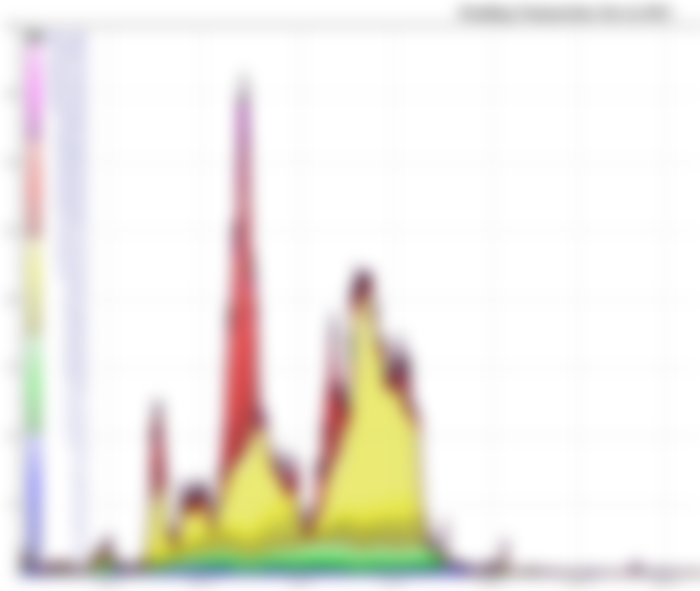
Let's focus on the total pending fees like we did with BCH. Here is the same time period as the BCH graph, but you might notice that the amounts of money involved here are completely different:

Just look at the big picture of that graph: the peak of 360 BTC @ $15,900 means about $5,700,000 in pending fees. That is $5,700,000 in pending fees, not transaction value.
How did that happen? BTC blocks are intentionally, and likely forever limited to 1 Megabyte (arguably slightly more with Segwit). Due to the limit, users were competing for months for space on the BTC blockchain. Fees for the limited space available went through the roof. Users who were unwilling to pay $5, $10, $20, $50 for a single transaction were locked out for an unpredictable amount of time. Their money was frozen. The result was complete failure as money. The normal user cannot compete for space and even the wealthy lose to the ultra wealthy as there is no limit on this blind auction. Due to the availability of superior substitute goods in other blockchains, some permissionless like Bitcoin Cash (BCH), some not, the vast majority of legitimate use cases will eventually seek less expensive alternatives.
Bitcoin (BTC) is no longer "A Peer-to-Peer Electronic Cash System"
The world cannot use that to transact, and if it tried, the fees would eventually be larger than the balances of most users.
Layer 2 systems are a different discussion, but even in the best case they are also strictly bound by unpredictable and high base layer fees. As above, when there is a superior substitute, who will spend $50 to get onto a second layer with different properties from the first layer, and spend $50 again to get off?
We must remember to keep this fundamental design at the heart of Bitcoin. "Low Fees" is a very good feature and easy to lose with mismanagement of the protocol.
But are high fees actually common on BTC and rare on BCH?
If you didn't know about blockchair, it's wonderful. Here are two queries of high-cost transactions. I defined "high-cost" as anything paying more than the equivalent of $10 for a common transaction. That's a $10 fee on top of the price of your coffee. For a p2p cash system, there should not be many of these, right? [updated 2019-12: got new data for BCH but the query seems broken for BTC so I'm leaving the old data].
High-fee transactions on BCH since 2017–08 (~800/39M = 0.002%)
High-fee transactions on BTC since 2017–08 (~15M/74M = 20%❗)
Why "Pending Fees" instead of "Pending transaction count" or "Pending transaction size"?
One of the reasons I wrote this is that I often see people talking about the number or size of pending transactions. Those are also important but:
Pending transaction count can be skewed by many small transactions.
Pending transaction size can be skewed by a few large transactions.
Pending transaction fees indicate how much value users were actually willing to pay to make transactions of any type. It is harder to "fake" than making many transactions or heavy transactions.
Please support the sites that provide the data and visualizations
Johoe's Bitcoin Mempool Statistics (donation addresses at the bottom of the page)
Blockchair (you can advertise with them or use their paid services)


I am happy to get a clear overview of how BCH outperforms BTC on the cost of transaction fees.