Maximum and minimum in the graphics:

More than once you have heard about the historical highs and lows in any analysis of an asset or cryptocurrency reflected on a chart, it may be that you understand me perfectly, how you also have no idea what I am talking about.
Today, in a simple way and to the best of my knowledge, I will explain to you what the historical maximums and minimums are in the graphs, what they are used for, how to know what they are and why it is important to analyze them.
Without more to say, welcome to my article, which I do with great enthusiasm for you, I hope you stay until the end and that it is very useful.
What is a maximum?
It is said that a maximum is, worth the redundancy, the highest point in the price of a cryptocurrency or asset in a given cycle.
You can analyze it, from any type of graph at any time, since cryptocurrencies are based on cycles and the analysis comes from past cycles, that is, the analysis is based on a movement that has already passed.
The easiest way to pinpoint the point of a cryptocurrency is to direct your gaze to the highest point of the graph you are looking at, for example:

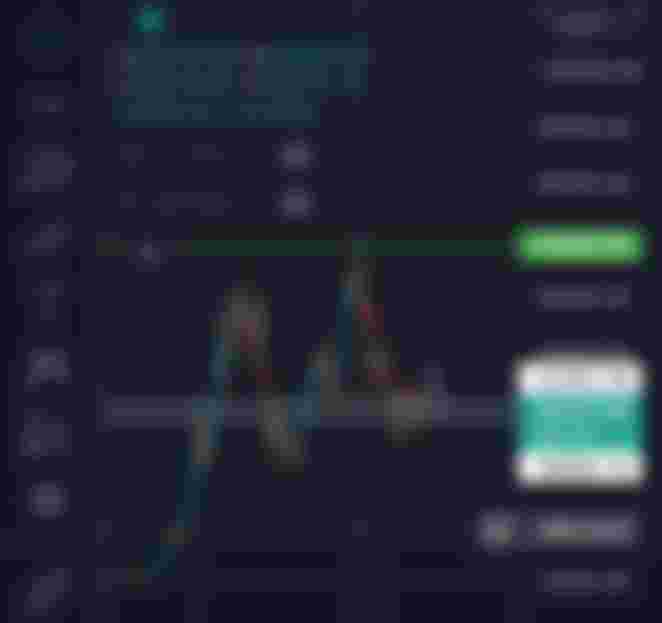
As you can see, in the 4h graph of bitcoin, the highest point in that period has been reflected in that green line, with the price of 48200.
But that is the maximum in time of 4h, where each candle is equivalent to 4 hours, if we were analyzing a daily chart, the maximum would probably be much higher according to the cycle.
It is necessary to analyze the maximums, to be able to find ceilings or resistances, when looking for new operations, new trends or to be able to predict the future movement of what you are analyzing.
What is an all-time high?
An all-time high is the highest level in the history of that cryptocurrency, that is, from day 1 exposed to the market, until today.
It can be analyzed on the weekly chart, for example:

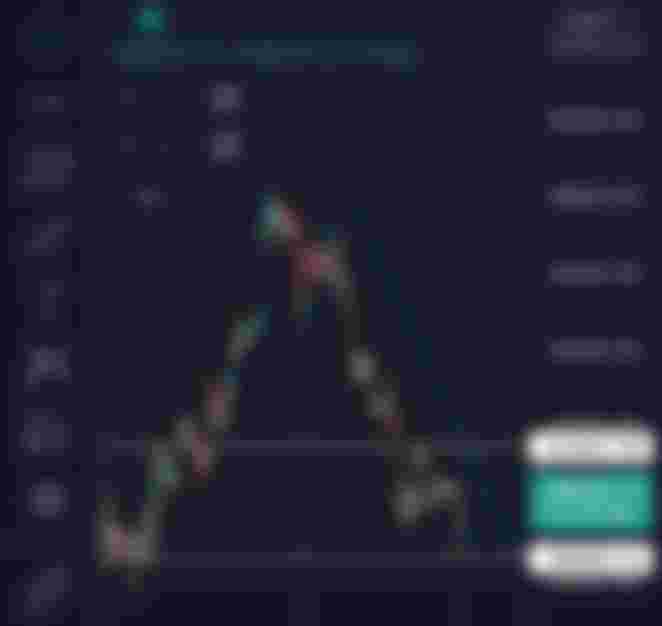
In the weekly chart of bitcoin, the highest point found is the one indicated on the chart with the green line, where the price touched 69,000, which has been the highest point that bitcoin has touched in history.
Normally, my highest points become resistance, which means that the price has a lot of difficulties to break that ceiling, as you can see in the same graph, after touching that level, the price had a fall, so for that it is important know about highs, so we can be attentive to future movements, which clearly will not always be the same.
What is a minimum?
Just as the price is evaluated at its highest point, it is also necessary to calculate its lowest point, so when we talk about minimum, it refers to the lowest point of a cryptocurrency or asset, depending on the cycle or period that is analyzing.
It can be analyzed, from any type of graph, in any temporality and in any period, since the analysis of technical cryptocurrencies is based on past cycles, in order to predict what could happen in the future, normally the movements are repeated, especially their there are outstanding levels, such as the highs and lows.

An example of the lowest point, in the graph of bitcoin in a 4h timeframe, where each candle is equivalent to 4 hours, bitcoin had its lowest point around 38k, in a period from March 15 to now.
That is to say, the bottom or what we would call bitcoin support in 4h, is at 38k, which means that there is good support that prevents the price from continuing to fall at that level, in the graph of you can see how the price had a small bounce when touching that level, is what usually happens and for that it is necessary to investigate and analyze those levels.
Ranges:
One of the most common ways to analyze these points is when the price is in a range, where it is difficult for it to break strongly what we call 'ceiling and bottom' or 'support and resistance' or 'high and low'. in the time period you are analyzing.
For example:

Bitcoin is currently within a range, where it has a resistance that it has not been able to break on the 4h chart at 41k, as well as a very important support that we have not lost at 38k.
The price after hitting the bottom, rebounded and is pushing its price, it is important that in order to break out of the range, it breaks hard resistance or support to enter a trend.
This is how I end my article today, where from my own words and my own examples I teach you how to learn to point out the maximums and minimums.
Please, I am not an expert in trading and cryptocurrencies, but I am a faithful believer that trading does not have to be difficult to be profitable, I tell you that I live from it.
If you have any questions, let me know in the comments, also if you want to leave a constructive criticism or comment, it will be well received from me, here to learn.
VERSIÓN EN ESPAÑOL
MÁXIMOS Y MININOS EN LAS GRÁFICAS:

Más de una vez has escuchado hablar de los máximos y mínimos históricos en cualquier análisis de un activo o criptomoneda reflejado en un gráfico, puede ser que me entiendas perfectamente, cómo también no tengas ni idea de que te estoy hablando.
El día de hoy, de manera sencilla y bajo mis conocimientos, te explicaré que son los máximos y mínimos históricos en las gráficas, para que se usan, como saber cuáles son y por qué es importante analizarlos.
Sin más que decir, bienvenido a mi artículo, que hago con mucho entusiasmo para tí, espero te quedes hasta el final y que sea de mucha utilidad.
¿Que es un máximo?
Se dice que un máximo es, valga la redundancia, el punto más alto del precio, de una criptomoneda o activo en un determinado ciclo.
Lo puedes analizar, desde cualquier tipo de gráfica a cualquier temporalidad, ya que las criptomonedas de basan en ciclos y los análisis provienen de ciclos pasados, es decir, el análisis es basado en un movimiento que ya pasó.
La manera más fácil de señalar cuál es el punto de una criptomoneda, es dirigir tu mirada al punto más alto de la gráfica que estés viendo, por ejemplo:

Cómo pueden ver, en la gráfica de 4h de bitcoin, el punto más alto en ese periodo, ha sido reflejado en esa línea de color verde, con el precio de los 48200.
Pero eso, es el máximo en temporalidad de 4h, dónde cada vela equivale a 4 horas, si estuviéramos analizando una gráfica diaria, probablemente el máximo sería mucho más alto acorde al ciclo.
Es necesario, analizar los máximos, para poder encontrar techos o resistencias, al momento de buscar nuevas operaciones, nuevas tendencias o poder predecir el futuro movimiento de lo que estés analizando.
Que es un máximo histórico?
Un máximo histórico, es el nivel más alto en el historial de esa criptomoneda, es decir, desde el día 1 expuesta al mercado, hasta el día de hoy.
Se puede analizar en la gráfica semanal, por ejemplo:

En la gráfica semanal de bitcoin, el punto más alto encontrado, es el señalado en la gráfica con la línea verde, dónde el precio tocó los 69000, que ha sido el punto más alto que bitcoin ha tocado en la historia.
Normalmente, mis puntos más altos de vuelven resistencias, que quiere decir, que el precio tiene muchas dificultades para romper ese techo, como pueden ver en la misma gráfica, después de tocar ese nivel, el precio tuvo una caída, entonces para eso es importante saber sobre máximos, así podemos estar atentos a futuros movimientos, que claramente no siempre serán iguales.
¿Que es un mínimo?
Así como el precio es evaluado en su punto más alto, también es necesario calcular su punto más bajo, por eso cuando se habla de mínimo, se refiere a el punto más bajo de una criptomoneda o activo, dependiendo del ciclo o periodo que se esté analizando.
Se puede analizar, desde cualquier tipo de gráfica, en cualquier temporalidad y en cualquier periodo, ya que el análisis de criptomonedas técnico, es basado desde ciclos pasados, para poder predecir lo que podría ocurrir en un futuro, normalmente los movimientos se repiten sobretodo su hay niveles destacados, como lo son los máximos y mínimos.

Un ejemplo del punto más bajo, en la gráfica de bitcoin en temporalidad de 4h, dónde cada vela equivale a 4 horas, bitcoin tuvo su punto más bajo alrededor de los 38k, en un periodo del 15 de marzo hasta ahorita.
Es decir, el suelo o lo que llamaríamos soporte de bitcoin en 4h, se encuentra en los 38k, lo que significa que hay un buen soporte que impide que el precio siga cayendo en ese nivel, en la gráfica de puede notar cómo el precio tuvo un pequeño rebote al tocar ese nivel, es lo que normalmente suele pasar y para eso es necesario, investigar y analizar esos niveles.
Rangos:
Una de las maneras más comunes, de analizar estos puntos, es cuando el precio se encuentra en un rango, dónde se le hace difícil romper con fuerza lo que llamamos 'techo y suelo" o "soporte y resistencia" o "máximo y mínimo" en la temporalidad que estés analizando.
Por ejemplo:

Bitcoin en estos momentos se encuentra dentro de un rango, dónde tiene una resistencia que ni ha podido romper en el gráfico de 4h en los 41k, como también un soporte muy importante que no hemos perdido en los 38k.
El precio después de tocar el suelo, rebotó y está impulsando su precio, es importante que para salir del rango, rompa con fuerza la resistencia o el soporte para entrar en una tenencia.
Así es como doy por finalizado mi artículo del día de hoy, dónde desde mis propias palabras y mis propios ejemplos te enseño cómo aprender a señalar los máximos y los mínimos.
Por favor, no soy una experta en trading y criptomonedas, pero soy fiel creyente que el trading no tiene que ser difícil para ser rentable, te lo digo yo que vivo de él.
Si tienes cualquier duda, déjamelo saber en los comentarios, también si quieres dejar una crítica constructiva o acotación, será bien recibida de mi parte, aquí para aprender.


You're so vigilant of reading the graphs. This article is an informative. Thanks a lot for this my friend.