Bitcoin&Bitcoin Cash& Xtz(Tezos) 12.02.22-Right perspective
The posts on this page are not investment advice .I am not a financial advisor. Just sharing my thoughts.
Hello everyone!
My motto is Keep things simple.
Follow the Trendlines, not the Headlines.
I will try to show you what I see.We will look at many altcoin analyzes.
Today,
We will examine 3 charts.
Let's start with Bitcoin
Market Cap
806,652,802,778 $
https://coinmarketcap.com/currencies/bitcoin/

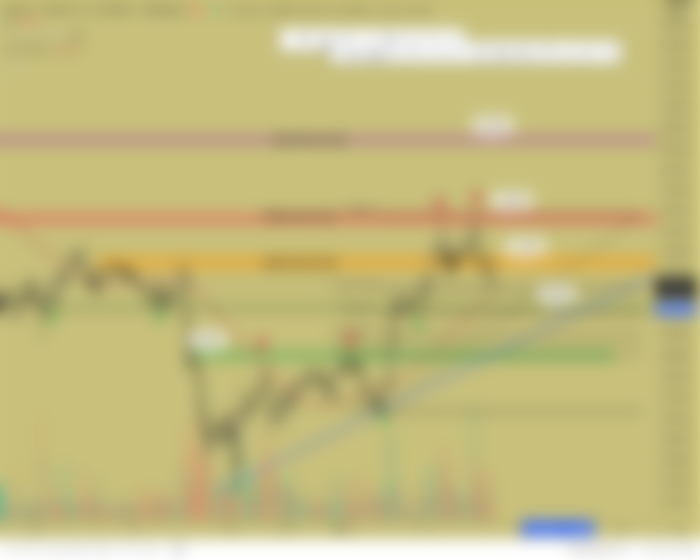
First of all, our orange support zone has turned into a resistance zone. Why?
America made statement about Ukraine and bitcoin continued to fall hard..As you know, there are Fed statements on February 16.This is very important.If bitcoin manages to stay above 39000 on these explanations, nothing can stop bitcoin :) but if we think badly,if the thing between ukraine and russia continues.And if the Fed makes a surprise announcement on interest rates... I don't want to talk about this right now :)
Anyway let's get back to our chart.41,400 our initial support points.Horizontal resistance and also the Fibonacci 0.5 level.If bad explanations come in, as I said 39000 will wait to defend us.Finally attention, 55 moving average can work as support.I will update the chart if there is anything extra in the coming days.
Next is Bitcoin Cash (We all love this don't we :)
Market Cap
6,086,426,266$
(https://coinmarketcap.com/currencies/bitcoin-cash/)
We are still above 315 support level.Actually not bad.Like i said if bad explanation come, 290-270 very strong support.They will want to keep this place.We don't need to panic for now.If we go below this zone we may need to talk about this again.If we go up, we need to cross the 350 zone with a strong candle.Let's see what is going to happen.Finally, I want to show you why the 290-270 support zone is so strong from a different perspective.
Do you understand now why this zone is so strong? :)
Next is Xtz(Tezos)
Market Cap
3,610,033,741 $

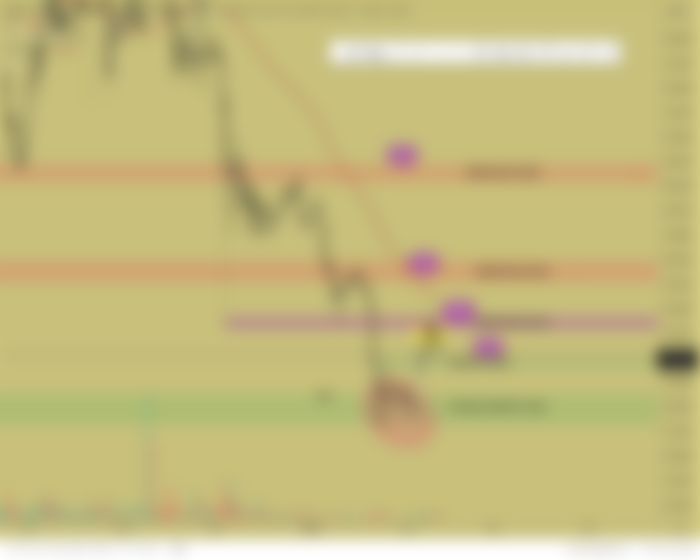
This friend has a hard time holding on to the support zone.If bitcoin drops a little more,3.8, the orange support zone, will be waiting for us.I deleted it so that the graph would not look confused, but the c at the a-b-c point is exactly at the fibonacci 705 level.(this is known as the nice turning point). Let's see if the price will want to go to the orange zone.
Btw I'm thinking of increasing the analysis of altcoins day by day.
Those were my market comments today, thank you for reading.
See you again soon. I will be here after this.
Respects.
I have been on this platform for less than a year and I confess that before joining I had no knowledge of cryptocurrencies. Since then I have been trying to educate myself on the subject. I always try to read content where the language used is as simple as possible for my understanding, since I do not handle the terms. Your graphics are very well detailed, with simple language. I will try to keep up with you because I find what you publish very interesting. Another way of seeing and understanding. Thanks for sharing.