Why you should include Parabolic SAR in your technical analysis.
This is not financial advise or a tutorial, this article just summarize my opinion and views.
Technical Analysis of Crypto Candle charts
If you trade Crypto on a regular basis than you probably use look at candle charts everyday.
Technical Analysis is a great way to check and determine what the market movement could be.
While it is not an end all way to determine the future trend and sudden changes in the market factor could throw off the results completely.
Still it is a great skill to have in order to understand the market better.
I am been looking at the BitcoinCash charts recently after the news that BitcoinCash could soon be the legal tender in Sint Maarten
And here I think the Parabolic SAR has come in handy.
My chart set up
I use Trading View to view my charts
You can use it for free but if you want you can go with the pro option that gives you the option to view multiple charts with more indicators.
Next when choosing the symbol I mostly go with the USD pair on coinbase
Here you can see I choose BCHUSD from coinbase


Now I'll go to indicators


I'll choose the following:
Linear regression
Stochastic / or MACD (Moving Average Convergence Divergence)
Parabolic SAR
After which this is the chart I would work with


You can see that this is a 1 day candle chart and linear Regression is showing me downward trend
Even with that we can see the current candles are above the linear regression line.
Secondly, Parabolic SAR is indicating and upward movement with Stochastic also showing good movement.

How if I shift the chart from 1 day candles to 1 hour candles, we can see for a short time scale


Now I can see that while linear regression has turned into uptrend the Parabolic SAR is currently downwards.
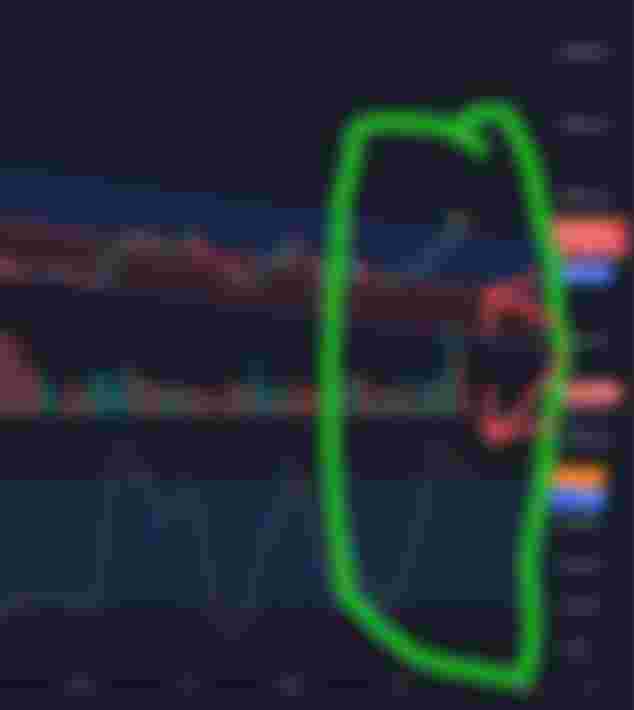
Let's take the time scale shorter to 30 minutes candles


Again we see that the trend has changed again, however while the recent candles are red and moving downwards I can see Parabolic SAR line at the end that is slightly moving upwards.
Parabolic determine price direction
From all the 3 time frame I can determine that the recent news has had some positive impact on the charts and the current small dip could be temporary.
Therefore the Parabolic SAR has came in handy for me to see the price direction of the asset.
And you should at least consider keeping it on your charts while viewing the markets, even if your not actively taking it into consideration.