Series 2: Transfer Funds and Opening Position
As part of my Binance Futures series, I will now cover the chart and some cool new feature from binance.
What is a Chart?
Chart is a visual representation of the historical prices of a certain coin. It comprises mainly with candlesticks. Depending on the timeframe, you can see the pattern of the price movement just by looking into the chart.
More advanced trader also rely on chart to do their technical analysis on what will be the next movement of the price.
Here is an example of a chart in Binance mobile version:
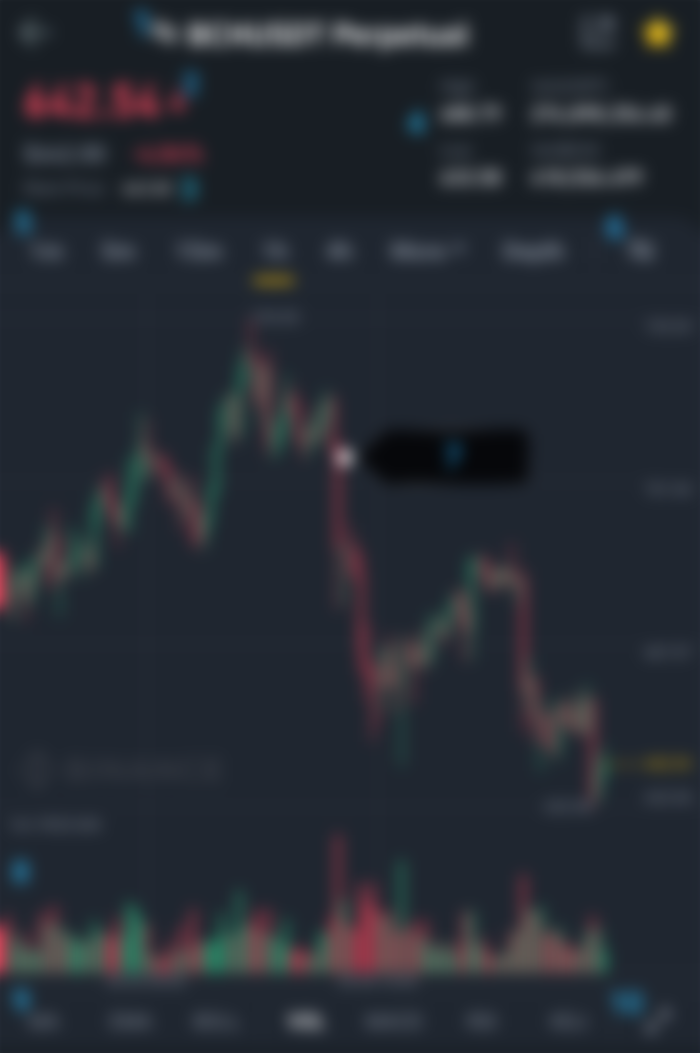
Cryptocurrency Pair: In the example above, I use BCH/USDT pair. Click this part if you want to change the pair you want to view.
Price: The latest price of the currency you chose
Mark Price: This is used for margin and PNL calculations, before entering and exiting a position, this should be considered first. Both price differs from each other to avoid price manipulation.
High&Low: It indicates the highest and lowest price within 24 hour period.
Timeframes: Depending on your strategy, timeframe may vary. You can change the view by tapping the timeframes or click more for other available time frame. (m means minutes, h means hour, D means day, w means weeks and M for month)
Settings:
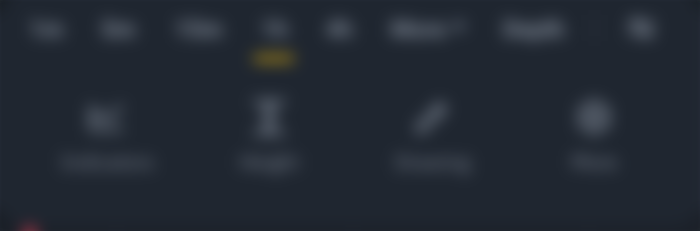
-Indicators: By clicking this button you can edit your indicators. I'll try to cover this topic in my future article. 😊
-Height: To adjust the height of your chart in your screen in portrait mode.
-Drawing: This is the latest feature of Binance mobile. Now you can draw lines for your technical analysis. Although it only provided basic drawing tools, It still better than the previous version wherein you need to open another application just to draw your trendlines.
-More: It shows other setting for your chart. Editing the current display of your timeframe, indicator setting, and setting for viewing the abstract or the summary within the chart area.
Chart Area: This is the main display of the history of the prices according to timeframe. Candlesticks represents the price within a specific time.
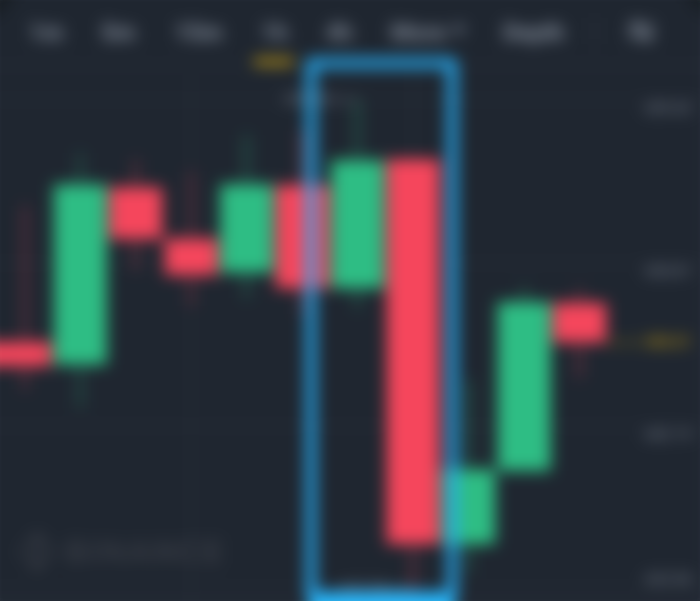
Green Candle: means that the price direction is upward. So based on the figure above, the price OPEN (lower part of green candle) and within the time period it moves upward and created an Upper Wick. Upper wick represents how High the price moves, then it Closes below that highest prices. This movement created the Green Candle.
Red Candle: after the closure of the green in the said time period, for example the price drops, it will now start with the OPEN or the top part of Red Candle and move downward until it hit the Lowest Price of that time period. The Lowest price became the Lower Wick.
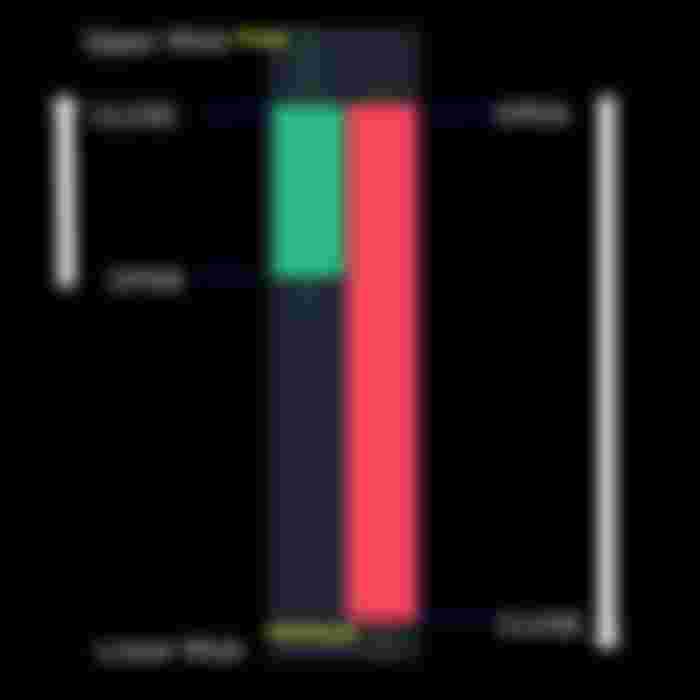
Open Price: This is the first price traded when a new candle forms. If the price starts to move upward, the candle will turn into Green. If the price move downward, the candle will turn into Red.
High Price: The top of the Upper Wick represents the highest price within the time period.
Low Price: The lowest price at the Lower Wick within the time period.
Close Price: This is the Last price traded after the formation of the candle. If the Close price is below the Open price, the candle will become Red. If the Close price is above the Open price, the candle will be Green.
Volume: The bar below the chart represents the trading volume within the time period. It also indicates the buyer and sellers volume. Green Bar indicates a higher price trading while the Red Bar indicates lower price trading.
Indicators: There are six indicators pre-embeded in Binance which composed of 3 main indicators (MA, EMA, BOLL) and 3 sub indicators (MACD, RSI, KDJ).
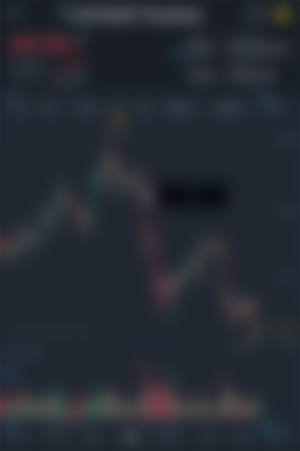
Zoom button: for a wider view of the chart, this button will change your view from portrait to landscape view.
I hope you enjoyed my presentation of the basic user interface and function of chart in Binance Futures. I'll try to further specified some information in a separate article.
If you found some information incorrect, don't hesitate to comment. 😊


Stay tuned for Part 5😉
Take risk only if you can afford to lose, don't use money with intended purposes. Do your own research before engaging, risk is always present.