BTC/BCH week-end analysis:/ BTC-BCH análisis de fin de semana


The long-awaited weekend has arrived to rest, but stalled for the market! Normally the weekends are really dead for cryptocurrencies, so analyzing the closing of the week on Fridays is a very good idea.
Llegó el fin de semana tan esperado para descansar, pero estancado para el mercado!
Normalmente los fines de semanas son realmente muertos para las criptomonedas, así que analizar el cierre de semana los viernes es muy buena idea.
I am not so fond of fundamental analysis, since I have the idea that it only destabilizes our emotions. Apart from the fact that I know that trading or market predictions are probabilities, but with technical analysis you can make a very accurate study. It is much better to study and do your own analysis using the signals or indicators to be able to study the trend of a currency, than just relying on what so-and-so said or what not about so-and-so. The news only serves to capture future improvements in some cryptos, possible increases, possible decreases and above all to know what is happening in the world, but do not let all the FUD uncontrol your trading system. Now yes, without further ado let's start with the points to study about the future of BTC.
No soy tan amiga de el análisis fundamental, ya que tengo la idea de que sólo hace desestabilizar nuestras emociones.
A parte de que se que el trading o las predicciones de mercado son probabilidades, pero con el análisis técnico puedes hacer un estudio muchas certero.
Es mucho mejor estudiar y hacer tu propio análisis usando las señales o indicadores para poder estudiar la tendencia de una moneda, que solo basarse en lo que dijo fulano o lo que no sobre tal.
Las noticias solo sirven para captar futuras mejoras en algunas criptos, posibles subidas, posibles bajadas y sobretodo saber que está pasando en el mundo, pero no dejes que toda la FUD te descontrole tu sistema de trading.
Ahora sí, sin más que decir empecemos con los puntos a estudiar sobre el futuro de BTC.
It is normal that today after so much negative news, we feel fear, but healthy trends are based on setbacks and continuations, so it is healthy for Bitcoin to create a trend with caution, so we can expect better results when hitting points keys. We are currently recovering the floor of 43,000, which shows only with the price, a clear rejection of the downward force.
Después de los números inflacionarios dictados por la IPC, el Bitcoin descendido desde su máximo del día de ayer, que rondó entre los 45.000 hasta un mínimo de 42.700.
Es normal que hoy en día después de tantas noticias negativas, sintamos miedo, pero las tendencias sanas se basan en retrocesos y continuaciones, así que es saludable que Bitcoin vaya creando una tendencia con precaución, así podemos esperar mejores resultados a la hora de tocar puntos claves.
Actualmente recuperamos el piso de los 43.000, que muestra solo con el precio, claro rechazo de la fuerza bajista.
Fear and Greed Index:
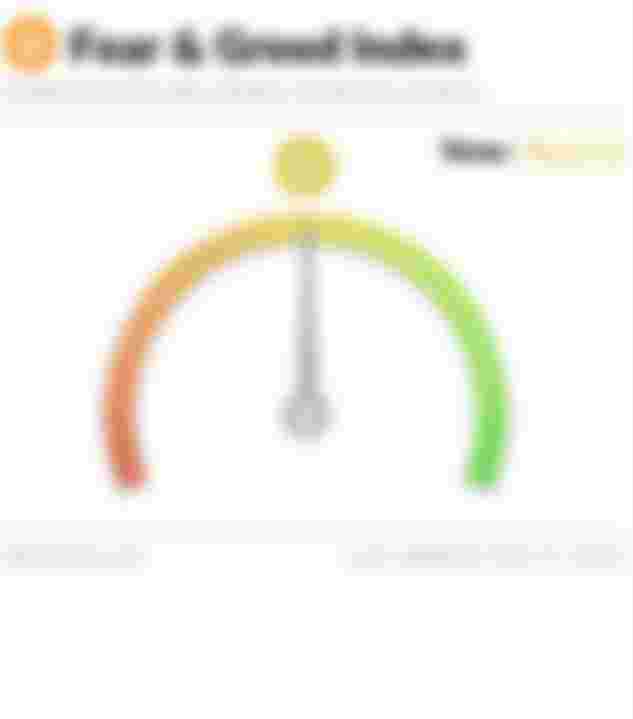

We note the orange zone, almost half of the indicator, which may not be a very important signal, but I like to check it because you can see the emotional level where people are currently. Emotions influence the market a lot, so we can see that there is slight hope in most holders. We are not in a bad spot just because we are in the red zone, perhaps it just means that there is much calmer despite having a more encouraging outlook.
Apúntamos la zona naranja, casi la mitad del indicador, que quizás no sea una señal de demasiada importancia, pero a mí me gusta checarla porque se puede ver el nivel emocional donde se encuentran actualmente las personas.
Las emociones influyen mucho en el mercado, así que podemos notar que hay ligera esperanza en la mayoría de holder.
No estamos en un punto malo solo por estar en la zona roja, quizás solo signifique que hay mucha más calma a pesar de tener un panorama más alentador.
Support:


It has been a relatively good week for Bitcoin as it has maintained its 40k bottom, which from past patterns has been shown to be of vital importance to the future of Bitcoin. It is good news that the week is closing above 40k, although it is not yet the end of the daily candle, I do not think it will crash below 40k, at least today and I doubt that the end of the week, so I say that they are a bit quiet days. I would say that important points are to maintain a constant floor at 44k, the more it consolidates, the better, and then watch the second important point, which would be 48k. If you are trading right now like I am, the 46k would be a good place to place Take Profit.
Ha sido una semana relativamente buena para Bitcoin, debido a que ha mantenido su suelo de 40k, que desde pasados patrones, se ha demostrado que es de vital importancia para el futuro de Bitcoin.
Es una buena noticia que se esté cerrando la semana por encima de los 40k, aunque todavía no es el final de la vela diaria, no creo que se desplome por debajo de los 40k, por lo menos el día de hoy y dudo que el fin de semana, por lo que digo que son días un poco tranquilos.
Puntos importantes diría yo que es mantener un suelo constante en los 44k, mientras más se consolide mejor, para luego vigilar el segundo punto importante que serían los 48k.
Sí estas haciendo trading en este momento como yo, los 46k sería un buen lugar para colocar Take profit.
Candle:
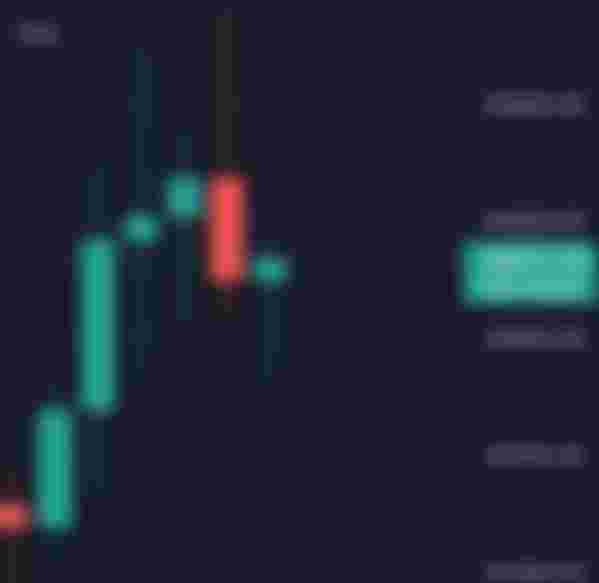

I am a swing trader, because I love to trade strong trends, so I only focus on the 1D chart. It may be too early to analyze the candle now, but we can see the strong rejection that there was from the bears, although right now it is more of a doji body candle, I would say that during the day it could form a bullish candle. or a hammerhead candle, which in case you didn't know, means the arrival of an uptrend. As I said before, it is too soon to know everything, it can happen, it can go down, it can go up, but for now the downward pressure has been rejected and the bulls are taking advantage.
Vela:
Soy un operador swing, porque me encanta operar con tendencias fuertes, por lo que solo me enfoco en el gráfico 1D.
Quizá ahora sea pronto para analizar la vela, pero podemos ver el fuerte rechazo que hubo por parte de los bajistas, aunque ahora mismo es más una vela de cuerpo doji, yo diría que durante el día podría formar una vela alcista. o una vela de cabeza martillo, que por si no lo supieran significa la llegada de una tendencia alcista.
Como decía antes es pronto para saberlo todo, puede pasar, puede bajar, puede subir, pero de momento se ha rechazado la presión bajista y los alcistas se están aprovechando.
Mobile media: The 150 period moving average:


It is above the chart, which means that we have not yet moved into an uptrend in that period, but it does serve to point out to us how important the 50k floor would be. At the moment of breaking the moving average of 150 periods, we can claim victory and say that Bitcoin could go to the moon or touch its last all-time high again.
Medios móviles:
La media móvil de 150 períodos:
Está por encima de la gráfica, cosa que significa que aún no hemos pasado a una tendencia alcista en ese periodo, pero ella sirve para señalarnos la importancia que estaría en el piso de los 50k.
Al momento de romper la media móvil de 150 períodos, podemos cantar victoria y decir que Bitcoin podría irse a la luna o tocar su último máximo de nuevo histórico.
The moving average of 50:


She is much more exciting, because she will first use months below the mobile means of 50, until she finally calls we crossed. She is a very important indicator for many professional traders and why not for us? Well, as you can see on the chart, yesterday despite Bitcoin's decline towards 42k, it touched the moving average but didn't cross it down, so two important things: As long as it doesn't cross there is hope and when the chart bounces off that moving average there is normally a strong bounce depending on the tenure, in this case we are still bullish so stay tuned.
La media móvil de 50:
Ella es mucho más emocionante, porque primero usará meses debajo de los medios móviles de 50, hasta que por fin llama cruzamos.
Ella es un indicador muy importante para muchos comerciantes profesionales y por qué no para nosotros?
Bueno, como pueden ver en el gráfico, ayer a pesar del descenso que tuvo Bitcoin hacia los 42k, tocó la media móvil pero no la cruzó hacia abajo, así que dos cosas importantes: Mientras no se cruce hay esperanzas y cuando el gráfico rebota en esa media móvil normalmente hay un rebote con fuerza dependiendo de la tenencia, en este caso seguimos siendo alcistas así que pendientes.
The moving average of 20:


Very good to operate, combining the analysis of other points. I started trading on February 04, with Bitcoin at 41k and I already made my first profits, at 43k I left a limit order with half the capital to leave the trade in breakeven and I am currently in slight profits, however Yesterday I could have taken profits in the 45k, but I'm still confident that BTC will go up so I stick to my strategy and put the fear in the trunk. Until it crosses the 20 and 50 moving averages, there is still bullish expectation. On the other hand, the moving average of 20 leaves us with the 38k as an important point, so if the graph drops that level, we would be in trouble.
La media móvil de 20:
Buenísima para operar, combinando el análisis de otros puntos.
Yo entré a operar el día 04 de febrero, con el Bitcoin en los 41k y ya obtuve mis primeras ganancias, en los 43k dejé una orden limit con la mitad de capital para dejar la operación en breakeven y actualmente estoy en ligeras ganancias, sin embargo ayer pude haber tomado ganancias en los 45k, pero sigo confiando en que BTC subirá así que me apego a mi estrategia y pongo el miedo en el baúl.
Hasta que no cruce los medios móviles de 20 y de 50 todavía hay expectativa alcista.
Por otro lado, la media móvil de 20 nos deja como punto importante los 38k así que si el gráfico baja ese nivel si estaríamos en problemas.
Trend line:


Finally, I leave you the trend line that is clearly bullish. It's not a line that matters much, but it does let us see how the pattern from the 32k point bounced back and became a bullish pattern. There are still many more signals in indicators, such as MACD and RSI, but that depends on your preference indicators, I personally do not use either of those two, but I like that my algorithm is accompanied by analysis in different theses, as I explained earlier. However, I am new to this, I have been here for almost 5 months, but the truth is that it has not gone badly for me, despite the fact that I arrived at a time of crisis. What is true is that I spend a lot of time studying and I would greatly appreciate it if you would leave your constructive opinion on my analysis.
Por último os dejo la línea de tendencia que es claramente alcista. No es una línea que importe mucho, pero nos deja ver cómo el patrón desde el punto 32k se recuperó y se convirtió en un patrón alcista. Todavía hay muchas más señales en indicadores, como MACD y RSI, pero eso depende de tus preferencias de indicadores, yo personalmente no uso ninguno de esos dos, pero me gusta que mi algoritmo esté acompañado de análisis en diferentes tesis, como expliqué. más temprano. Sin embargo, soy nuevo en esto, llevo aquí casi 5 meses, pero la verdad es que no me ha ido mal, a pesar de que llegué en un momento de crisis. Lo que si es cierto es que paso mucho tiempo estudiando y te agradecería mucho si me dejaras tu opinión constructiva sobre mi análisis.
BCH USDT


We are visualizing a pattern very similar to BTC, as all cryptocurrencies always move in ways similar to BTC. We see a short bullish pattern, a candle despite being red has the same bullish body as the BTC candle. BCH has suffered a strong fall but a strong recovery can be noticed and we, the holders of BCH, could obtain an advantage since, being a currency with an amount less than Bitcoin, we can have better profits, so if everything goes well and BTC continues to rise, probably BCH give us future great days and if our vision is long term as it should be we can have huge profits. Until now, it only remains to wait and be patient, remember that patience pays
BCH:
Estamos visualizando un patrón muy parecido a BTC, como todas las criptomonedas siempre se mueven de maneras parecida a BTC.
Vemos un patrón corto alcista, una vela a pesar de ser roja tiene el mismo cuerpo alcista que la vela de BTC.
BCH ha sufrido una fuerte caída pero se puede notar una fuerte recuperación y podríamos obtener ventaja nosotros los holder de BCH que al ser una moneda con un monto menos que Bitcoin podemos tener mejores ganancias, así que si todo sale bien y BTC sigue subiendo probablemente BCH nos de futuros grandes días y si nuestra visión es a largo plazo como debería ser podemos tener gigantes beneficios.
Hasta los momentos sólo queda esperar y ser pacientes recuerde que la paciencia paga.
La mayoría de las criptos están teniendo movimientos bajistas, y, muchas de ellas, siguen al BTC en cuanto a movimientos... debido a los problemas que existen entre ciertos países y el rechazo a las criptos, quizá eso sea un motivo. El BTC está subiendo de a poco.
Saludos.