The candle stick chart was introduced by Steve Nison in his book, Japanese Candlestick Charting Techniques developed by Munehisa Homma, a rice merchant from Sakata, Japan who traded in the Ojima Rice market in Osaka during the Tokugawa Shogunate. It really looks like a candle where the wick is the high, the wax is the open/close, and the handle is the low. Today, candle stick chart is useful to efficiently see market behaviors and predict future movements.

A bullish finished candle is usually colored green or hollow. It is a summary of a price movement that starts/opens with a lower price and ends/closes with a higher price. Thus, a bullish candle means that the price went upward in that certain period.

On the other hand, a bearish finished candle opens with a higher price and closes with a lower price. Thus, a bearish candle means that the price went downward in that certain period. It is usually colored red or filled.
Simplest Pattern
Candle Body Length

A balanced bullish candle size is more to a bullish signal and vice versa for a balanced bearish candle is more to a bearish signal. There are even many articles for starting traders that we buy after there are series of bullish candle suggesting us to ride the wave and the same that we should sell after there are series of bearish candle. However, when the body is very big, it indicates a great difference between the open and close position either a strong buy or a strong sell. I do not recommend a hasty buy when there is a big bullish body candle especially near the resistance level. In the DOW Theory, while the balanced bullish candle is like the participation phase, the big body candle near the resistance level have more probability of an excessive phase where people FOMO (fear of missing out) which are the last people to enter the market. At this point is more logical to take profit. On the other hand, I have many experience to a very short term buy at a big bearish body candle but beware if holding longer because the price may continue the bearish trend rather reverse to a bullish trend.
Candle Shadow Length

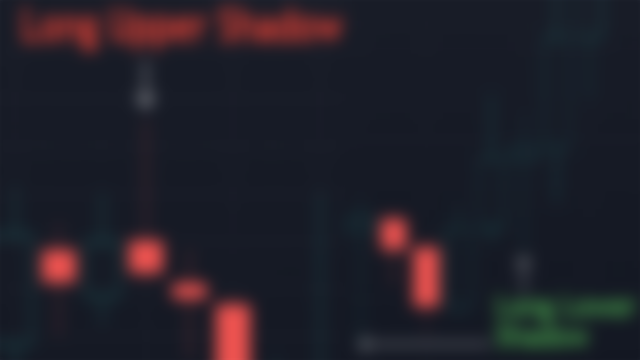
As for the bottom and top sticks/shadows means the same whether bullish or bearish candle as it only shows the highest and lowest price on that certain period. If the top shadow is longer compared to the other body parts means that the sell pressure is strong. When the price reached the top, the sellers slams the price down. If the bottom shadow is longer compared to the other body parts means that the buy pressure is strong. When the price reached the bottom, the buyers lifts the price up.
Simple Patterns
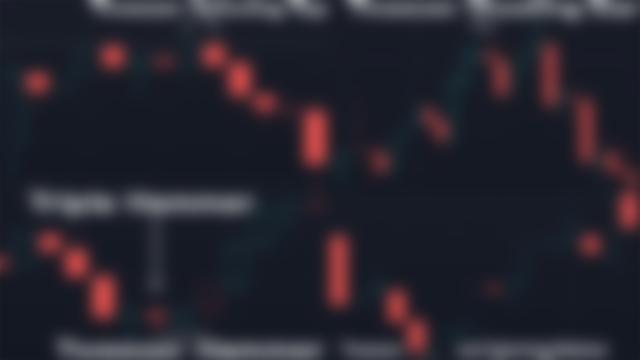
Hammer
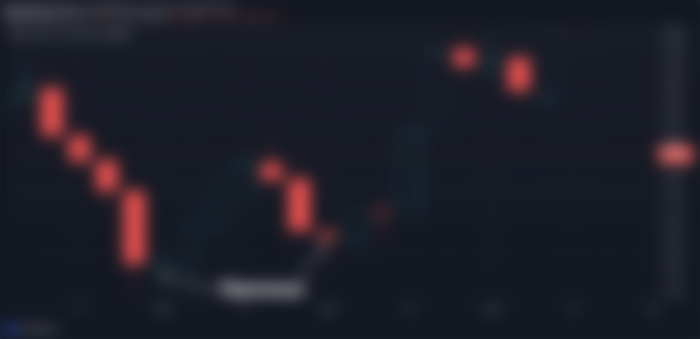
A candle that looks like a hammer found near the support line. A hammer have a high probability of a bullish reversal because of the long lower shadow showing that after sellers tried to break the price down, buyers supported the price from falling, driving the price back up. The probability of a bullish reversal increases if it is a bullish hammer where the price closes higher than the opening price. In my experience, a bearish hammer where the price closes lower than the opening price still have a probability of a bullish reversal because of the long lower shadow alone but not as much probability as a bullish hammer. Thus, I recommend to wait longer for more confirmations if it is a bearish hammer.
Inverted Hammer
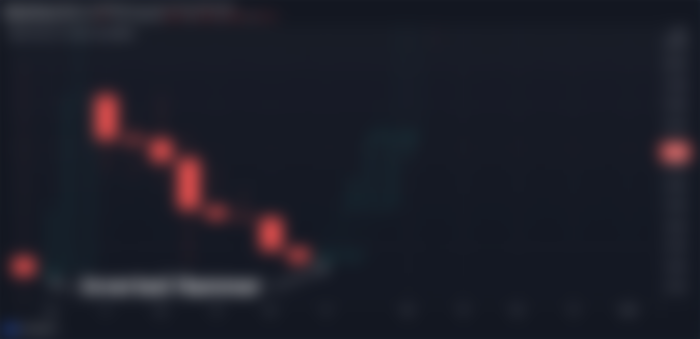
A candle that looks like an inverted hammer found near the support line. Like hammer, a bullish inverted hammer have a high probability of a bullish reversal. Although shows a long upper shadow but the price closes higher than the opening price indicating. Although the sellers are strong, but they are not strong enough to turn the candle bearish which may means that the sellers are running out of selling power. Unlike bearish hammer which I experienced still have a probability of bullish reversal, a bearish inverted hammer is less likely to be a bullish reversal because it loss the point why inverted hammer is bullish reversal which is sellers are not strong enough to turn the candle to bearish where in this case the sellers are strong enough to turn the candle bearish.
Hanging Man
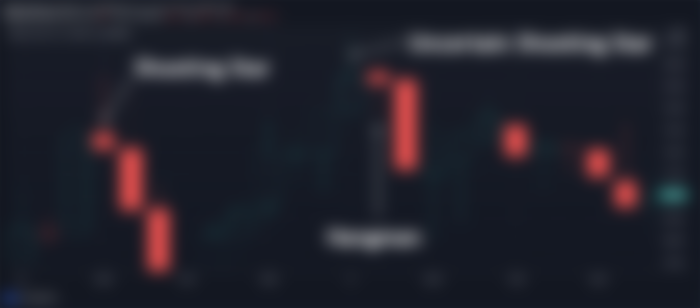
While a hammer is found near the support line, a candle that looks like a hammer that is found near the resistance line is called a hanging man which really looks like a man hanging at the roof. A bearish hanging man candle have a high probability of a bearish reversal because the buy pressure from the long lower shadow is not strong enough to turn the candle bullish and even more so to break the resistance line. On the other hand, it is uncertain if the hanging man is a bullish candle because the buy pressure defeats the strong sell pressure that causes the long lower shadow and turned the candle bullish. There is a chance that the buyers break the resistance line but often it is uncertain to take a position and best to wait and confirm other information.
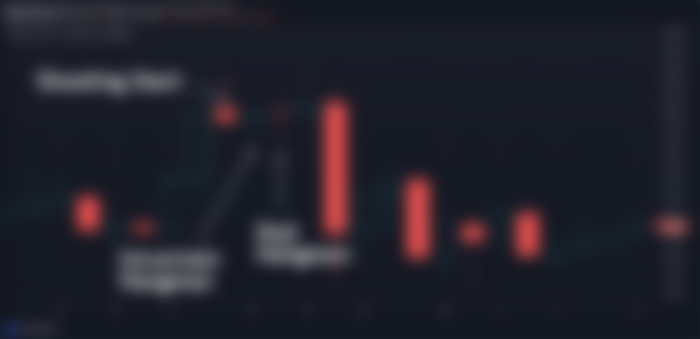
Shooting Star
An inverted hammer found near the resistance line is called a shooting star. A bearish shooting star candle is a strong sign of bearish reversal because the sellers defeats the buy pressure that tried to break the resistance and turned the candle bearish. On the other, in my experience, the bullish shooting star is more uncertain than a bullish hanging man because it was met with a strong sell pressure but the buy pressure persisted and turned the candle bullish which is a more reason to wait and confirm.
Marubozu
Marubozu, まるぼうず, 丸坊主, can be translated as close-cropped head or bald hill. Ideally, the candle does not have either lower nor upper shadow. A bullish Marubozu opens at the lowest price and closes at the highest price meaning that buyers does not give sellers the chance to push the price down and vice versa a bearish Marubozu opens at the highest price and closes at the lowest price meaning that sellers does not give the chance to push the price up. Predicting the future price action with Morubazu commonly depends on the price and the position of the candle. A small to medium size bullish Marubozu near the support line have higher probability of bullish reversal while a large size bullish Marubozu near the resistance line may indicate a FOMO and profit taking is at the horizon. Similarly applies to bearish Marubozu that a small to medium size bearish Marubozu near the reistance line have higher probability of bearish reversal while a large size bearish Marubozu near the support line may indicate over sold and may attract buyers because the price looks cheap. On the other hand, when breaking the support or resistance line may indicate a new phase but check the news first to confirm. Lastly, while ideally Marubozu does not have lower nor upper shadow, candles with very small shadows may behave as a Morubozu as it does not have to be perfect.
Doji
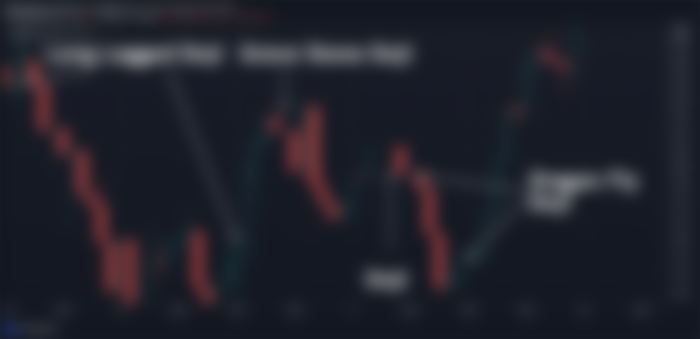
Doji, どうじ, 同事, can be translated as same matter. Any candle when the price closes at the same value as the opening is a Doji. It shows that buyer and seller have similar strength. While previous candles shows higher probability of continuation or reversal, Doji is a moment of pause not to make an entry but to call our attention that we should watch whether the trend will continue or reverse. A regular Doji have an equal lower and upper shadow, a long legged Doji have longer lower and upper shadow which shows high volume, a doji with only lower shadow is a dragon fly where the selling pressure is cancelled by the buyers, and vice versa a doji with only upper shadows is a gravestone doji where the buying pressure is cancelled by the sellers.
Spinning Top and Spinning Bottom

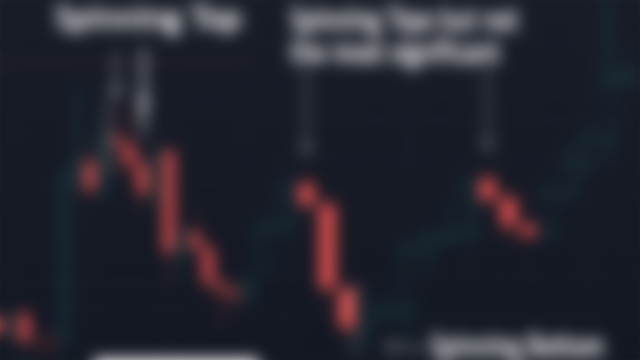
Spinning top candle stick literrally should looks like a spinning top toy. In most references, a spinning top have an almost equal upper shadow and lower shadow and a body equal or less than the shadow. Like Doji shows some level indecisiveness in the market but unlike Doji the candle can be bullish or bearish. A bearish spinning top near the resistance line have better probability of reversal than a Doji. A spinning top near the support line can be called a spinning bottom which have better probability of reversal than a Doji.
Popular Complex Patterns
Tweezer
While any previous candle stick doubles increase the probability of a reversal or continuation such as a double spinning top, double doji, double hammer, double inverse hammer, double hang man, and double shooting star, a tweezer candle stick is even more so. A tweezer literally is a tool with to clipping points to pick up small objects. Thus, a tweezer in candle stick chart pattern is a combination of two candle sticks which have the same either bottom or top height. They are significant near the support level which is called a tweezer bottom and near the resistance level which is called a tweezer top. Although we still should confirm with the news and other indicators, a double candle stick especially a tweezer is strong enough to make traders set a position straight away with stop loss just right above or below the height, especially when the second candle is bullish in the support level and bearish in the resistance level.
3 White Soldiers and 3 Black Crows
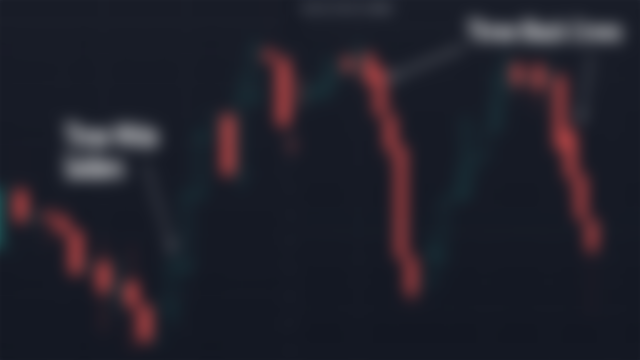
The three white soldiers are 3 bullish candle stick. Ideally, they have long bodies and short shadows indicating consistent buying pressure with less selling pressure shown by the short upper shadow. This shows a probability for an up trend to continue and even more so if there are Marubozu candles involve. When they are found near the support line may indicate a reversal bullish trend. The opposite of 3 white soldires are 3 black crows.
Harami
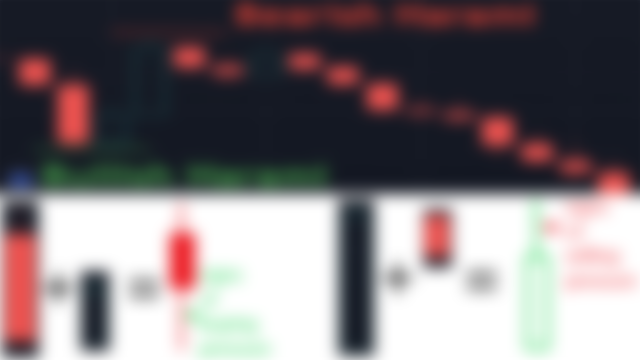
Harami, 孕み, はらみ, means pregnant in Japanese where in a candle stick pattern we have to find two candle sticks combined together looks like a pregnant woman. The first candle must have a long body and the second candle must have a short body which must reside between the opening and closing of the first candle. Although we can find ideal Harami in commodities, foreign exchanges, and stocks, it is extremely rare to find an ideal Harami in cryptocurrencies. While commodities, foreign exchanges, and stocks only opens on working hours (9-5) sometimes with breaks and working days (Monday - Friday) where in short 8/5, cryptocurrencies are never close 24 hours 7 days (24/7) with no breaks and therefore the opening price of the second candle is almost always the same price as the closing of the first candle. A harami can be a potential moment of reversal because the two candles combine shows a resistance in buy or sell pressure. When a harami happens, we should give our attention.
Engulfing

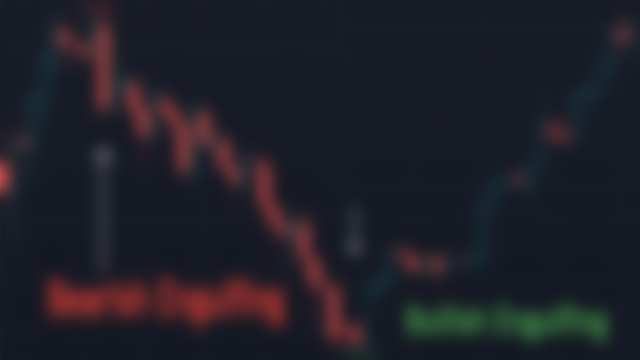
The candle positions in engulfing is the opposite of Harami. The first candle is narrow while the second candle is wide engulfing the first candle. An ideal bullish engulfing is that the second candle opens at a lower position than the close of the first candle but closes at a higher position than the first candle. If bullish engulfing is found near the support line, it can potentially be a reversal because the line chart seems to be forming a bottom well or downward spike. Vice versa for bearish engulfing near the resistance level as it can be seen to potentially form another mountain. Due to the nature of 24/7 in crypto, it is theoretically impossible to find ideal engulfing because the open position will always be the same as the close position of the previous candle.
Judas

A candle pattern based on Judas Iscariot the disciple that betrayed Jesus as bullish Judas pattern betrays the previous bearish candle and reverses from the lows to set up a bullish reversal and vice versa for the bearish Judas. Simply, a bullish Judas is a long bearish candle followed by a bullish hammer near the support line and a bearish Judas is a long bullish candle followed by a bearish shooting star near the resistance line. Traders may try to put a position and a stop loss at the end shadow.
Stars

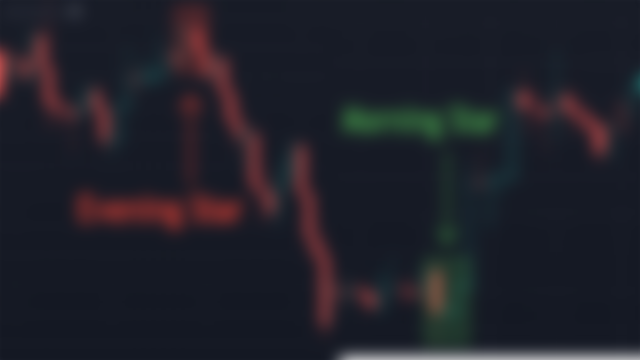
Any candle that is alone at the top or at the bottom are called stars. Some also called them abandon babies. Like how the stars are separated by the skies, abandon babies are separated by gaps. However, gaps cannot be found in crypto due to 24/7 but we can identify similar to stars as a peak candle that have shorter body than the left and right candles. A long bullish candle followed by a star and finally followed by a long bearish candle is called an evening star because bullish candle represents the day and the bearish candle represents the night, thus the star is in the evening. A morning star have a bearish candle on the left which previously was the night, the star is in the morning, and the bullish canlde on the right is the upcoming noon.
3 Inside and 3 Outside

While previous candle patterns are more to signals, 3 insides and 3 outsides candle patterns are closer to entry points. 3 inside up is when the third candle after a bullish Harami closes higher than the first candle confirming a bullish trend. 3 inside down is when the third candle after a bearish Harami closes lower than the first candle confirming a bearish trend. For 3 outsides, replace the Harami with Engulfing and see whether the third candle breaks the second candle. While it is true that many traders uses this candle pattern for confirmation but do not forget that this is only one out of many confirmations. The direction can go the opposite way and therefore to stop loss at the opposite side of the candle.
3 Line Strike

3 Line Strike consists of 3 white soldiers engulfed in a bearish candle for bearish pattern and 3 black crows engulfed in a bullish candle for bullish pattern. Ideally, the second candle should be shorter than the first candle, and the third candle should be shorter than the second candle (candle 1 > candle 2 > candle 3). The fourth candle should be equal or larger than the three candles combined (candle 4 = candle 1 + candle 2 + candle 3).
3 Method Formation
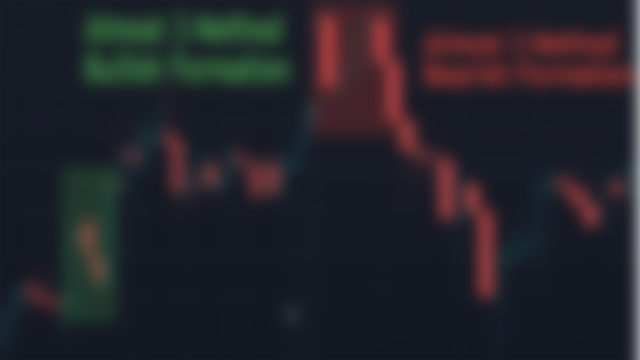
3 Method Formation is like a 3 Line Strike but with an extra previous candle where the first candle ideally equal to the last candle (candle 1 = candle 4). Like 3 Inside and 3 Outside candle pattern, 3 Method Formation is more of a confirmation candle pattern where the last candle breaks the mother candle or 1st candle. Things can go wrong so stop loss at the opposite price of the mother candle.
Wait

What does this have to do with crypto? Unlike the previous chapters where I relate crypto such as when we can dollar cost average (DCA) optimally, this candle stick pattern chapter is general trading tutorial. However, all the candles above are found in cryptocurrency charts mostly Bitcoin Cash (BCH) and some UNI, SUSHI, MATIC, etc in Trading View, which means that even candle patterns can be used in crypto trading. Do not forget to go back to the basic theory again like identifying the current trend first, whether the candle is in the supply or demand area, and check the news before making a trade decision based on the candle in my previous chapter. Go even further back to the DOW Theory to see the bigger picture first. The candle stick is just one part that needs to be confirmed with others from the wide trading perspective.
Mirrors
https://0darkking0.blogspot.com/2021/06/financial-technical-analysis-crypto_24.html
https://0fajarpurnama0.github.io/cryptocurrency/2021/06/03/fta-crypto-chapter-3
https://hicc.cs.kumamoto-u.ac.jp/~fajar/cryptocurrency/fta-crypto-chapter-3
https://trybe.one/financial-technical-analysis-crypto-narrative-chapter-3-candle-stick-patterns

...and you will also help the author collect more tips.

