 @Eybyoung
more from that month
@Eybyoung
more from that month
Bollinger Bands As My Indicator Trading is a complex matter, just like a woman. It's hard to understand and it's hard to predict the next price movements just like how woman behave. You think she's fine but the next minute she's not, in trading you think it will rise so you buy but it goes down after you bought. Isn't it complicated right?
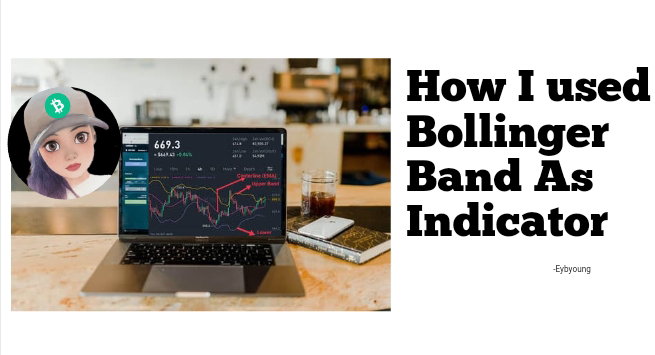
Bollinger Band is one of my favorite indicator for spot trading, if you know I used different indicators in leverage trading as well as the time frame.

I used Bollinger Band For A Short Term Trade Bollinger Band indicator was created by **John Bollinger**. The indicator consist with a **moving average** and **two bands above and below**. Bollinger Band used add and subtract in a standard deviation calculation. This standard deviation is used to measure the volatility of price that shows how it varies from it's true value. To measure the volatility, **Bollinger Bands expand themselves** with the current market conditions. How to understand the Basics of Bollinger Bands? There are basic things you need to understand how to use the Bollinger Bands indicators. I like this indicator because you don't need to plot drawings just to predict where the market is heading. No more complicated drawings that sometimes give us headaches to understand, especially if you are new in trading.
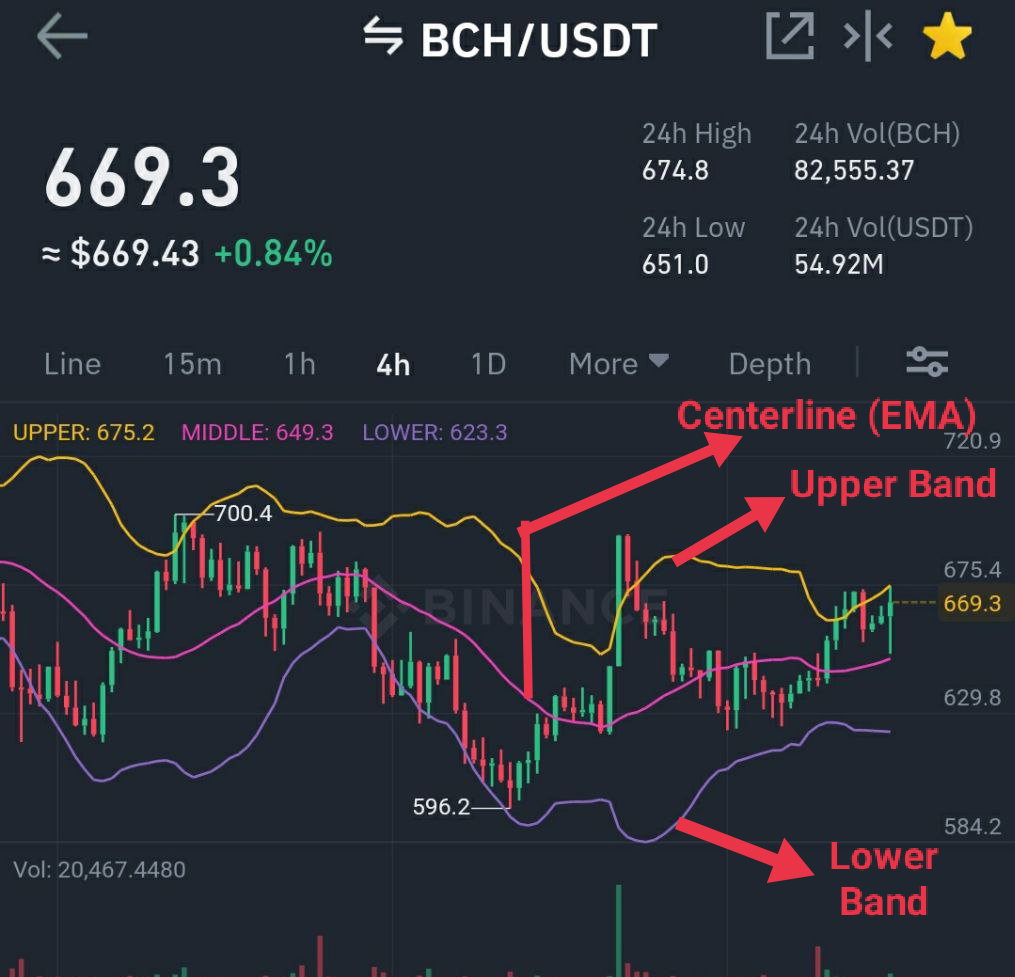
Bollinger Band indicator is consistent of three lines, the middle is the **centerline** which is called EMA (Exponential Moving Average) while the two lines is the **Upper** and **lower band**. Spotting resistance zone using Bollinger Bands Bollinger Bands is an all around indicators to me as I used to spot resistance on it. The upper band will be the resistance zone, you can easily draw horizontal line on it.
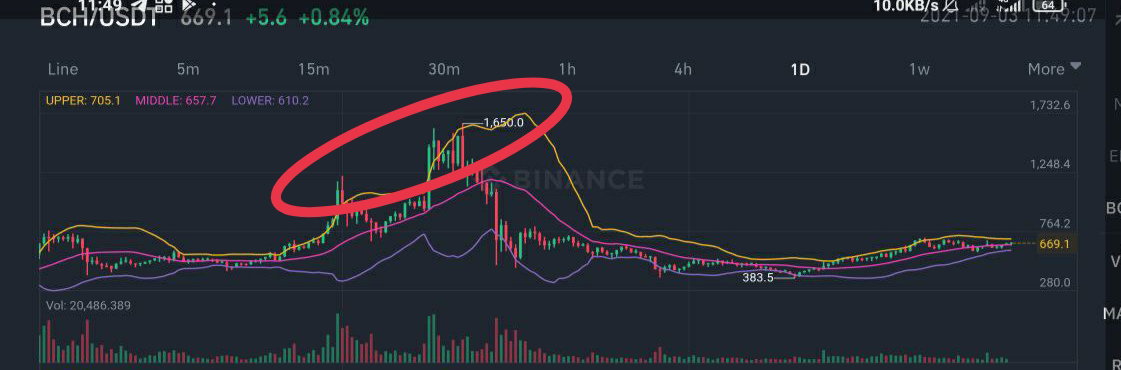
Candlestick will only keep bouncing on the upper band. When it creates new resistance prize zone it will rise above the upper band or it breaks out from the old resistance zone. It means that the price pumps hard making the candlestick rise above the upper band. Spotting support zone using Bollinger Bands Opposite to the upper band, lower band works as the support zone. It's easy to spot the support price zone using the lower band.
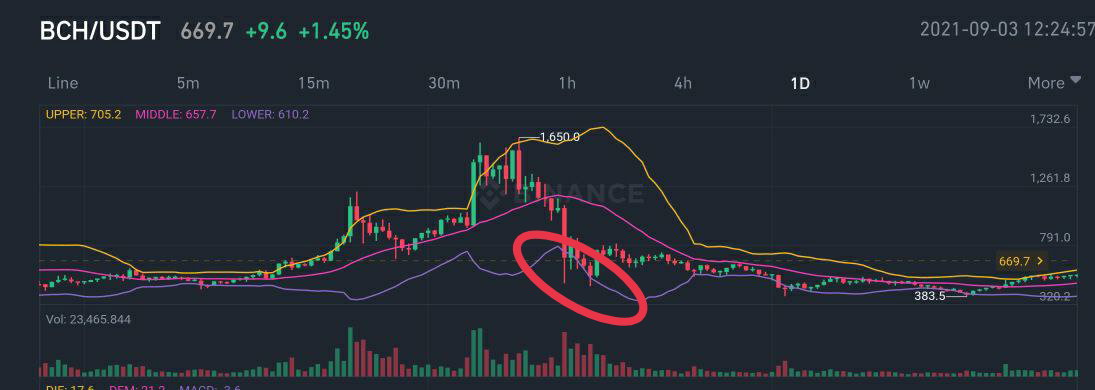
If the coin had a massive sell off, the candlestick stick will fall lower in the lower band. The lower band act as support zone if the price breaks out the candle forms below it means it breaks the old support zone. Spotting Downtrend and Uptrend using Bollinger Bands As I said Bollinger Bands is all around indicator, it can also spot the down trend and uptrend movement of the price. It will tell you where the price heading. ****Uptrend price movements (bullish)****
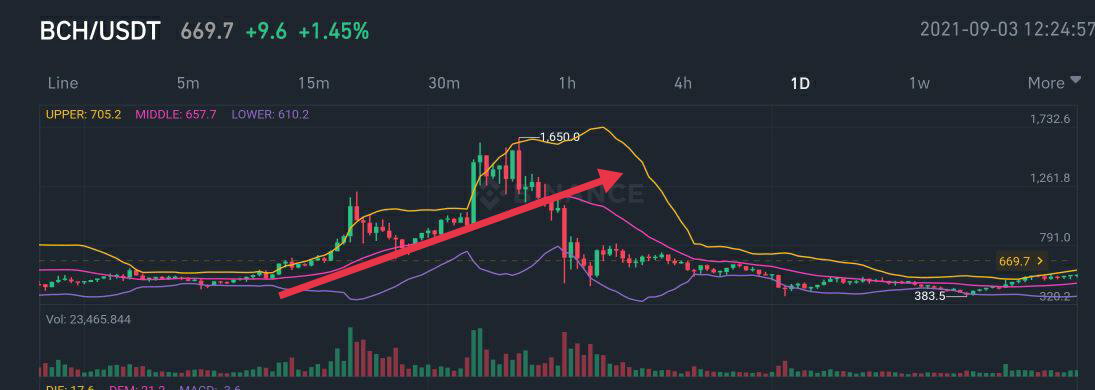
When the candlestick is trading above the centerline (EMA) or middle band it means that the price movements is in uptrend or bullish. If it falls below the middle band that's the bearish break out or price trend reversal. ****Downtrend movements (bearish)****
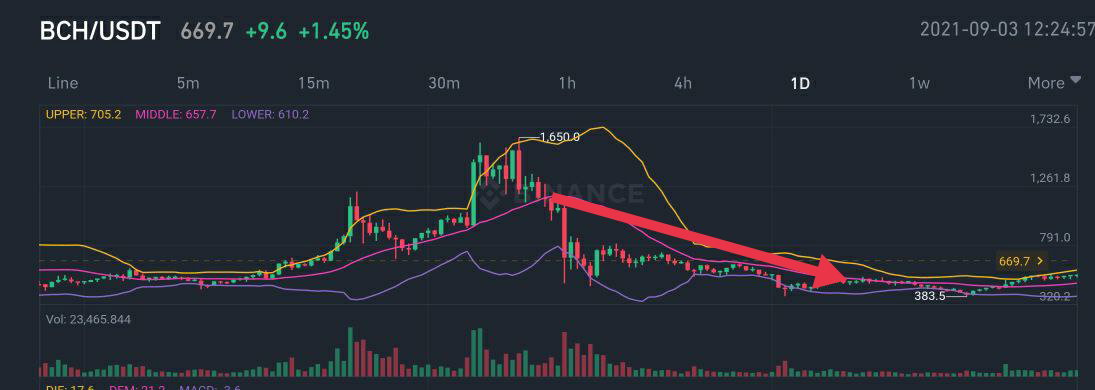
When I he candlesticks is trading below the centerline (EMA) or middle band it means that the price trends is down or bearish. When the candlestick breaks above the centerline it means that the price starting to be bullish and already changing direction or reversal. Measuring price volatility Bollinger band can also measure price volatility if it has significant pump and dump depending on how band showing. ****Expanded bands****
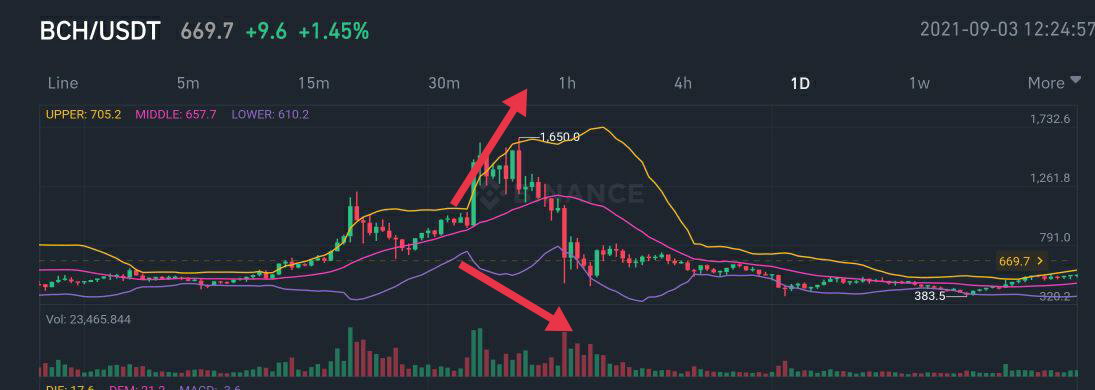
When upper band and lower band are expanding wider from, it means that the price volatility and the price surge and dump is huge. There is significant or big movements in the price. ****Compressed or tight bands****
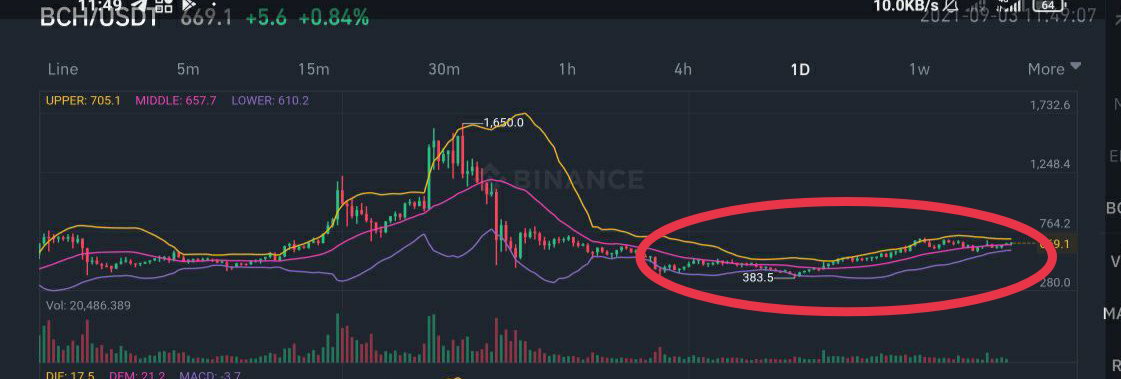
When the band are compressed, tight or close with each other it means that the volatility of the price is not that massive. The price action doesn't have any big significant movements as of the moment. Even if the candlestick is already trading above the centerline, when the bands are compressed it means no big price surge yet. Oversold and overbought When candlestick keeps bouncing or above the upper band it means that it's already overbought, while if the price keeps bouncing or below the lower band it means it's already oversold. Is it reliable to used Bollinger Bands alone? Using one indicator is not reliable although bollinger bands is all around to me I still used other indicators such as RSI and MACD. Bollinger Band is effective when combined with other indicators. If you want to know what's the perfect combi of it, then DYOR :)) All images used are mine and it is in 1D TF except the first, it's in 4hr tf.
Closing Thoughts Indicators are there to help traders determine the market movements but it cannot guarantee that we can predict the price accurately like 100%. Just like the last market crashed last May 19, 2021, although I know how to read some indicators, it didn't save me from getting stuck on my short term trade as I was asleep when it happens HAHAHA! If you want to have 100% zero losses of trading, you should be awake 24/7 and watch the chart all the time 😂 I hope you learn something from my favorite indicator, Bollinger Bands! Thank you for reading! **P.S** I am still working part 3 of my noise.cash guide in tagalog version, I'll publish it once I'm done. **Want to earn by blogging? Try** ****read.cash**** **sign up** ****here******.** https://read.cash/r/Eybyoung **Want to earn via micro blogging? Try** ****noise.cash******, sign up** ****here******.** https://noise.cash/u/Eybyoung **Want to earn FREE BCH satoshis? Try** ****Blackprice.in******, sign up** ****here********.**** https://blackprice.in/account/create?r=5105 **Want to practice trading? Try** ****Stormgain**** **earn via crypto mining. Sign up** ****here****. https://app.stormgain.com/friend/BNS17152865 **Want to have discount in fees when you trade? Try** ****Binance******, sign up** ****here********.**** https://accounts.binance.com/en/register?ref=XMQYOUVC Click the blue word **“here”** so you'll be directed to each platform. `Date Published: September 3, 2021`









43 comments
Haha bhe, napapikit na lang ako, masyadong komplikado hindi maarok ng pagiisip ko. Yang mga indicators kahit titigan ko at pag aralan ay wala pero true naman di naman sya guarantee na accurate but a good guide. Cheers bhe
Hahaha tawa ako sa hindi maarok ang lalim 😂 oo di talaga accurate yan lalo na pag long term investment dapat fundamental analysis ang gamit.
Wahh. Buti binasa ko to. Atleast, may kunti na akong kaalaman sa indicator na to. Hahaha! Bollinger Bands din kadalasan kong ginagamit pero basta Buy Low sell high lang ako sa Spot. Lols! 🤧🤣
Ang bollinger bands ayos talaga yan sa buy low and sell high.. di yan pang leverage trading pang spot talaga sya kasi matagal ang movements nya haha dependi din sa TF.
I don't even know the basics of trading charts etc. As you said just like my headache starts when I see those analyses and drawings and I don't know from where to start. Your indicator seems easy let me try this.
Try reading it with a live chart so you'll understand better m
Okay noted. Thank you for your time.
Awesome! Thank you for this. I use this too with MACD and others when I do spot trading.
Nice, same pala tayo mga indicators hehe.
Nuxx payaman! Haha
Sulat lang ba hindi na aapply hahahhahahahaha
Parang naiintidihan ko naman pag binabasa ko pero parang hindi din lol! Basa ulit :D
Haha pag nagbasa ka nyan dapat may live chart 😂 mahirap isaulo pag di nakikita sa actual haha
I have a question about blackprice.in I am trying to register myself but its showing a problem by saying user with this email/password cannot be found
Maybe you click the Sign IN not Sign UP?
I clicked register meyself
I don't know what's the problem then, it works fine in my end.
Good gracious, stick nalang ako sa hulalysis 🤧🤕. DuDuguin hindi lang ilog ko ee feeling ko pati atay ko wari maapektuhan huehue. Save ko nga ulit, reread ko.
Hahaha kaya mo yan 😂
Sasave ko muna to na gagamit ko to in the future 😅
I am studying Bollinger bands too for quite long and I think this is the best indicator... You found any Bollinger breakout then just go for it... It will gonna give you a good profit.
Yeah, bollinger band is good when you understand it fylly.
Ako sa macd at ema nag bibase lalo na sa future. Nice one..save ko to
thank you sa mga ganitong topics atleast nakaka familiarize din sa mga words kahit blurry pa ang whole trading concept for me...
Magagamit ko to in the near future. 😊 sa ngayon save muna. 😆😍 salamat po.
I'm also using BOLL in my trades, I usually use BOLL EMA RSI and MACD but my analysis and prediction is always ❌
Hahaha normal lang yan usually kasi talaga di agad mag effect yung basa mo kasi mag consolidate pa yan.
The key is learning how to use them together. Then you can put the odds a little more in your favor.
I am starting in trading and I have been studying BB, in conjunction with 3 EMA, I am guided by some messages from a telegram group, what do you recommend. Thanks, I liked your article
When it comes to indicators, it depends on you what is comfortable with you using it
I recommend following good people like Eybyoung, and the people at noise who post on trading. I would leave Telegram all together. Most of the information you get on Telegram is old news anyway . A lot of shady " experts" sell memberships to these Telegram groups in exchange for trade calls, or mentoring you so they can earn your trust, and then eventually dump their bags on you, or scam you out of your crypto under the guise of helping you invest.
I was actually still following Telegram channels, it's where I get most of crypto FUD news and good news and see what coin they are shilling then I just validate it with my own indicators, if it was in with the indicators I used I ride but if not I won't buy HAHAHA.
That's a good idea, haha!! I just don't trust them because a lot of them are shilling coins they hold bags of and then dump them on their "followers". Its usually the last one out left holding the bag. As long as you know how to verify through your TA then you can protect yourself, but for noobs it is risky because there aren't too many legit ones to follow.
Thanks for the comment, I have studied what I find on the internet, what I follow on telegram are some ads that can give you entry to investment, but I still make an analysis of what I have learned and see if I invest. The person who tries to charge for the ads, I simply delete them, there are many ways to learn, slowly but surely.
I'm still starting po about binance and kahit medyo diko pa po gets eto magegets ko po pag ulit ulitin ko pong babasahin. Save ko po muna ito ate. Salamat
Mdjo matagal tagal talaga naintindihan ang trading kahit kami matagal na di parin talaga fully wins lahat hehe learn slowly lang.
Opo. Hindi ko inaagad agad since nasa may Buy and sell palang po ako. Nag try po akong magsell kagabe at ganon po pala yon. Hehe madami papo akong matututunan hindi lang po basta nag buy and sell okay na agad diba po?
I knew it... I can't understand it very well, don't get me wrong it's not you who's the problem here it's me. I really can't catch up when the topic is about crypto. Those thing just doesn't enter my mind but I think I learned something even a little bit. Sakit po sayoo ng tradingggggg. Ahhh yuyoutube po ulit ako para manuod about Dito. Going matutupo po
It takes time to understand things about crypto, especially trading it's a complex matter. Just learn slowly.
May tinuro samin Emma 50 , 20 saka 200. Medyo dikopadin magets haha. Pero Hindi na daw sya gumagamit ng ibang indicators
Dependi kasi yan kung saan mo mas gets ang indicators yun ang mas magagamit mo.
Great job on this! I like the fact that you were able to explain the Bollinger Bands so thoroughly and make them easy to understand. I wish I was finding articles like this when I was teaching myself TA. This is some excellent advice for anyone who hates the messy charts, or someone who doesn't have a lot free time to learn all of the ins and outs of technical analysis. It's kinda like a swiss army knife of your trading toolbox. Just like a mechanic has tools , these are our tools. No one likes a messy toolbox of useless tools. You can get rid of a lot of clutter using the Bollinger Bands in combination with the RSI. To be honest, if you are risking your hard earned money on any investment, you should understand how it's price action works in the different market conditions. Sometimes I see charts from these so called professionals that have so many lines and colors it makes you dizzy. I also see a lot of people with more money than brains. They will just throw money into a project and then go around all the subreddits asking if it's a good investment, smh. Oh, and I use the Bollinger Bands to look for possible entry and exit points too. If you combine them with multi timeframe analysis, you can go into the lower timeframes, and find the best spot to enter and exit your trade for maximum return. You want the most distance between where you enter & exit. One more tip, lol. What you said about overbought/ oversold is on point too. One thing I have noticed is that once a candlestick closes above the top Bollinger Band it's usually a sign of exhaustion and the price is going to possibly roll back over & return to the middle line ( MA ) . Its attracted to it like a magnet. To me, this is what a quality article looks like. These are the articles that should be getting the huge BCH tips because you are teaching people to be self sufficient, and you are able to do it without making it over complicated. Some people are good at that. Thank goodness for them, Could you imagine me trying to write this. I can't even leave a simple reply on the subject without writing a book, hahaha.
Hahahahahhaha, you always made me laugh reading your reply. I mean not the thoughts but by writing too long that you can already make it an article hahaha! Yeah, this what I like Bollinger Bands I don't have to draw Complicated lines and etc. I was actually combining it with RSI when I am looking for overbought and oversold before buying and selling. I just understand it clearly recently actually because during the bullrun I am still learning that is why I didn't make any good profits as the market crashed happened when I was asleep hahaha