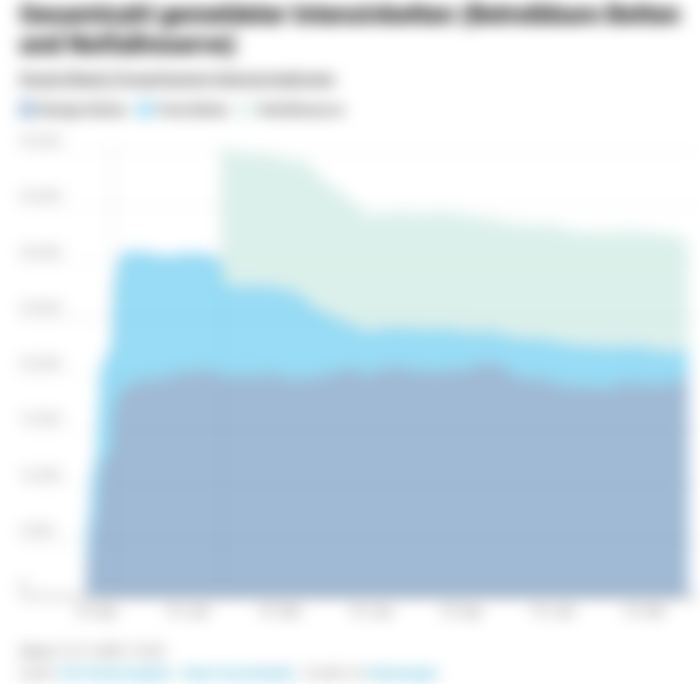
Data on hospital occupancy and hospitalizations for COVID-19 have been somewhat difficult to find and understand. On Twitter, a chart of average weekly hospital capacities in the province of Ontario, Canada, caught my eye today. It seems to originate from a closed system accessible only by health care systems analysts, so I cannot verify its accuracy. Yet it looks trustworthy and consistent with anecdotal evidence.


The graph show four overlapping curves for hospital capacities for acute care, mental health, chronic diseases, and rehab. The time span shown across the x-axis is 1 January 2018 to 31 August 2021, while the y-axis shows percentages from 60% to 100%. Focusing on acute care beds, hospital bed occupancy in 2018 and 2019 fluctuated between 95% and 100% most of the time, with peaks over 100% in early January of each year (including January 2020) and troughs just before that, around the christmas holidays of each year. In March or April 2020, occupancy rates crashed to a low of 62% due to the initial COVID-19 lockdowns and modified hospital administration procedures. The rates "recovered" to values between 80% and 90%. Over the 15 months of the pandemic captured in this dataset, hospital occupancy in Ontario never reached or exceeded pre-pandemic levels; in fact, it never even came close. Note that these data are for staffed beds, i.e. those that are truly available for immediate patient care. The current bed count in Ontario hospitals, presumably as of August 2021, is 35,563 total beds, including 22,928 acute-care beds.


Hospital utilization data for the United States are available from the HHS Protect Public Data Hub. Looking at intensive-care unit (ICU) beds only, occupancy as of 13 November 2021 amounted to 76.5% of the total of 82,235 staffed beds. ICU beds used for COVID-19 patients amount to 14.6% of the total. On the associated map, most states are marked with 70% or higher occupancy, yet three states have values between 60-70%, two states range between 50-60%, and one state (New Jersey) reports less than 50% ICU bed occupancy. Occupancy rates in the 70s (US) or 80s (Canada) do not exactly fit the narrative of being in the midst of a pandemic.

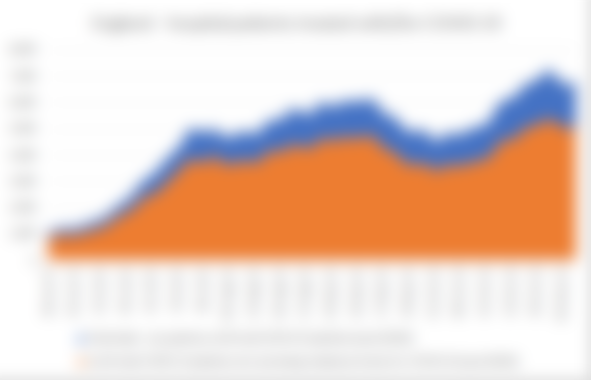
So far, we looked primarily at occupancy rates. These can greatly depend in changes to the available beds, or even the definition of a "bed". There are some highly interesting patterns in the German infectious disease agency's intensive-care registry. Specifically, in conjunction with financial incentives and new accounting methods, a new category of emergency-reserve beds was created in early August 2020 (green graph, "Notfallreserve"), while the available beds (light blue, "Freie Betten") plummeted from over 10,000 to a mere 2,500 over the course of the second half of 2020. Presumably, some of the lost staffed beds are now counted among the emergency reserve, yet these beds are available only with a 7-day delay.


Along with the surprising decline in hospital beds came anecdotal news about the closure of entire hospitals, including two in marginalized neighbourhoods of my hometown Essen. Again, the disappearance of hospitals does not match the fear-mongering around overwhelmed ICUs and the need to triage incoming patients. Given the sheer unlimited financial resources available for the pandemic response, one might expect that hospitals, and more importantly jobs for health-care workers, be expanded rather than reduced.
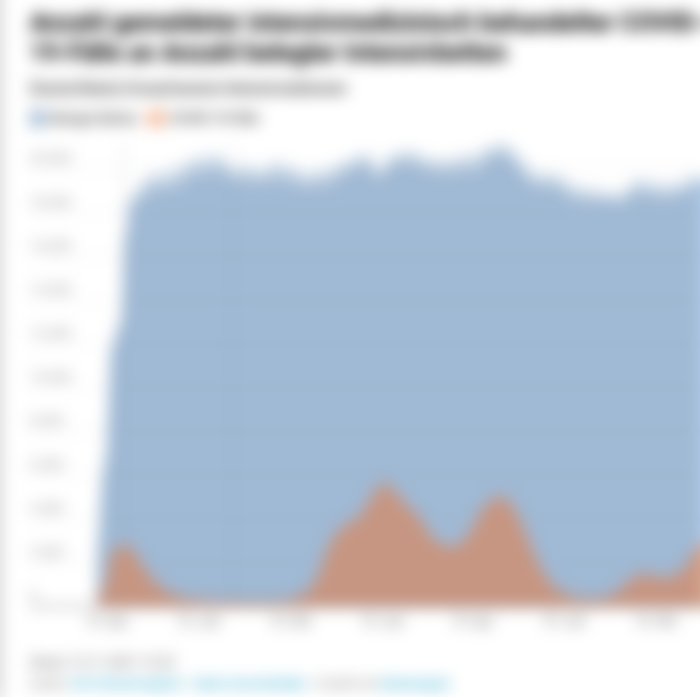

While the Ontario acute-care data discussed at the beginning of this post fluctuate quite a bit, ICU use in Germany stays quite constant over time, at a total of around 20,000 occupied beds. What is interesting to note in the above graphs is that the total occupancy (blue area) is largely independent of the occupancy with COVID-19 cases (brown area), although the latter changed significantly through waves 1-3 and a beginning 4th wave. This can hardly be explained by the deferral of planned interventions, since we are looking at emergency care here. The most logical explanation is that non-COVID patients are being replaced by COVID patients in the same cohorts.

Much has been made of the oft-ignored distinction between dying from or with COVID, and the same applies to hospitalization. It is clear that patients going to hospitals for whatever reason, who are tested positive for SARS-CoV-2 upon admission or at any time during their stay, will become part of the COVID-19 hospital statistics. For example, "Only 36.6% of pediatric patients hospitalized with COVID-19 were admitted due to an acute respiratory infection," as reported by the Public Health Agency of Canada according to a Toronto Sun article. For England, the NHS picked this issue up in June 2021 and started reporting whether confirmed COVID-19 patients were indeed being "treated primarily" for this disease or not. Through the five-months period shown in the above graph, the "true" COVID patients make up between 73% and 80% of all recorded COVID patients. This data point should help with chipping away at the doom and gloom propagated by politicians, public health officials, and the mainstream media.

Es que creo que en todos los países han ocultado cifras de al realidad del Covid no hay cifras exactas aunque las estadísticas si son exacta pero los gobernantes no les conviene que las cifras reales salgan a la luz pública