Bitcoin Cash Top-Down Technical Analysis Friday 14 May.
Top-down analysis is the way of examining something in detail from a higher point of view to the lower point of view to understand and explain it. In financial markets traders and investors, analyzing chats before making any decision by using various tools like trend lines, zones, and some indicators aim to get details and know where they can place limits and stop orders. You will see how you can use the trend line, supply, and demand zone to analyze bitcoin cash to determine its direction. Timeframes used will be monthly, weekly, and daily.
Let's get a start;
Bitcoin Monthly Timeframe.
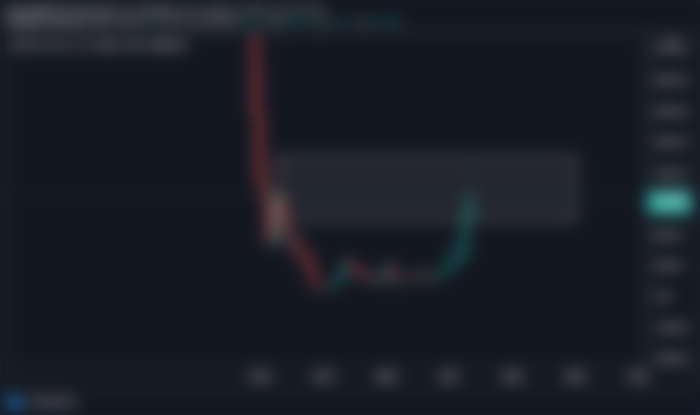
Above is the monthly time frame screenshot, after a strong bearish movement in 2018 price form a strong supply zone. But what is the supply zone, this is the zone where all the big sellers are located. In technical analysis when you see a supply zone formed especially in a higher time frame monthly or weekly, know that price may fall or consolidate for a while before gain strong momentum to break a zone and continue with its direction. Bitcoin cash monthly timeframe price is seen to reach and test to break a supply. If you want to make any decision either to buy or sell your coin, it's better to wait for a monthly candlestick to close. If monthly candlestick will close above the zone you may continue to buy, if close below the choice is yours either to sell or continue to hold.
Bitcoin Weekly Timeframe.
For the bitcoin, cash weekly timeframe price movements saw more clearly compared to the monthly chart, but structures were similar. Price now seen to respect that supply zone and start to reject, many investors around there were selling their bitcoin cash that’s why price falling. From my point of view in the weekly timeframe highly probability for price to fall may occur when more than two reversal candlesticks will form around the supply zone.
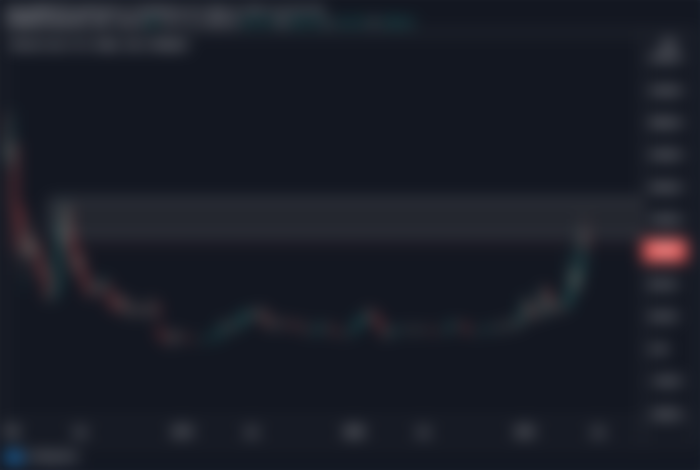
Bitcoin Cash Daily Timeframe.
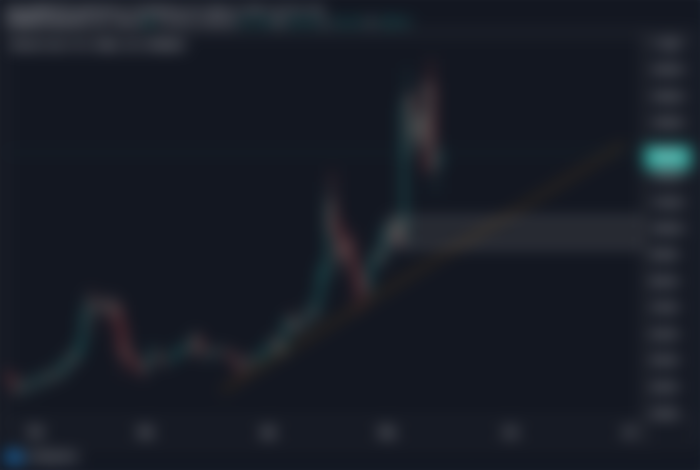
Short-term and long-term investors use daily timeframes for placing and closing their entries. In the daily bitcoin cash time frame, price forms a nice uptrend of higher high and higher low. Also previously price forms a strong demand zone, what is the demand zone, this is the zone where all the big buyers are located. For those technician investors short or long term, they're waiting for the price to touch both the trend line and demand zone and if daily reversal candlesticks will form around these zones, most of them will continue to buy.
Final Thoughts.
Based on monthly chat, candlestick does not close, and if you see previous monthly candlestick was closed in strong bullish mean that those buyers are still stronger to move the market higher. When you switch to the entry time frame (daily time frame), you found a strong uptrend. When we combine these two scenarios, we get one answer: bitcoin cash is still strongly bullish.
As we know that investing in anything requires skills and knowledge, it's a much high risk to do what you don’t know, use the proper risk management, and be patient.
Thank you for reading.
Resource
https://www.tradingview.com/x/G8uQc0wN/
https://www.tradingview.com/x/OuiSUvbc/
https://www.tradingview.com/x/syGbmTyH/