Determining the future direction of any crypto asset is always difficult. Even with multiple indicators at one's disposal, it often comes down to what Bitcoin will do in the coming hours.
Regarding the Bitcoin Cash price, a crucial time lies ahead. Several indicators are converging to create either a strong trend, or negative most of the recent gains.
The Weekly Bitcoin Cash Price Trend
All things considered, this past week has been good for BCH holders. There is a near 14% gain over the span of seven days. Albeit today may look slightly bearish, there is no immediate reason for concern just yet. The push to $400 is still in effect, even though it will not come easy.
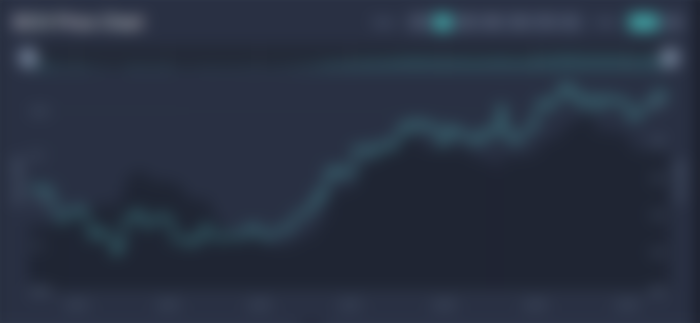

Last week, the Bitcoin Cash price briefly dipped to $300.67. Ever since, the uptrend has remained intact, all things considered. With a 84% gain in 30 days, things continue to look good. Today, one BCH is valued at $384.5, and the market shows a desire to keep moving higher.
Ensuring that growth can occur requires ample trading volume. BCH Is checking the right boxes. Today's volume sits at just over $2.058 billion. All prominent markets are BCH/USDT pairs, found on HotBit, Digifinex, LBank, FatBTC, and Huobi. In fact, the top 10 trading pairs across exchanges are all denominated in USDT.
BCH/USDT Technical indicators


Bollinger Bands: On the 4H Bitcoin Cash price chart, the Bollinger Bands are trying to narrow a bit. Not entirely abnormal, as there appeared to be some minor bearish pressure a few hours ago. For now, the uptrend remains in effect following healthy green candles.
Moving Averages: A bullish crossover between the MA20 and MA50 remain in effect. That is often seen as a continuation of the current uptrend. The MA200 is also sloping up and has surpassed $280. All in all the moving averages indicate a very healthy trend for BCH.
RSI: Over the past few days, the BCH RSI has shifted between slightly overbought and neutral territory. As it hasn't dropped by much in this period, the uptrend continues unabated. The current RSI shows signs of leveling off a bit, although a minor upward slope remains in play.
Fibonacci Retracements (BCH/USD): A crucial period dawns upon the current Bitcoin Cash price trend. It has hit, and slightly surpassed the 61.8% Fib level. In most cases, this crucial level can signal a potential trend reversal. However, the bullish momentum can easily pave the way for a next growth spurt.
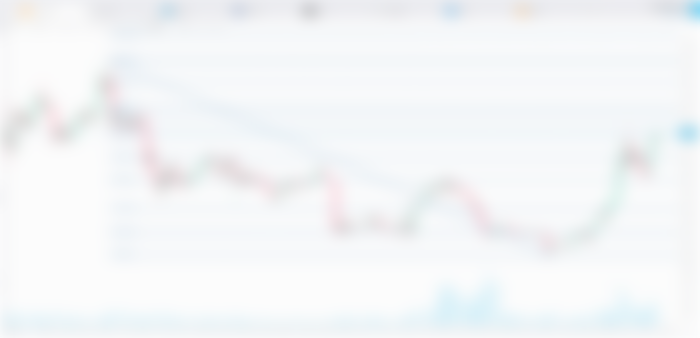

Assuming the uptrend continues, the potential top for this runs sits at $556.41. There is no guarantee that such a high level will be reached in the coming months, however. A rejection of the current Fib level can easily push the Bitcoin Cash price down to the previous level at $340.61. That level has not acted as a support line yet, thus a steep drop to $300.96 is not out of the question either.
Resistance Levels: The obvious resistance level is the current Fib level at $381.37. Albeit the price sits above it right now, this level has not been broken convincingly. That needs to happen today. If successful, the next resistance sits at $411.11 in terms of Fibonacci levels. This appears to coincide with the "normal" indicative resistance level, albeit that sits slightly lower at $410.87.
First post here on the platform, just seeing if there is any interest in daily BCH price analysis articles.