Weekly Bitcoin Cash Recap: Social Engagement dips, Liquid Market Cap Top 5
Gauging the popularity of a cryptocurrency goes well beyond the current price and trading volume. Social volume is a key factor that often gets overlooked. There is also the liquid marketcap to take into account.
**The Current Bitcoin Cash Social Sentiment**
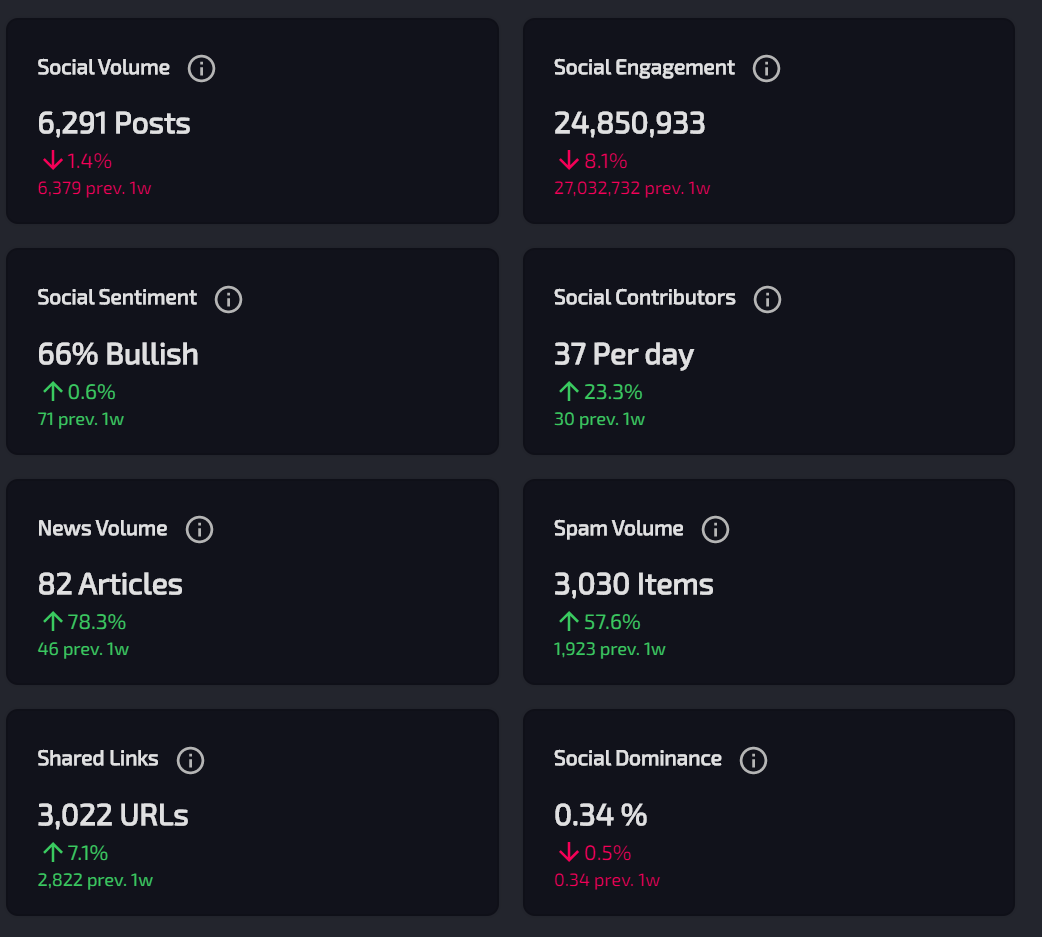
As Crypto Twitter is abuzz with hopes of a new altcoin season, the other cryptocurrencies are at risk of losing some traction. In the case of **Bitcoin Cash**, there is a **minor decrease in social volume over the past week.** That is not necessarily a terrible development, as no two weeks are the same in this industry. https://read.cash/@fintoism/more-than-435-of-the-bitcoin-cash-supply-hasnt-moved-in-over-two-years-66409b8e
What is a bit more worrisome is how the **social engagement decreased by over 8% in a week**. Such a strong decrease in engagement is unusual for any project ranked in the top 10 by market cap. Then again, altcoins are getting all of the attention right now. Recovering from this deficit should not be overly difficult.
On the other side of the social spectrum, everything has flashed green as far as BCH is concerned. There is still a **66% bullish sentiment** across all of social media. A very strong figure, given how things are evolving in the cryptocurrency space as of late.
Having more social contributors per day will also play a key role. A strong increase has been noted in this regard. Combined with the **rise in shared links and news volume,** things look promising for Bitcoin Cash. Sustaining this rate of growth is crucial in the second half of 2020.
**The BCH Liquid Market Cap**
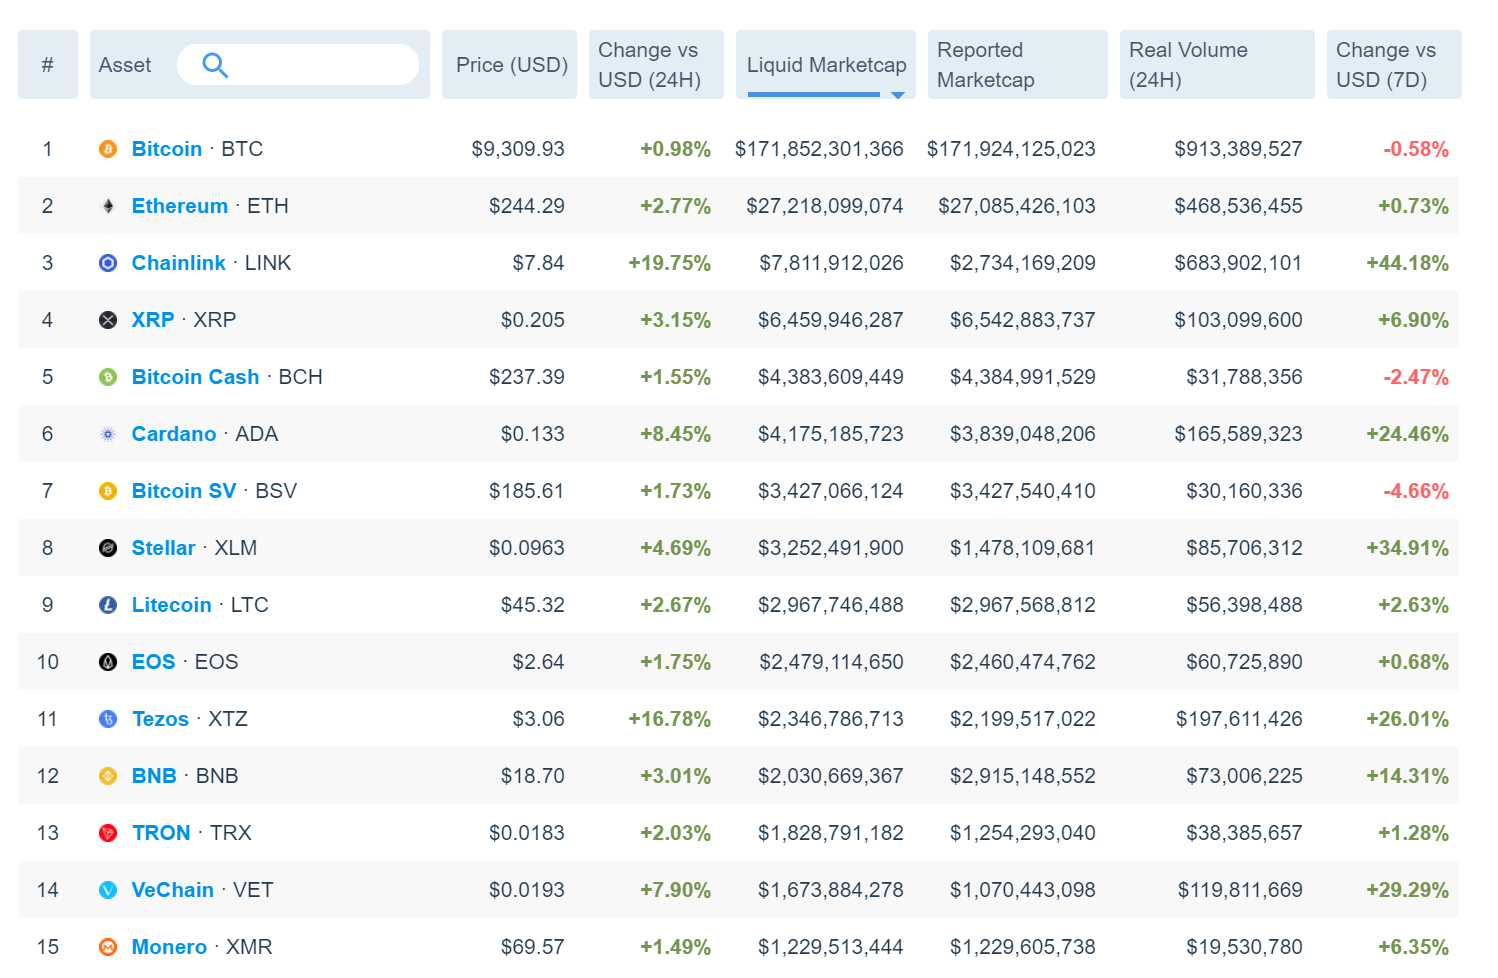
Looking at all of the "unusual" statistics no one else pays much attention to, the liquid market cap stands out. It depicts overall liquidity of a specific currency, regardless of actual trading volume, The more liquidity there is, the higher projects will rank on **Messari**. https://messari.io/
Bitcoin Cash is in a good place here. It is ranked in the fifth spot, with a liquid market cap of $4.383 billion. **This puts BCH ahead of Cardano, Stellar, Litecoin, EOS, Tezos, BNB, and so forth.** Overtaking XRP will be difficult, as there is a $2.1 billion gap at the time of writing.
More Than 43.5% of the Bitcoin Cash Supply Hasn't Moved in Over two Years
Glancing at the current dormant supply of Bitcoin Cash, there is an interesting tale to be discovered. More and more funds obtained over the past two years are being kept in wallets without moving money around. If this trend continues, the overall supply on trading platforms is bound to dwindle even further.
**Keeping BCH Funds off Exchanges**
Statistics provided by **Glassnode** confirm that there are quite a few BCH holders out there today. The most recent figures indicate that 43.7% of the entire Bitcoin Cash supply has not moved in two years or more. https://studio.glassnode.com/metrics?a=BCH&m=supply.ActiveMore2YPercent&mAvg=7
Considering how there are over 18.454 million BCH in circulation, this means that **over 8 million BCH has not moved on the network in the past two years.**
While that still leaves ample funds to be traded on exchanges, it confirms that some people are happy to sit on their Bitcoin Cash supply. Although the prices have remained around the $250 level for some time now, many still hold out hope for higher values.
Achieving a price increase in the future is not impossible. Returning to the price levels of early 2018 may be a different matter altogether, however.
**BCH Transaction Count Drops**
With more of the BCH supply remaining dormant, one would expect there to be a dip in overall network transactions. That dip is certainly apparent, although things are not looking bad by any means.
On July 5th, there were **13,481 BCH transactions** on the network. It is a sharp decrease from the 62,241 transactions in late March 2020.
Looking back in history, the current number of transactions is **on par with figures recorded in February of 2019.**
During that time, Bitcoin Cash was worth $100 per coin. As such, the transaction volume doesn't appear to be linked to the price all that much. It does make one wonder when the network will note a hefty increase in activity again.
***Do you want to see more metrics-based article pertaining to Bitcoin Cash? Give this one an upvote, and let me know on*** ***Twitter*** ***too :)*** https://twitter.com/jdebunt


Bitcoin Cash Price Analysis for 01/30: BCH/USD Hits the 62.8% Fib Level
Determining the future direction of any crypto asset is always difficult. Even with multiple indicators at one's disposal, it often comes down to what Bitcoin will do in the coming hours.
Regarding the Bitcoin Cash price, a crucial time lies ahead. Several indicators are converging to create either a strong trend, or negative most of the recent gains.
The Weekly Bitcoin Cash Price Trend
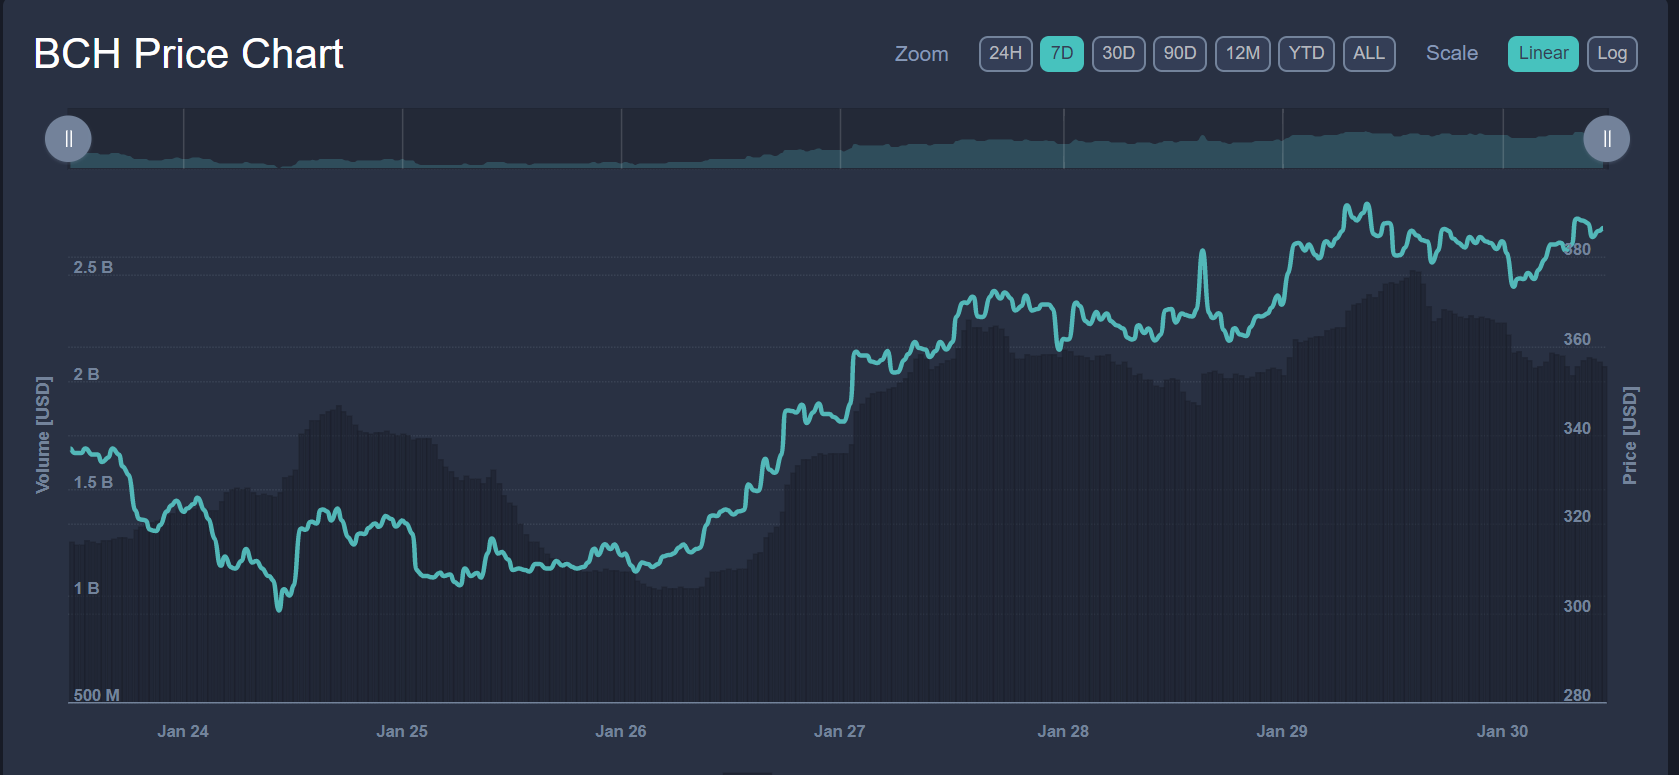
All things considered, this past week has been good for BCH holders. There is a near 14% gain over the span of seven days. Albeit today may look slightly bearish, there is no immediate reason for concern just yet. The push to $400 is still in effect, even though it will not come easy.
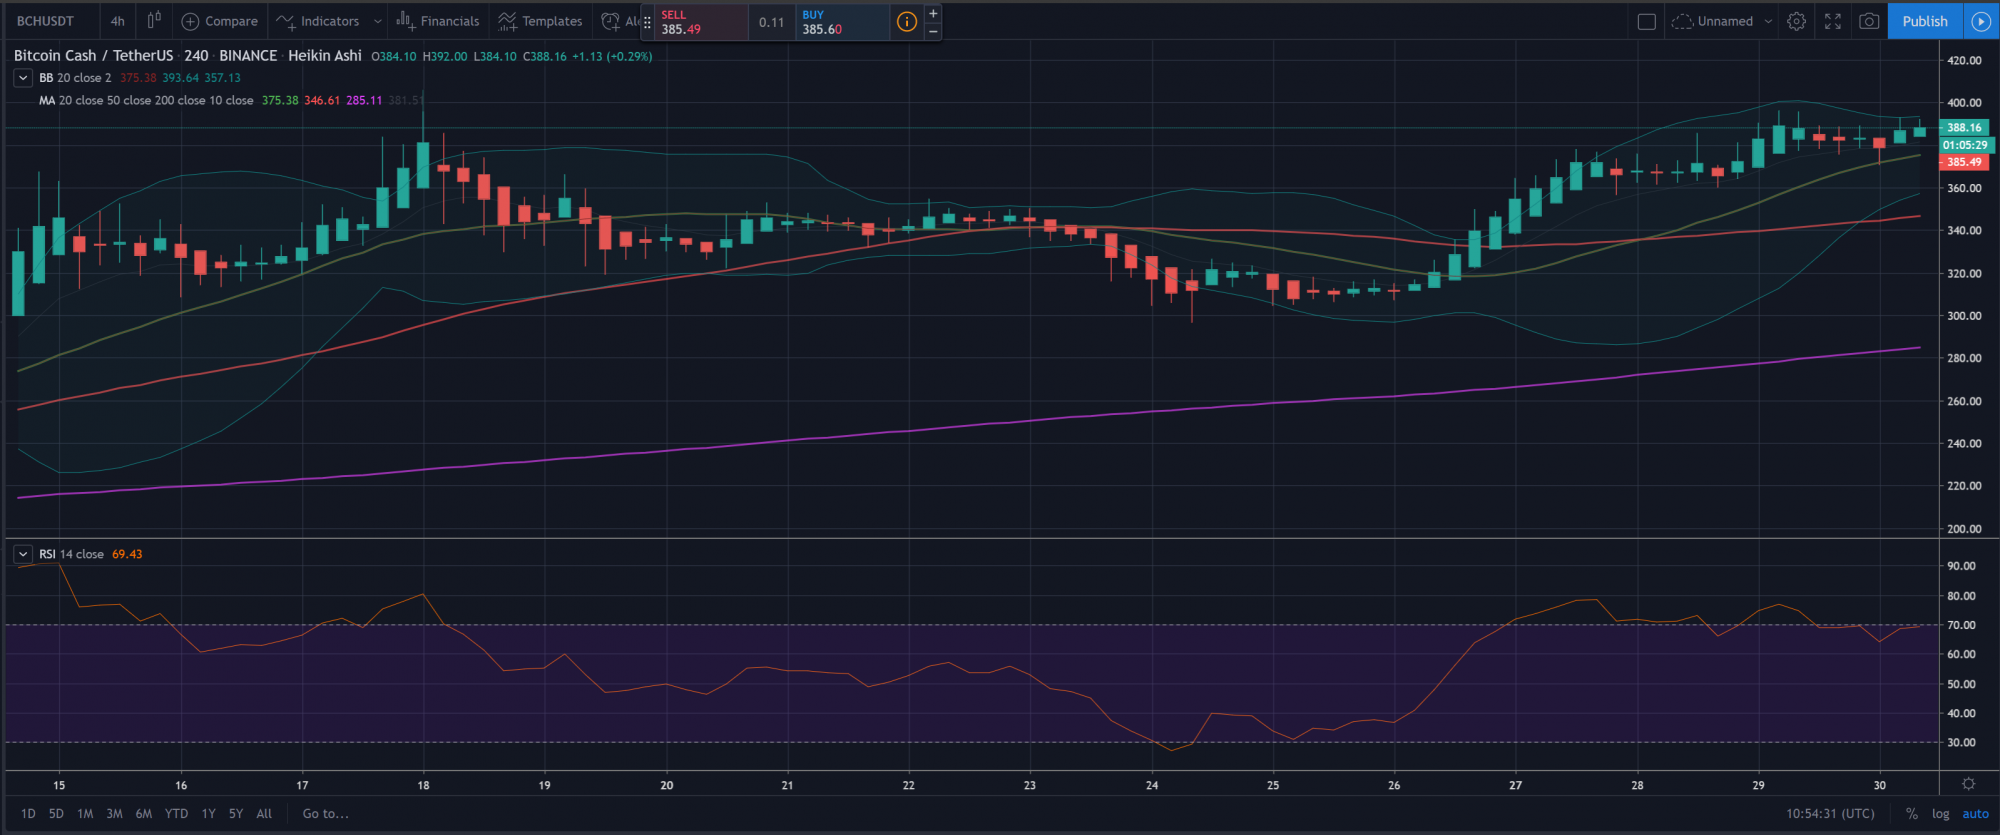
Last week, the Bitcoin Cash price briefly dipped to $300.67. Ever since, the uptrend has remained intact, all things considered. With a 84% gain in 30 days, things continue to look good. Today, one BCH is valued at $384.5, and the market shows a desire to keep moving higher.
Ensuring that growth can occur requires ample trading volume. BCH Is checking the right boxes. Today's volume sits at just over $2.058 billion. All prominent markets are BCH/USDT pairs, found on HotBit, Digifinex, LBank, FatBTC, and Huobi. In fact, the top 10 trading pairs across exchanges are all denominated in USDT.
BCH/USDT Technical indicators
**Bollinger Bands:** On the 4H Bitcoin Cash price chart, the Bollinger Bands are trying to narrow a bit. Not entirely abnormal, as there appeared to be some minor bearish pressure a few hours ago. For now, the ***uptrend remains in effect*** following healthy green candles.
**Moving Averages:** A ***bullish crossover*** between the MA20 and MA50 remain in effect. That is often seen as a continuation of the current uptrend. The MA200 is also sloping up and has surpassed $280. All in all the moving averages indicate a very healthy trend for BCH.
**RSI:** Over the past few days, the BCH RSI has shifted between slightly overbought and neutral territory. As it hasn't dropped by much in this period, the ***uptrend continues unabated***. The current RSI shows signs of leveling off a bit, although a minor upward slope remains in play.
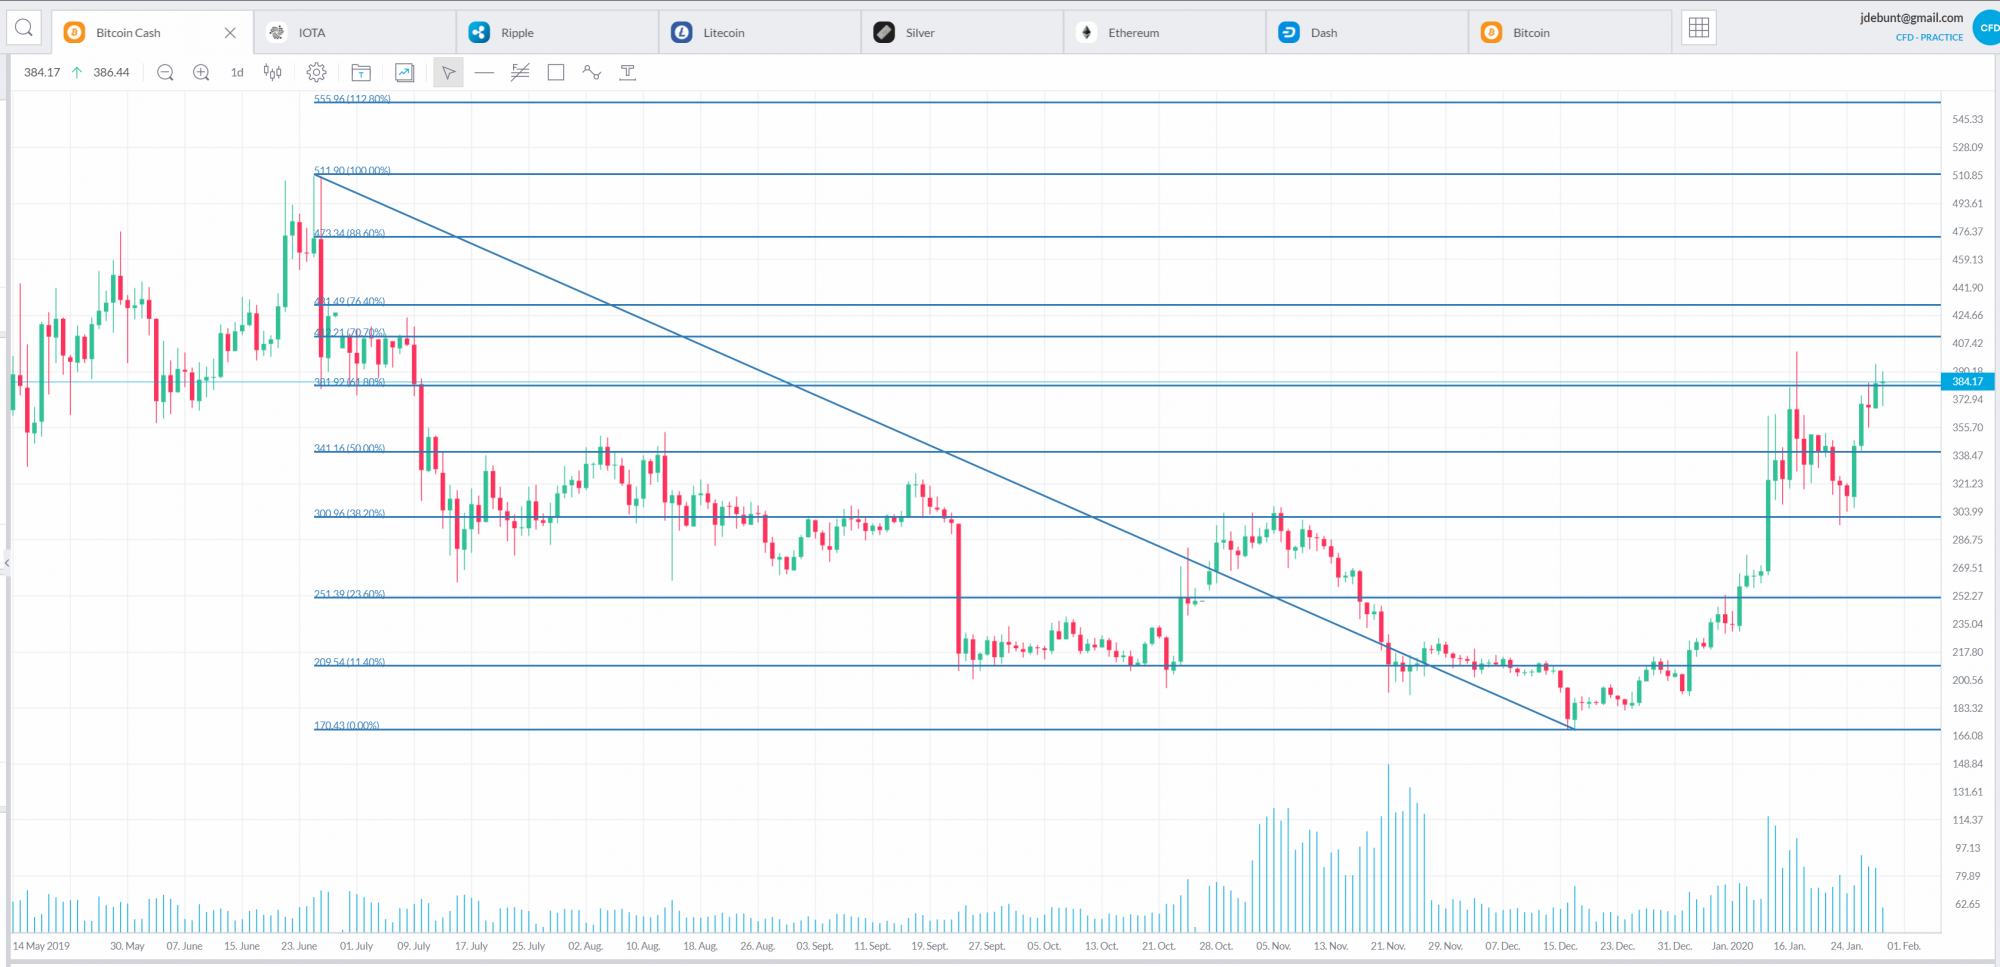
**Fibonacci Retracements (BCH/USD):** A crucial period dawns upon the current Bitcoin Cash price trend. It has hit, and slightly surpassed the 61.8% Fib level. In most cases, this crucial level can signal a potential trend reversal. However, the bullish momentum can easily pave the way for a next growth spurt.
Assuming the uptrend continues, the ***potential top for this runs sits at $556.41***. There is no guarantee that such a high level will be reached in the coming months, however. A rejection of the current Fib level can easily push the Bitcoin Cash price down to the previous level at $340.61. That level has not acted as a support line yet, thus a ***steep drop to $300.96 is not out of the question either***.
**Resistance Levels:** The obvious resistance level is the current ***Fib level at $381.37***. Albeit the price sits above it right now, this level has not been broken convincingly. That needs to happen today. If successful, the ***next resistance sits at $411.11*** in terms of Fibonacci levels. This appears to coincide with the "normal" indicative resistance level, albeit that sits slightly lower at ***$410.87***.
 @fintoism