Welcome to the first article of the To The Moon Traders Guide series! In this series, we will be covering various aspects of technical analysis. This series will also feature video content which will be released in the coming weeks! So, be sure to subscribe to our e-mail notifications and YouTube channel and stay tuned!
Since I have been into Fibonacci Arcs lately, they will be the first indicator to be covered in our series.
Fibonacci Arcs
What is a Fibonacci Arc? Fibonacci arcs are half circles that extend outward from a line connecting a high and low, called the base line. These arcs intersect the base line at the 23.6%, 38.2%, 50%, 61.8%, and 78.6%.


Fibonacci arcs represent areas of potential support and resistance. The arcs are based on both price and time as the arcs will get wider the longer the base line is, or narrower the shorter it is.
Fibonacci arcs are typically used to connect two significant price points, such as a swing high and a swing low. A base line is drawn between these two points and then the arcs show where the price could pull back to, and potentially bounce off of.
Fibonacci arcs are created by drawing a base line between two points. I typically use the high and low of a trend.
Arcs can be used on any time frame. I prefer them on the 5 minute, 15 minute, 1 hour, 4 hour and 1 day though.
Fibonacci arcs generate dynamic support and resistance levels that change over time as the arc rises or falls. The support and resistance level indicated by the arc changes slightly with each passing period.
The wideness of an arc is a function of both the distance and time a base line covers. The longer the base line the wider the arcs.
The base line is typically drawn between a significant high and low point, but could also be drawn between significant closing prices to see areas between those two points which could be important in the future.
Fibonacci arcs are based on Fibonacci numbers, which are found throughout nature and some believe help forecast financial markets.
The Sequence and Ratios
This article is not designed to delve too deep into the mathematical properties behind the Fibonacci sequence and Golden Ratio. There are plenty of other sources for that detail. A few basics, however, will provide the necessary background for the most popular numbers. Leonardo Pisano Bogollo (1170-1250), an Italian mathematician from Pisa, is credited with introducing the Fibonacci sequence to the West. It is as follows:
0, 1, 1, 2, 3, 5, 8, 13, 21, 34, 55, 89, 144, 233, 377, 610……
The sequence extends to infinity and contains many unique mathematical properties:
After 0 and 1, each number is the sum of the two prior numbers (1+2=3, 2+3=5, 5+8=13 8+13=21 etc…).
A number divided by the previous number approximates 1.618 (21/13=1.6153, 34/21=1.6190, 55/34=1.6176, 89/55=1.6181). The approximation nears 1.6180 as the numbers increase.
A number divided by the next highest number approximates .6180 (13/21=.6190, 21/34=.6176, 34/55=.6181, 55/89=.6179 etc….). The approximation nears .6180 as the numbers increase. This is the basis for the 61.8% retracement.
A number divided by another two places higher approximates .3820 (13/34=.382, 21/55=.3818, 34/89=.3820, 55/=144=3819 etc….). The approximation nears .3820 as the numbers increase. This is the basis for the 38.2% retracement. Also, note that 1 – .618 = .382
1.618 refers to the Golden Ratio or Golden Mean, also called Phi. The inverse of 1.618 is .618. These ratios can be found throughout nature, architecture, art, and biology.
….the proportion of .618034 to 1 is the mathematical basis for the shape of playing cards and the Parthenon, sunflowers and snail shells, Greek vases and the spiral galaxies of outer space. The Greeks based much of their art and architecture upon this proportion. They called it the golden mean.
William Hoffer from the December 1975 issue of Smithsonian Magazine:


How to Calculate Fibonacci Arcs
There is nothing needed to calculate a Fibonacci arc, although, here are steps and examples to help understand how they are drawn. Charting software will draw Fibonacci arcs for you.
In an uptrend, connect the most recent swing high (A) with a significant prior swing low (B). This is the base line.
If the base line goes from $10 to $20, the base line is $10 long, for example. The arc will intersect at 23.6%, 50% and 61.8% of that, plus any other levels mentioned above. For example, 23.6% of $10 is $2.36, so the arc will intersect at $20 – $2.36 = $17.64 on the chart. The 50% level will be at $15.
Once the level is found that intersects the arc, draw a perfect circle using point A as the anchor. For example, visualize using a drawing compass. The pencil starts at the 23.6% level, and the anchor would go at point A. Spin the compass to draw a full or half circle. If drawing a half circle, they only need to go up to point A. Do the same thing for the other percentage levels.
The process is the same for a downtrend. Connect a swing low (A) to a swing high (B) to form the baseline. This time, calculate the intersection point by taking the percentages of the base line in dollars and then adding them to A. Draw arcs that intersect at the percentages (23.6%, 50%, and so on) of the baseline, and use A as the anchor for drawing the circles.
Below is a very basic example of how the Fib arcs are plotted.
Base Line: A line from point A to point B
First Arc: 0.236 of Base Line.
Second Arc: Radius = .382 of Base Line
Third Arc: Radius = .500 of Base Line
Fourth Arc: Radius = .618 of Base Line
Fifth Arc: Radius = .768 of Base Line
Six Arc: Radius = 1 of Base Line
Seventh Arc: Radius = 1.618 of Base Line
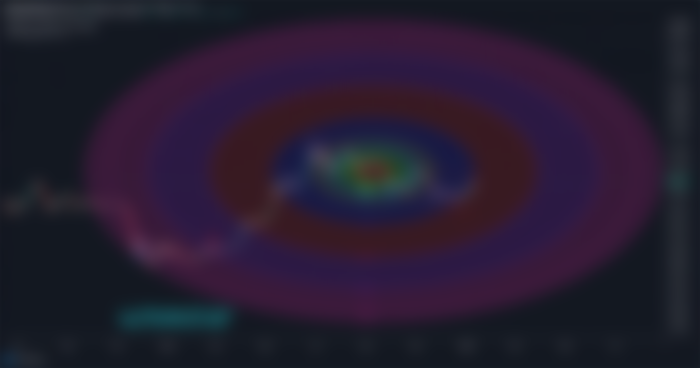
And so on… My chart below goes all the way to 4.618 of the base line.
The first step is to pick the peak and trough for the Base Line. Draw the line from trough to peak for an advance or from peak to trough for a decline.
The example above shows Bitcoin (BTC) with a Base Line from trough to peak. The radius for the first Fibonacci Arc measures 23.6% of the Base Line. The radius for the second Fibonacci Arc is in the middle of the Base Line (38.2%). The radius for the third Fibonacci Arc measures 50% of the Base Line.
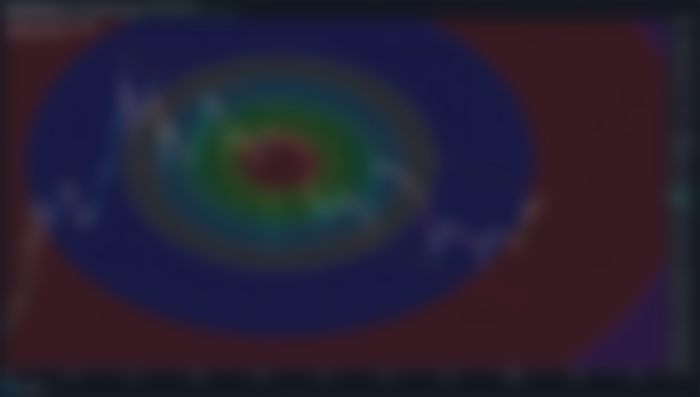

The arcs on Trading View extend out all the way to 4.618. Below is a zoomed out view of the full chart.


What Does the Fibonacci Arc Tell You?
Fibonacci arcs account for both time and price when showing potential support and resistance areas.
The arcs are derived from the base line that connects a high and a low. The half circle arcs show where the price may find support or resistance in the future. Following a price rise, the arcs show where the price could pull back to before starting to rise again. Following a price decline, the arcs show where the price could rally to before starting to fall again.
Arcs are considered dynamic support and resistance levels because the arc will be at a slightly different price as it curves through each passing period of time.
Since arcs provide potential support and resistance at different levels over time, the indicator infers that pullbacks that occur very quickly could be more severe (in dollar terms) than pullbacks that take a longer time to occur. For example, following an upward move, the arcs will rise over time, meaning the respective support levels for the ensuing pullback also rise over time.
Fibonacci Arcs vs. Fibonacci Retracements
Fibonacci Retracements align with Fibonacci Arcs at the baseline intersection points. If you draw Fibonacci Arcs and a Fibonacci Retracements with the same baseline, the Retracement level will align with where the Arc intersects the base line.
For example, both 23.6% levels should be at the same price on the chart. Fibonacci retracements are horizontal levels, meaning they stay fixed over time. Arcs are only at the intersection point once.
For every other period, they will be moving based on the radius of the arc. Retracement levels are static, while Arc levels are dynamic.
Limitations of Using Fibonacci Arcs
Fibonacci arcs are meant to highlight areas of possible support and resistance, but there are no assurances the price will stop or reverse at these levels. Also, since there are multiple arcs, it is not evident in advance which arc will provide support/resistance, if any.
Fibonacci arcs are often combined with other forms of technical analysis, such as chart patterns and technical indicators.
Traders might use Fibonacci arcs to identify potential areas of support and resistance, but wait until the price pauses and then begins to reverse off the level (starts moving back in the trending direction) before making a trade in the trending direction.
Be sure to follow me, join the official To The Moon Telegram Group, subscribe to our mailing list for notifications (in the right sidebar), and follow/sub us on Twitter & YouTube!
Original post at: https://tothemoon.blog/trading/ttm-traders-guide-fibonacci-arcs-fibonacci-circles/