Candlestick patterns are used to predict the future direction of price movement. Here we have 16 of the most common types of candlestick patterns. Discover what they mean and how you can use them to identify new trading opportunities and trends.
What are candlesticks?
The Japanese began using technical analysis to trade rice in the 17th century. While this early version of technical analysis was different from the US version initiated by Charles Dow around 1900, many of the guiding principles were very similar:
The “what” (price action) is more important than the “why” (news, earnings, and so on).
All known information is reflected in the price.
Buyers and sellers move markets based on expectations and emotions (fear and greed).
Markets fluctuate.
The actual price may not reflect the underlying value.
According to Steve Nison, candlestick charting first appeared sometime after 1850. Much of the credit for candlestick development and charting goes to a legendary rice trader named Homma from the town of Sakata. It is likely that his original ideas were modified and refined over many years of trading, eventually resulting in the system of candlestick charting that we use today.
A candlestick is a way of displaying information about an asset’s price movement. Candlestick charts are one of the most popular components of technical analysis, enabling traders to interpret price information quickly and from just a few price bars.
Candlesticks on a chart have three basic features:
The body, which represents the open-to-close range. This is the thick part of the candle.
The wick, or shadow, that indicates the intra-day high and low. Shows as a thin line above and below the candle body.
The color, which reveals the direction of market movement; a green (or white) body indicates a price increase, while a red (or black) body shows a price decrease.


Over time, individual candlesticks form patterns and trends that traders can use to recognize major support and resistance levels. There are many candlestick patterns that indicate an opportunity within a market – some provide insight into the balance between buying and selling pressures, while others identify continuation patterns or market indecision.
Before you start trading, it’s important to familiarize yourself with the basics of candlestick patterns and how they can inform your decisions.
It is also important to note that these patterns should not be used alone. Always use them in conjunction with other forms of technical analysis!
Bullish candlestick patterns
Bullish patterns may potentially form after a market downtrend, and signal a reversal of price movement. They are an indicator for traders to consider opening a long position to profit from any upward trajectory.
Hammer/Hanging Man
The hammer candlestick pattern is formed of a short body with a long lower wick, and is found at the bottom of a downward trend.
A hammer shows that although there were selling pressures during the day, ultimately a strong buying pressure drove the price back up. The colour of the body can vary, but green hammers indicate a stronger bull market than red hammers.


Inverse hammer/hanging man
A similarly bullish pattern is the inverted hammer. The only difference being that the upper wick is long, while the lower wick is short.
It indicates a buying pressure, followed by a selling pressure that was not strong enough to drive the market price down. The inverse hammer suggests that buyers will soon have control of the market.


Bullish engulfing
The bullish engulfing pattern is formed of two candlesticks. The first candle is a short red body that is completely engulfed by a larger green candle.
Though the second day opens lower than the first, the bullish market pushes the price up, culminating in an obvious win for buyers.


Piercing line
The piercing line is also a two-stick pattern, made up of a long red candle, followed by a long green candle.
There is usually a significant gap down between the first candlestick’s closing price, and the green candlestick’s opening. It indicates a strong buying pressure, as the price is pushed up to or above the mid-price of the previous day.


Morning star
The morning star candlestick pattern is considered a sign of hope in a bleak market downtrend. It is a three-stick pattern: one short-bodied candle between a long red and a long green. Traditionally, the ‘star’ will have no overlap with the longer bodies, as the market gaps both on open and close.
It signals that the selling pressure of the first day is subsiding, and a bull market is on the horizon.


Three white soldiers
The three white soldiers pattern occurs over three days. It consists of consecutive long green (or white) candles with small wicks, which open and close progressively higher than the previous day.
It is a very strong bullish signal that occurs after a downtrend, and shows a steady advance of buying pressure.


Bearish candlestick patterns
Bearish candlestick patterns usually form after an uptrend, and signal a point of resistance. Heavy pessimism about the market price often causes traders to close their long positions, and open a short position to take advantage of the falling price.
Hanging man
The hanging man is the bearish equivalent of a hammer; it has the same shape but forms at the end of an uptrend.
It indicates that there was a significant sell-off during the day, but that buyers were able to push the price up again. The large sell-off is often seen as an indication that the bulls are losing control of the market.


Shooting star
The shooting star is the same shape as the inverted hammer, but is formed in an uptrend: it has a small lower body, and a long upper wick.
Usually, the market will gap slightly higher on opening and rally to an intra-day high before closing at a price just above the open – like a star falling to the ground.


Bearish engulfing
A bearish engulfing pattern occurs at the end of an uptrend. The first candle has a small green body that is engulfed by a subsequent long red candle.
It signifies a peak or slowdown of price movement, and is a sign of an impending market downturn. The lower the second candle goes, the more significant the trend is likely to be.


Evening star
The evening star is a three-candlestick pattern that is the equivalent of the bullish morning star. It is formed of a short candle sandwiched between a long green candle and a large red candlestick.
It indicates the reversal of an uptrend, and is particularly strong when the third candlestick erases the gains of the first candle.


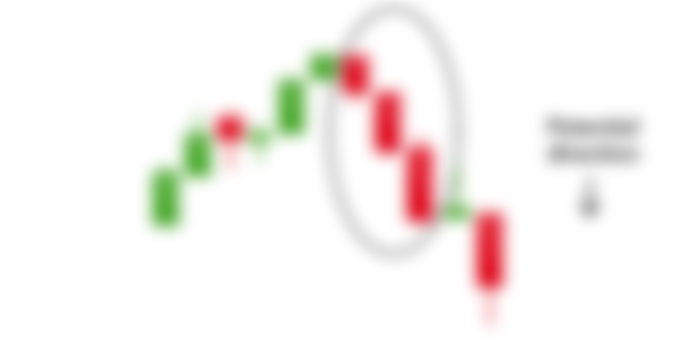
Three black crows
The three black crows candlestick pattern comprises of three consecutive long red candles with short or non-existent wicks. Each session opens at a similar price to the previous day, but selling pressures push the price lower and lower with each close.
Traders interpret this pattern as the start of a bearish downtrend, as the sellers have overtaken the buyers during three successive trading days.

Dark cloud cover
The dark cloud cover candlestick pattern indicates a bearish reversal – a black cloud over the previous day’s optimism. It comprises two candlesticks: a red candlestick which opens above the previous green body, and closes below its midpoint.
It signals that the bears have taken over the session, pushing the price sharply lower. If the wicks of the candles are short it suggests that the downtrend was extremely decisive.


Continuation candlestick patterns
If a candlestick pattern doesn’t indicate a change in market direction, it is what is known as a continuation pattern. These can help traders to identify a period of rest in the market, when there is market indecision or neutral price movement.
Doji
When a market’s open and close are almost at the same price point, the candlestick resembles a cross or plus sign – traders should look out for a short to non-existent body, with wicks of varying length.
This doji’s pattern conveys a struggle between buyers and sellers that results in no net gain for either side. Alone a doji is neutral signal, but it can be found in reversal patterns such as the bullish morning star and bearish evening star (if a doji appears after a long red or green candle, this could indicate the movement is losing pressure and ready to reverse).


Spinning top
The spinning top candlestick pattern has a short body centred between wicks of equal length. The pattern indicates indecision in the market, resulting in no meaningful change in price: the bulls sent the price higher, while the bears pushed it low again. Spinning tops are often interpreted as a period of consolidation, or rest, following a significant uptrend or downtrend.
On its own the spinning top is a relatively benign signal, but they can be interpreted as a sign of things to come as it signifies that the current market pressure is losing control.


Falling three methods
Three-method formation patterns are used to predict the continuation of a current trend, be it bearish or bullish.
The bearish pattern is called the ‘falling three methods’. It is formed of a long red body, followed by three small green bodies, and another red body – the green candles are all contained within the range of the bearish bodies. It shows traders that the bulls do not have enough strength to reverse the trend.


Rising three methods
The opposite is true for the bullish pattern, called the ‘rising three methods’ candlestick pattern. It comprises of three short reds sandwiched within the range of two long greens. The pattern shows traders that, despite some selling pressure, buyers are retaining control of the market.


Practice reading candlestick patterns
The best way to learn to read candlestick patterns is to practice entering and exiting trades from the signals they give. This can only be earned through real world experience.
Many exchanges offer simulated trading accounts which give you simulated money to practice trading with in real markets! Open an account on Bybit to take advantage of their simulated trading platform. I always recommend that new traders do this before risking any real money.
When using any candlestick pattern, it is important to remember that although they are great for quickly predicting trends, they should not be used alone. It’s always best to use them alongside other forms of technical analysis to confirm an overall trend.
Be sure to join the official To The Moon Telegram Group, subscribe to our mailing list for notifications (in the right sidebar), and follow us on Twitter!
Original post from my blog: https://tothemoon.blog/trading/ttm-traders-guide-candlestick-patterns-you-should-know/

This is very important to know the pattern and direction of price movement. This article explained it very beautifully. We should also try https://www.btcc.com/ a trading website. Here we find all strategies that how we can do trading perfectly. I want to say thanks for this service.