Cryptocurrencies are known as an asset with high volatility which might be a good or bad thing depending on who you ask as it means high risk reward. As a result bullish and bearish have become some of the most common terms to describe market trends. To traders, acquiring the ability to analyze these two states is a survival skill to predict future scenarios to gain or protect their funds. Will the market swipe downward with its claws or thrust its horns upwards?
Let’s talk about what bull and bear market are and which one is more favorable for trading.


The two terms are very popular when looking at price charts, where an uptrend is known as a bull market and a downtrend as a bear market. The bear swipes downwards while the bull thrust upwards. These two trends are an essential part of technical analysis.
In this technique, crypto traders will watch the price developments throughout a period then based on the historical data, make judgments and predictions about possible upcoming adjustments in the short term, medium or long-term.
In the basic understanding, there are three main types of trends in the price charts


1. Uptrend - getting higher
2. Downtrend – getting lower
3. Sideways trend – the price hovers around a level without a big change
The average trend in the market will be what is used to talk about a bearish or bullish market. In the charts, the bullish trends are usually displayed in green while the bearish are in red. Professional traders often define a bull market as a rise of over 20 percent in the price occurring between two declines of 20 percent. While on the other hand, a bear market is a situation where a decrease of more than 20 percent takes place after a rise of 20 percent and before another 20 percent rise.
Speaking of bull and bear, there is a fundamental rule: a bullish trend is a sign of buying as you may want to pick up more while a bearish trends blows a stop whistle giving you a warning for selling before the market falls.
Resistance and Support
Resistance refers to a level at which a bullish trend is expected to bounce and the support level is aligned where bearish trends are projected to halt. These two indicators are demonstrated by flat lines in the chart and are important for you to recognize remarkable points throughout the price movements.
Candlesticks
There are several common scenarios that candlesticks can describe depending on its type.
Bullish trends candlestick
1. The hammer type with a green bowl on the top of the line indicating the market is moving down sharply before recovering at the close


2. The inverted hammer stick with a bowl sticking to the bottom of the line while implies that the price underwent both an uptrend and a downtrend in one session and now just began to move up a bit

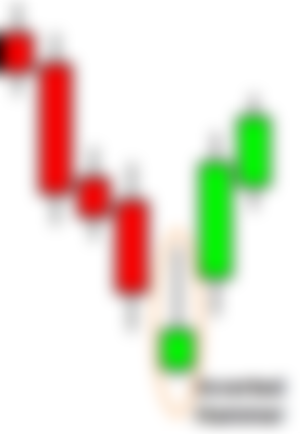
Bearish trends candlestick
1. A bear on the top is called a hanging man which happens when a recession is starting to take place after the price rose to the highest point in the session

2. Shooting star candlestick is a bear lying in the bottom showing a severe decline to a lower point compared with the opening price

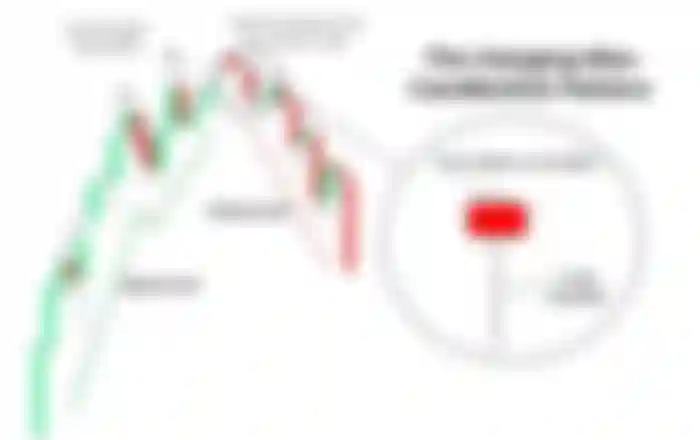
Head and Shoulder and the reverse Head and Shoulder


A head and shoulder scenario shows a pattern in which a bullish trend is turning bearish. It resemble a big head and two shoulders on the head sides with the peaks lower than the highest point of the head. It indicates a big slump might be following. The red flat line known as the neckline is the final call for selling on the other hand, the reverse head and shoulder patter gives us a forecast for an uptrend with the neckline being the signal to buy
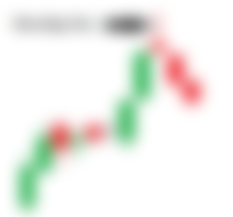
Ascending and descending triangles


An ascending triangle is commonly used to illustrate a bullish trend where the resistance level and the higher loads meet up at the breakthrough point which is a signal to buy. Conversely, a descending triangle indicates a downtrend in which the lower high in the support line are connected at the breakthrough point signaling to sell.
Bull flag/Bear flag
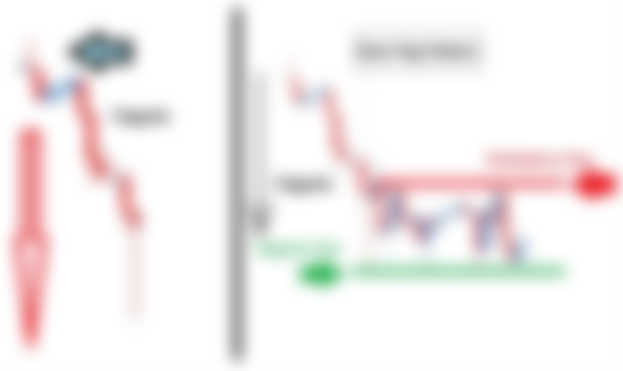


A bull flag resembles a flag on a pole representing a rally in the price. In this patter, the sharp rise is pointed out by the pole which will possibly be followed by a bullish breakout. In contrast, a bear flag indicates a drastic drop in the price and the pole highlights the mark where the price is consolidated. After that, a bearish breakout will burst out and you might want to sell your crypto as soon as possible.
If you want to get in into trading, this strategies or patterns can help you out. Though it’s not guaranteed a 100 percent but with proper research and a little luck, I know you can make it. And one more thing, this is just the peak of an iceberg. As you go deeper you’ll discover more about analyzing bullish and bearish crypto markets. Good luck!

good job bro...keep it up