
It’s important to understand that whatever the other major alt coins indicate in how different they are from BTC (smart contracts, proof of stake, energy consumption, transaction time, etc.) at the end of the day they will follow BTC.
Bitcoin Dominance Index (BDI)
For the benefit of everyone BDI is the ratio of market cap of BTC to the entire market cap of the crypto market. Therefore, when BDI is high it means that money is flowing into BTC from alt coins, and when BDI is low it means vice versa, i.e. investors are now taking money out of BTC and investing in other alt coins.
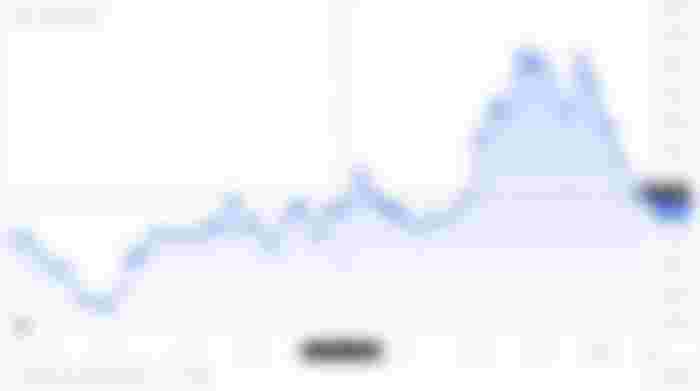

So, let’s see what does BDI says today. On a week on week basis the BDI has dropped from its high of around 49.26 (28 July 2021) to around 46.76 today. This current market also attests to this as both BTC and alt coins have dropped by ~ 10% from the high of around $42,377 on 28 July.
Bitcoin dominance is a good indicator to use along with your technical analysis as it too can be used for a shorter period, showing the movement of money in the market. Using BDI investors can decide on the allocation between BTC and alt coins.
Bitcoin Fear & Greed Index
Another data point that investors should be aware of when analysing the market is the fear and greed index for BTC. It’s a well-known fact that market runs more on emotions than on calculated analysis. Therefore, https://alternative.me/came up with an index to measure the emotions running in the bitcoin market at any given day. The reading oscillates between 0 (extreme fear) and 100 (extreme greed) and is updated on a daily basis.


Extreme fear means investors are too scared and are wary of buying and that can be a good indicator of a buying opportunity. Similarly when investors are too greedy and are FOMOing, it can be a good time to come out of your positions or short sell. One should also see the historical values to understand were the market has moved in terms of the overall sentiments.
To create the ‘fear & greed index’ the data is sourced and covers 5 different aspects,
Volatility –Higher the volatility in the market higher is the greed.
Market momentum/ Volumes –High buying volumes in a market which has positive momentum on its side for few days continuously shows a greedy market.
Social media presence – A very high mention of BTC within a very short period of time indicates that market is bullish on BTC and vice versa.
Dominance – explained above. More dominance of BTC means market is greedy.
Trends – Search volume along with what was searched for that coin, as in was it positive or negative. Higher volumes with positive search parameters indicate again a greedy market.
Even though the fear & greed index is not a solid parameter in itself to take a decision on the direction of your position, it can be coupled with your technical analysis and bitcoin dominance to arrive at a decision to either buy or sell or just to remain out of the market and wait for a better opportunity.
Thus, both bitcoin dominance index and fear & greed index can be a great addition to your arsenal and when used along with your technical analysis can result in arriving at much better decisions and opportunities.

Hey, considering your area of interest is in crypto, how about writing about BCH instead? read.cash and noise.cash promotes and gives earnings in BCH. Just a thought :)