Hello readers!
When we buy something, especially an investment asset, we would like to know its estimated worth or "fair value".
Bitcoin, being a new technology, is especially hard to assess. Many models have been developed to help estimate bitcoin's fair value. One of the most successful is the Trololo trend line. The following is a review of this nice indicator, answering a few basic questions about it.
What Is The Trololo Trend Line?
Trololo trend-line is a logarithmic regression fit of all past data points for bitcoin or for total cryptocurrency market capitalization since Bitcoin inception (2010). For bitcoin, the market capitalization is the total value of all the coins that have been mined. The total crypto market capitalization is the sum of all individual market caps of every cryptocurrency tracked.
Charting this trend line is useful to assess the current fair value of bitcoin or cryptocurrency market. Comparing the current value to this indicator helps to judge whether the current bitcoin or the cryptocurrency market valuations are cheap, expensive, or fairly priced.

This way, you can consider selling when the market is extremely overvalued, and buying when it is undervalued.
The original work was done by someone named Trolololo, who discussed it in bitcointalk.com message board back in October 2014 when BTC price was around $400.
Please note that the actual name is Trolololo (3 lo's), while the name most widely used for the trend line is Trololo (2 lo's).
What Is A Logarithmic Regression Line And Why Do We Draw One?
.
.
.
.
.
.
.
.
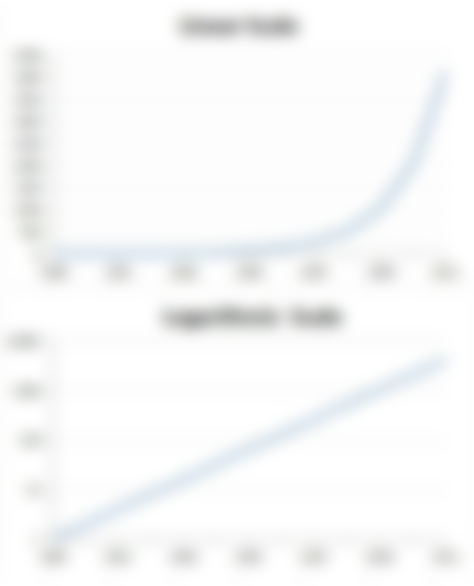
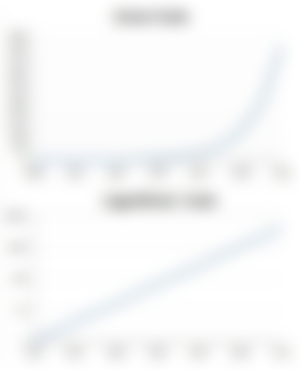
In Trololo logarithmic regression trendline, a base-10 log scale is used for the Y axis.
This means that each "tick" point on the Y axis is 10 times the previous one.
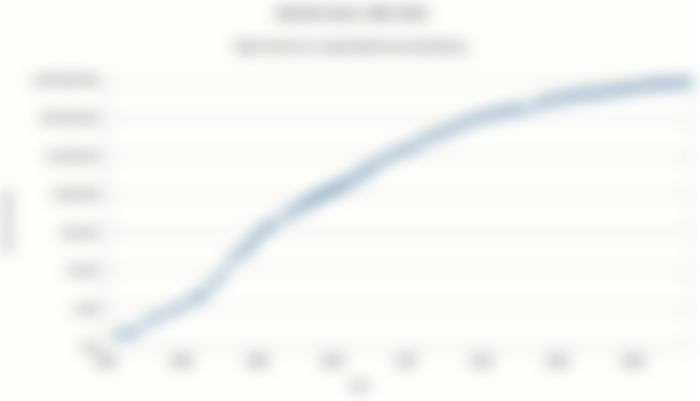

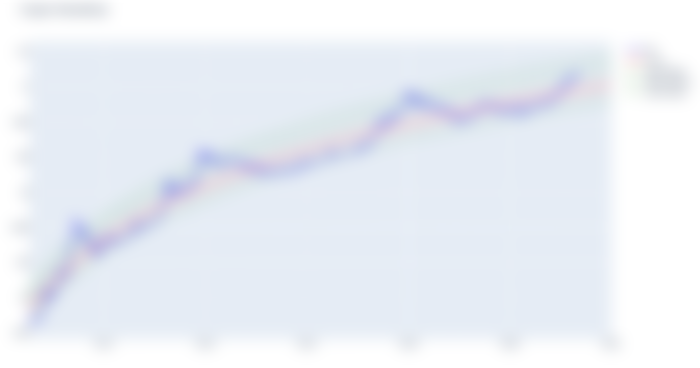
A logarithmic regression line is useful in visualizing phenomena that are fast growing but decelerating over time, such as the growth of a new technology.
For example, the logarithmic scale graph on the right plots the growth in the number of internet hosts over 30 years.
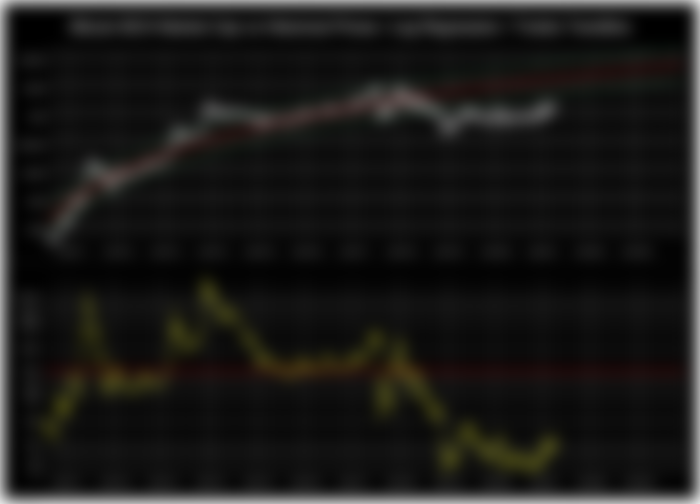
How Do I Read a Trololo Chart?

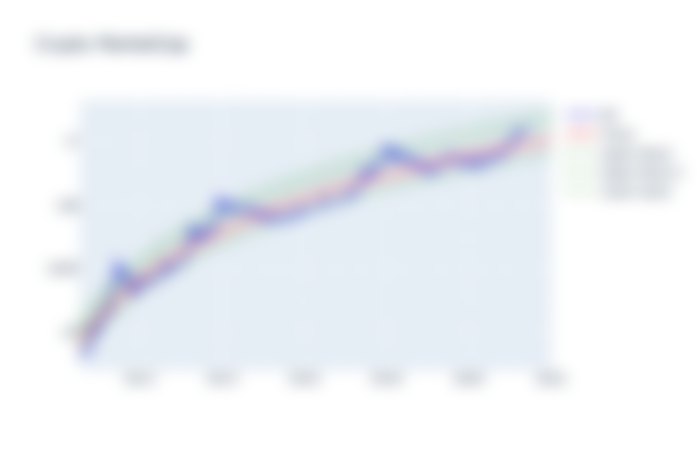
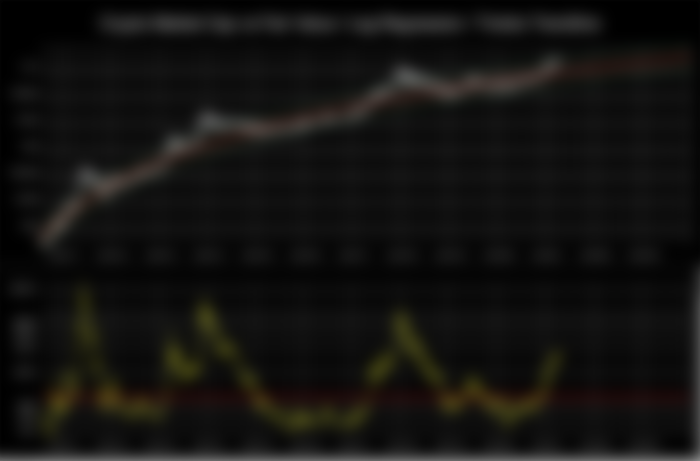
The red line represents the Trololo trend line. It is the logarithmic regression line for the market "fair" valuation. It represents Bitcoin’s (or total crypto market) stable, long-term value. This line is the “psychological mean”; the zone where long-term holders see true value.
The blue line is the actual value for Bitcoin price or for the total cryptocurrency marketcap (as in the chart above).
A lower band and two upper bands are added to represent areas of oversold, and overbought and extreme overbought.
You can see that the current fair value for total crypto market cap is around $800 Billion. The current actual value (as of May 20th) is $1.7 Trillion, about double the fair value. On aasasoft website, you can see the exact values by pointing on the Trololo chart. You can clearly see yesterday's dip (May 19th)!
The Spread Chart:
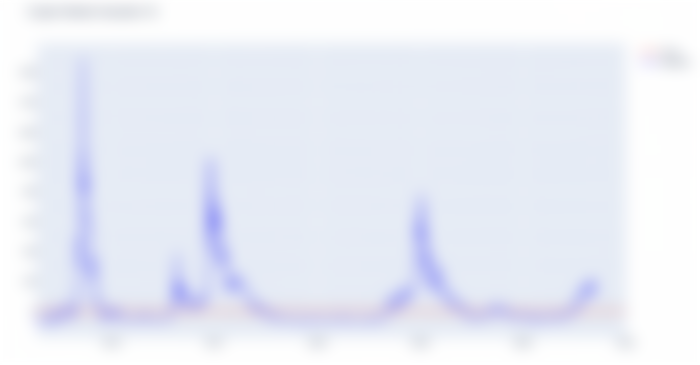

This second chart is the spread chart which shows deviation from the average (in percentage points). In other words, it is an "oscillator" that tracks the deviation between market value and fair value.
The idea is that market alternates between periods of overvaluation "bull market" and undervaluation "bear market". This happens because of the aggregate human psychology alternating between greed and fear. It is the the emotions of the crowds or "herd mentality".
The reason is, as prices go up, less and less participants sell. Everyone tends to "HODL". Actually some investors regret selling too soon, and buy back higher. This fuels the parabolic run up. The opposite happens in a bear market, where there are very few buyers. Some people start to lose hope and continue selling on the way down.

This metric clearly displays the peaks and busts of the price cycle, emphasizing the oscillations between fear and greed.
For example, you will see that at the peak of the bull market in late 2017, the crypto market was %800 overvalued. The total market cap was 8 times its fair value.
The market was undervalued in early 2020, and is starting to become overvalued again (be patient however, not necessarily time to sell yet, please see below).
Of note is that every consecutive crypto market bubble is bringing less extreme overvaluations (percentage wise).
What Are We Looking At? BTC? BCH? Total Market Cap?
Trololo trend line was originally designed for bitcoin in 2014, when it was the only cryptocurrency. Logarithmic regression line proved to be the best visualization of this new technology.
However, since 2017, BTC started to lose market share to other cryptocurrencies after it strayed away from its original goal as peer-to-peer electronic cash and became a speculation coin.
All coins market capitalization (the total market capitalization of all cryptocurrencies) became a better measure of the growth both in adoption and an market value of cryptocurrencies.
Marc De Mesel says: "I asked Trololo middle 2017, who was one of first to plot this for Bitcoin on bitcointalk.org, to make it also for Total Market Cap instead of just Bitcoin, as I felt relevance of Bitcoin Core would go down over time and less and less representative of where we are in cycle. Since then, I have been publishing it from time to time on my YouTube channel and Twitter.".
You can find the forum thread here.


Since its inception in August 2017, Bitcoin Cash BCH sought to continue the original vision of Bitcoin as electronic cash. Trololo line can be used for BCH, starting with Bitcoin in 2010, using BTC price (marketcap) until the fork, and continuing with Bitcoin BCH after August 2017 .
Another approach is to look at the total cryptocurrency marketcap excluding BTC. The idea is that we want to exclude the money that entered BTC since it was "infiltrated" around 2017. This is "bankers' money" that fueled speculation, and is not necessarily correlated with the healthy growth and adoption of the peer-to-peer electronic cash invention. This is the approach of Classic David described here.
Where Can I Find the Trololo Chart?
1. This website shows the Trololo charts for total crypto marketcap, with a daily update:
For BTC: https://aasasoft.org/investing/models/trololo_btc.html
This is the work of @HeyAxP . If you find his charts useful, please consider tipping him at the addresses at the bottom of those pages.
2. Marc De Mesel updates and shares Trololo charts for both the total marketcap and BCH:
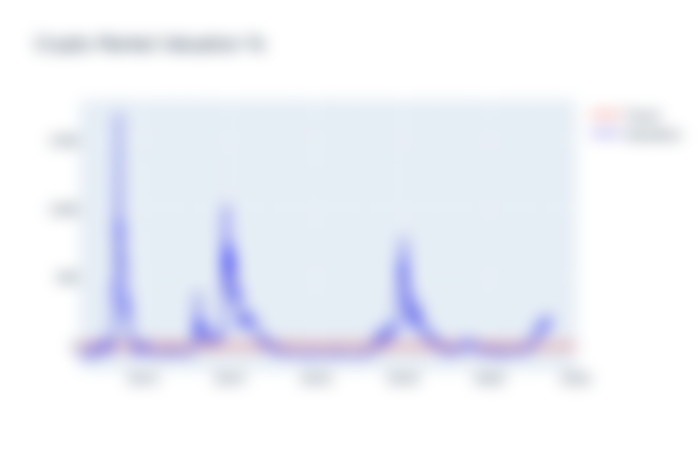
Crypto Market Cap vs Trololo Trendline / Fair Value / Log Regression
Bitcoin BCH Market Cap vs Trololo Trendline / Fair Value / Log Regression
These google sheets files are updated about once a month.
Marc has done a great job over the past few years updating the charts. His commentary and him sharing his investment portfolio and strategy are huge bonuses. You can follow him on YouTube, noise.cash or twitter.
3. Classic David did some very nice work on Marc's google sheets. He prefers to look at the total marketcap excluding BTC.
He describes the history of Trololo logarithmic regression line in this video. Please consider thanking him through donation to the address in the description of this video.
4. Trololo line for BTC is available on TradingView as two free indicators.
5. You can draw your own Trololo chart if you want to put the time and effort.
The original formula as posted by Trolololo is here. Obviously, different formulas are needed for BCH and for total marketcap. Also, the formula needs constant updates, as more price historical data points are added.

How Can I Use Trololo Trend Line In My Investment Strategy?
Your investment strategy will depend on your goals and your level of risk tolerance.
If you, like me, is convinced that Bitcoin (BCH) is the best form of money for the world, you can take comfort in seeing that the fair value for BCH and for the total coin market cap is predicted to continue to go up. You can ignore the periods of over- and under-valuations and continue to exchange your fiat money to BCH at regular intervals (dollar cost averaging). Even though the growth rate is slowing down, it continues to be parabolic and spectacular.
Better yet, in the context of a trading strategy, the Trololo chart can be used as a market timing indicator for overbought and oversold extremes. You can sell your crypto investments when the market is extended to the upside (overbought), and buy back when it is approaching oversold. This way you "lock-in" profits on the top, and buy back lower.
Just be careful not to sell prematurely. As you can see from the charts, the market tends to extend to the upside longer and higher than many expect. Let those profits run.


Also, please don't overtrade. Please resist the temptation to time every market move. You may have regretted not selling in early May, and buying back on May 19th at a huge discount. But no one could have predicted the downturn and its depth.
These trades might make you a few percentage points here and there, but one time the market might turn suddenly in the other direction and you might miss a big move up, and you may end up having to buy less coins at a higher price.
Marc's videos and google sheets files are the resources I recommend for the trading strategy.
What Does The Trololo Chart Tell Us About the Current Bitcoin BCH Valuation?

According to Marc De Mesel (on April 16, 2021):
"Bitcoin BCH still has lots of catching up to do to reach its Trololo Trendline / Fair Value that still stands 10x higher around 120B / 5k BCH, and would go to 1T or 50k per BCH if it goes also 800% vs its trendline, not a probable scenario but certainly a possible scenario given the law of reversion to the mean, the higher it undershoots the mean, the higher it will overshoot too.".
Let us look at the numbers again. As of April 16, 2021, BCH is trading at $800 (market cap of $15 Billion) while the Trololo trend line indicates a fair valuation of BCH marketcap at around $120 Billion, or a market price for BCH of >$5000. This is evident also in the spread oscillator, where the current value is around 12 percent of the fair value.
Please note that the Trololo line as updated by Marc is constantly changing as new data points are added. This is especially evident in Bitcoin BCH where it has been undervalued for a long time and is "pulling" the trend line downwards.
However, Bitcoin BCH is predicted to catch up, and probably overshoot to the upside as Marc says, because of the strong fundamentals (better technology and utility) and because of the statistical tendency for "reversion to the mean" - not financial advice!
I hope this article was helpful in introducing the concepts around Trololo trend line, and its practical uses.
My sincere thanks to Trolololo for the original outstanding work, and to Marc for popularizing the idea, updating the charts, and sharing his thoughts in his videos and updates.
Thank you for reading. Feedback is very welcome. - Omar
Further Reading:
1 . Colin Talks Crypto Bitcoin Bull Run Index (CBBI): a very nice new index by @ColinTalksCrypto - iPhone and android apps of the CBBI index are available.
Please consider donating to the CBBI team to support this great work.
2. WHEN to SELL!! Colin Talks Crypto Bitcoin Bull Run Index - a video explanation of the CBBI index.
3. Bitcoin’s Logarithmic Growth Rates, Facebook’s S-curve, and Future Projections by Awe & Wonder
4. Introducing The Bitcoin “MVRV Z” Metric That Predicts Market Tops with 90%+ Accuracy by Awe & Wonder

Very Nice and informative read. Loaded with tons of information with reference of hyperlinks at every inch to reconcile the quoted facts.