Exactly one year has passed since my prediction based on the graphical pattern of the Shooting star.
In December 2020 I was writing this:
From the opening price of December, Bitcoin increased its price of more than 50% to the current ATH, in the 29.000$ area.
The bulls are calling 50.000$ but as said before, the triumphal march is unlikely to last forever.
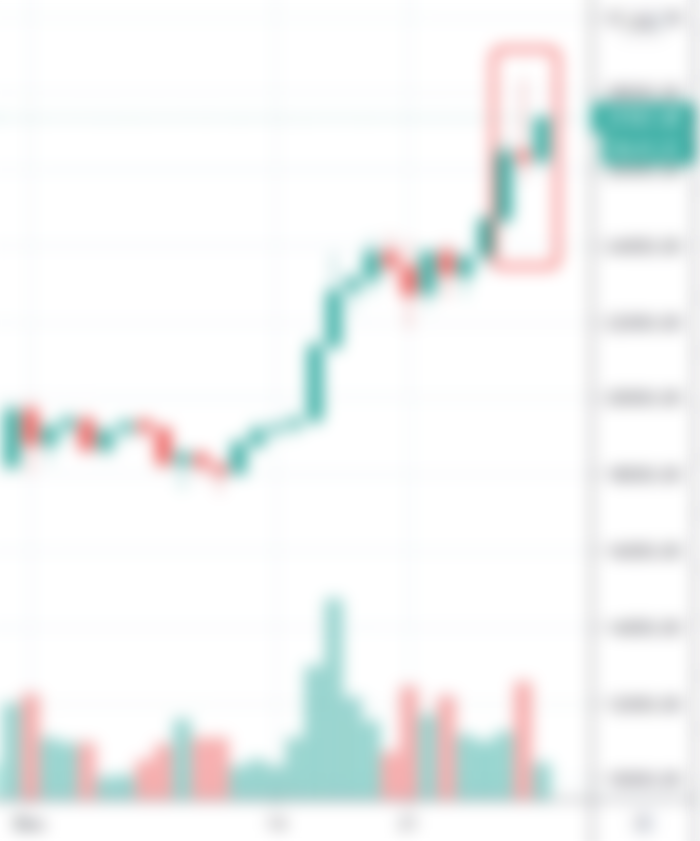
On the 27th we have seen first signals of retrace and an important pattern showed out, called Shooting Star.
What is this pattern and what is its significance?
In the red rectangle you can see the red Japanese Candle. That is a Shooting Star.
A shooting star is a pattern very close to a doji candle, but with an upper shadow far more extended than the lower one.
This can mean only one thing. In the area above 28.000$ there is lot of offer that absorbed the first trial of overcoming that level.
Am I saying that 28k $ level is not going to fail? Actually no. I expect Bitcoin to grow more and more in price, perceived value and adoption.
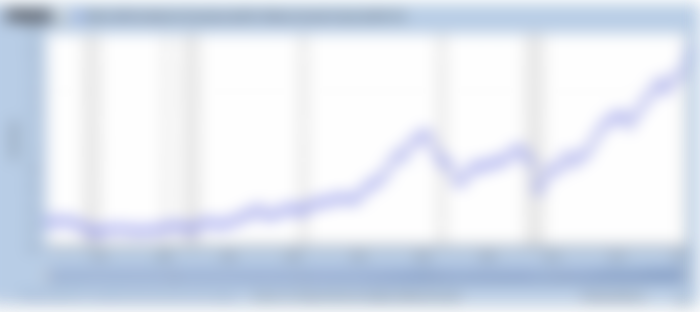
Anyway, the Warren Buffet indicator says that the US market may be 200% overvalued.
How does he calculate this parameter?
“The Buffett indicator is calculated by dividing the total value of all stocks in the US market, by the gross domestic product of the US. Traders typically use the Wilshire 5000 Total Market Index as a measure of this.”
All the grey areas from the graphic are the Recession areas, and if you look closely, every Recession area has a downtrend movement: it could be already ongoing or eventually happened during that period.
We are in a strong bullish market. And Tether are continuously printed.
When can we expect the next bubble blow up? When the SEC will make some decise light on the Tether scenario. Next deadline for documents submission from Bitfinex holding towards SEC is meant to be on 15th January 2021.
I can bet that around those days some corridor voices will come out and the cryptocurrency market will start to look more similar to Nazarè (Portugal) during the World Surf Championship.
And the SEC keep printing.
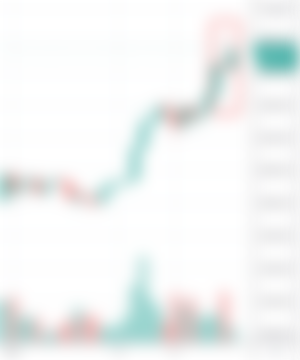
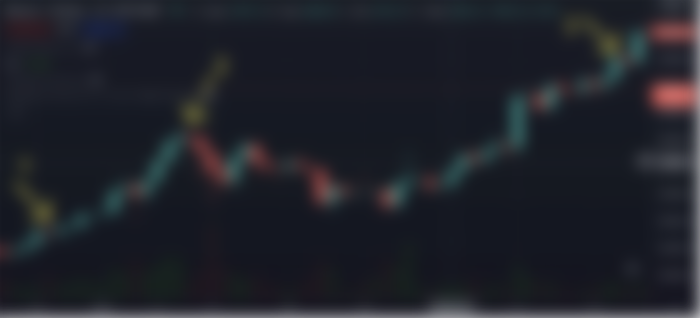
Let's take a closer look at what happened.
The chart below shows the bullish run of BTC in the first months of 2021
In the arrow 1 the Shooting star, in the arrow 2 the first high and in the arrow 3 the retracement towards the ceiling of $50000.
Leaving aside the 50000$ target that materialized at the end of February 2021, we can say that the chart pattern was reliable as the first high of 40000$ was obtained in about 12 days.
The predictions were right, but of course, as I clearly wrote just above, the pattern alone did not give me confirmation of how the market would go.
"WARNING: this writing is the work of my considerations regarding the study of the charts, and is absolutely not a call for any kind of investment on cryptocurrencies.