Bitcoin Cash Analysis; Crypto To The Moon Series; #58.
DISCLAIMER: I am not a financial advisor nor certified analyst. All contents discussed on this blogpost are solely my own personal views and for Trading education/entertainment purposes only . Do your own research and due diligence.
With that being said, let's dive straight into it;
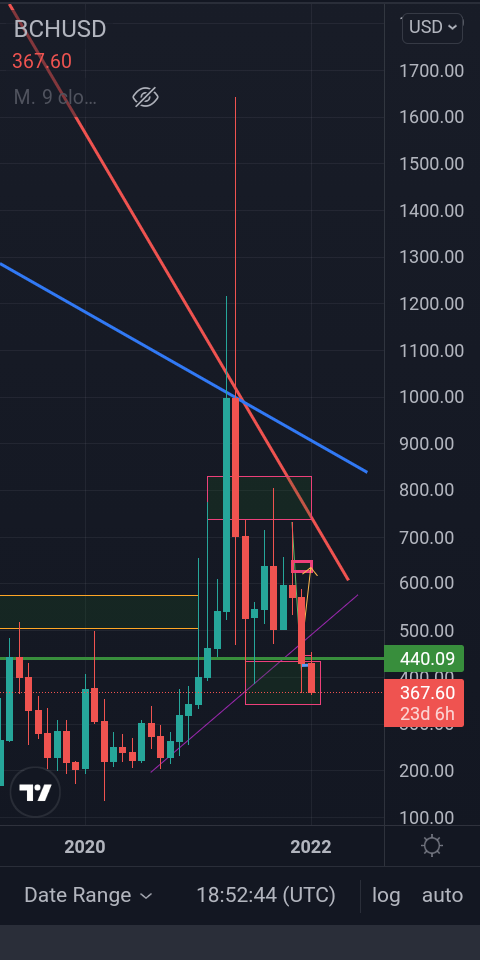
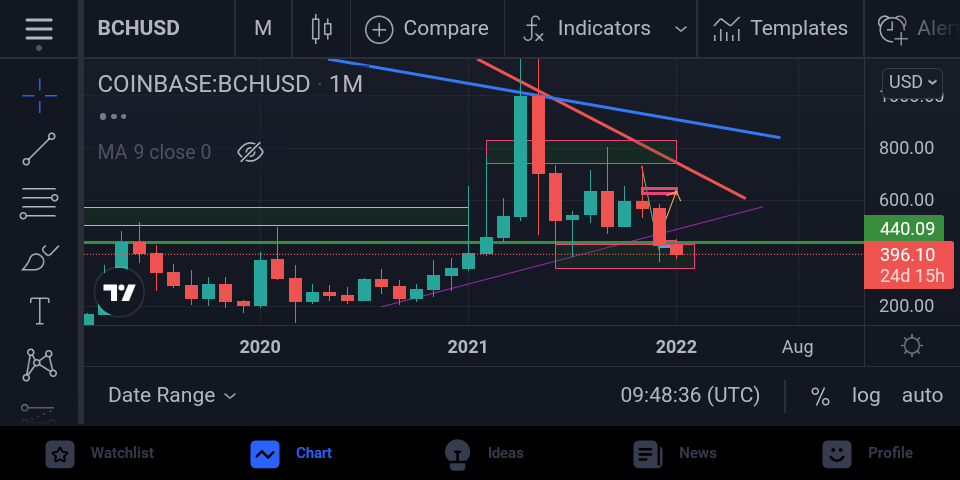
BCH Analysis Using Weekly Timeframe.
Good day folks, hope you're all having a great weekend. We can all agree that I've been away for quite some time now, just being busy lately, but I'll surely make time for you guys.
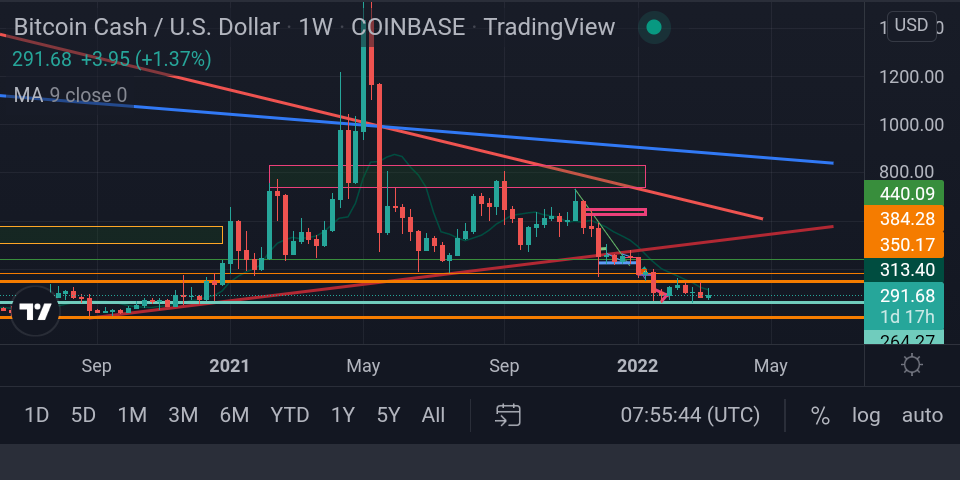
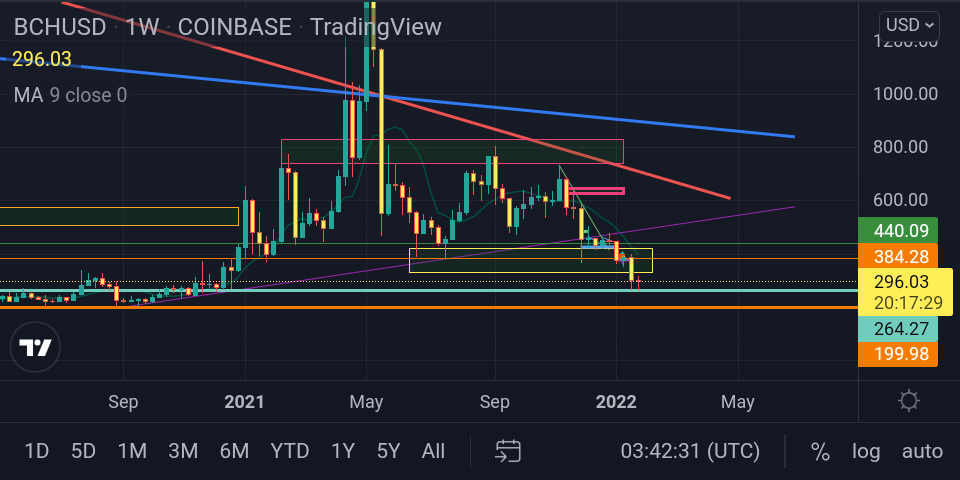
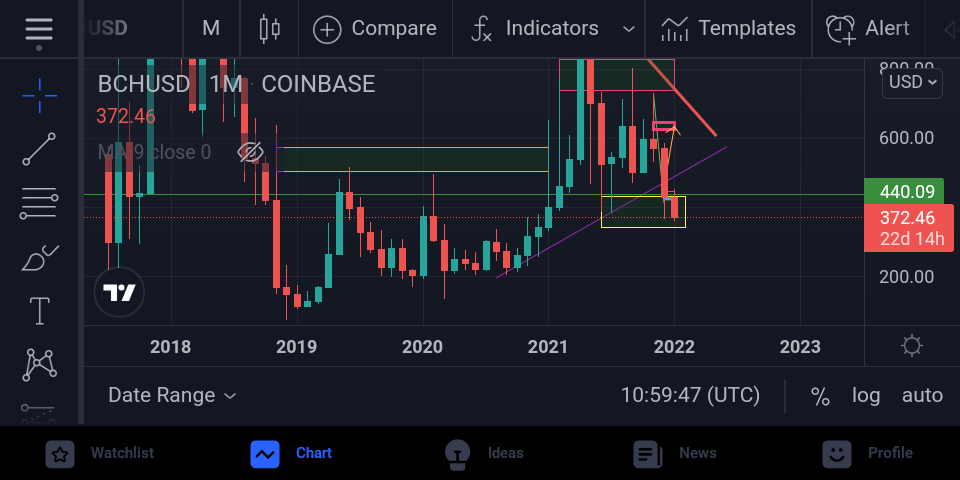
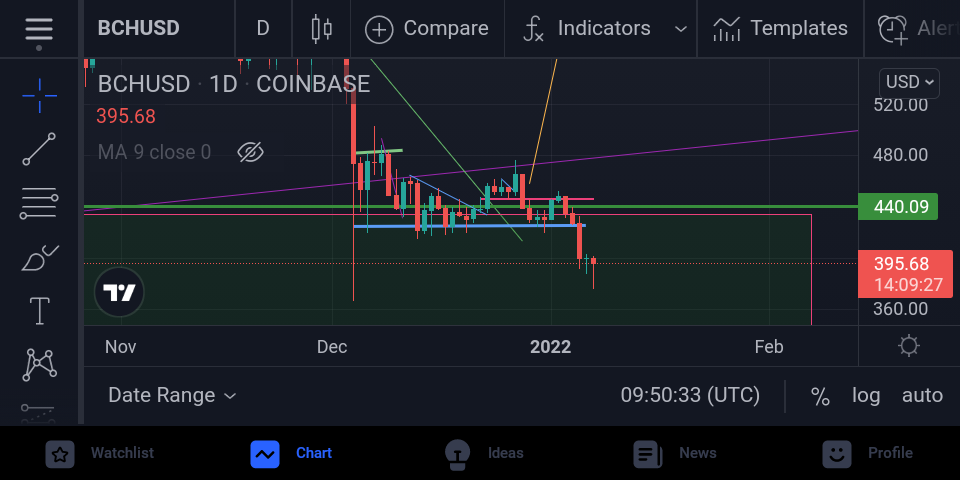
Back on the Analysis, On using the 1 week timeframe, we still seem to be moving in a ranging pattern as we're still moving in between two formed trend lines. In simple terms, we're at this point of time neither increasing nor decreasing in price, although there's a little support zone not too far from where we are now in case we're going bearish. ****Together we move.👍***
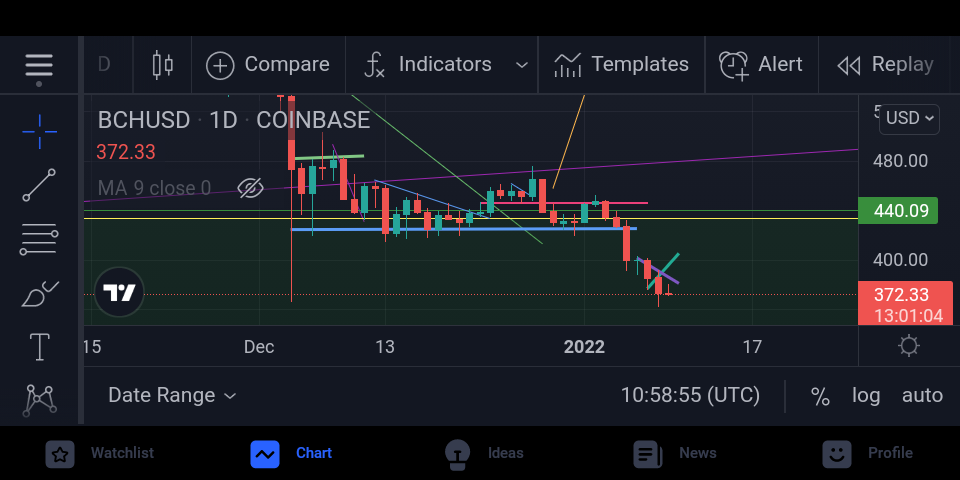
BCH 2 Hour Time frame.
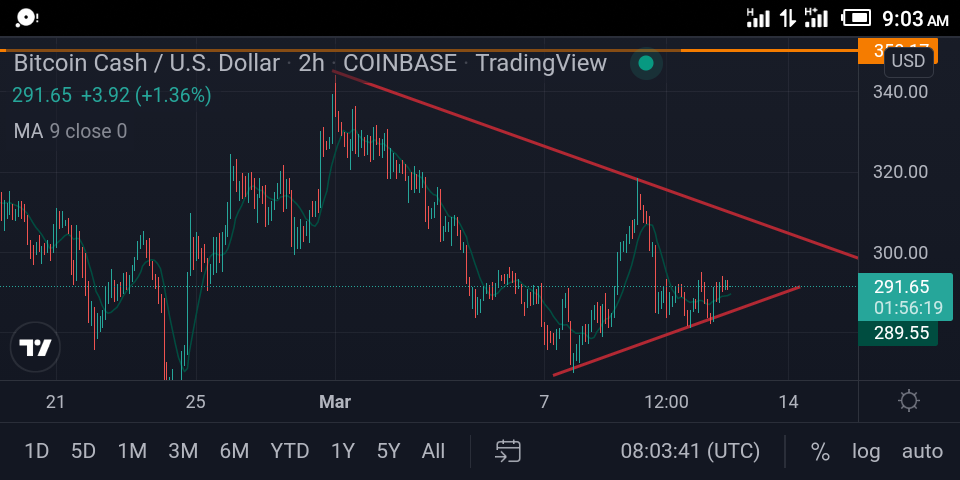
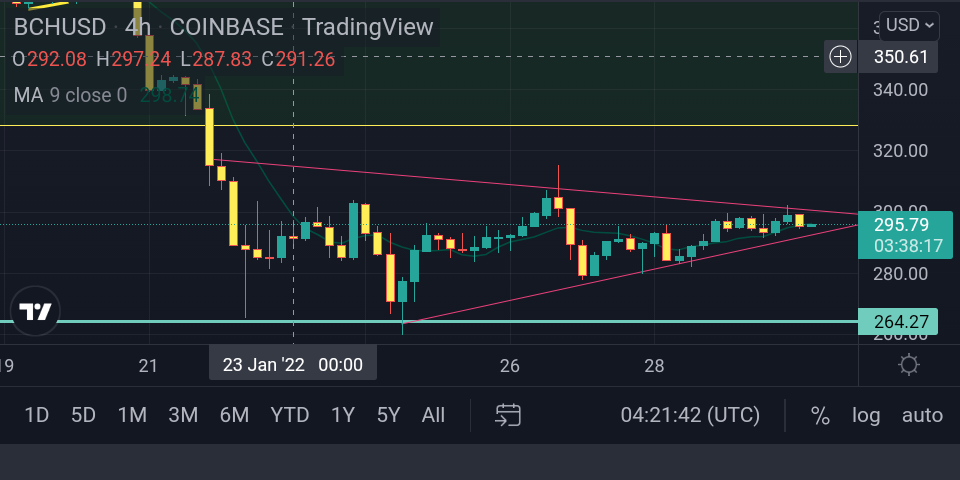
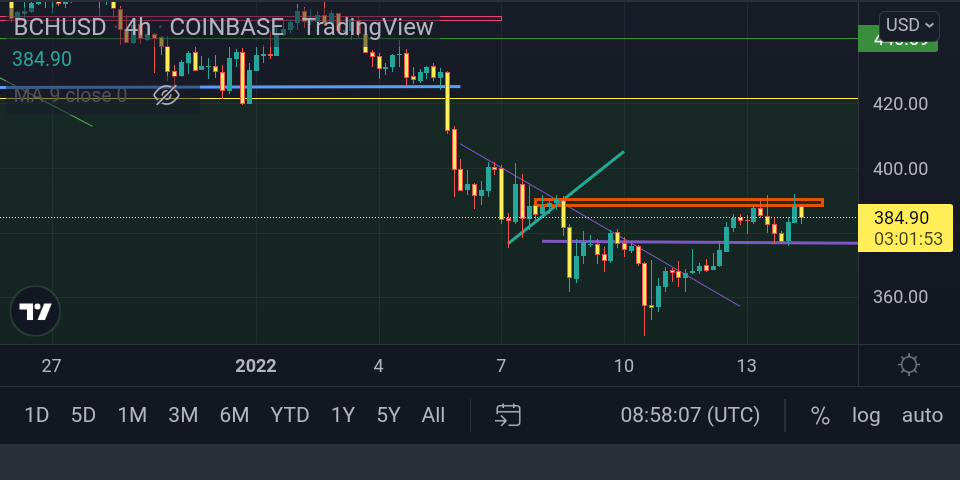
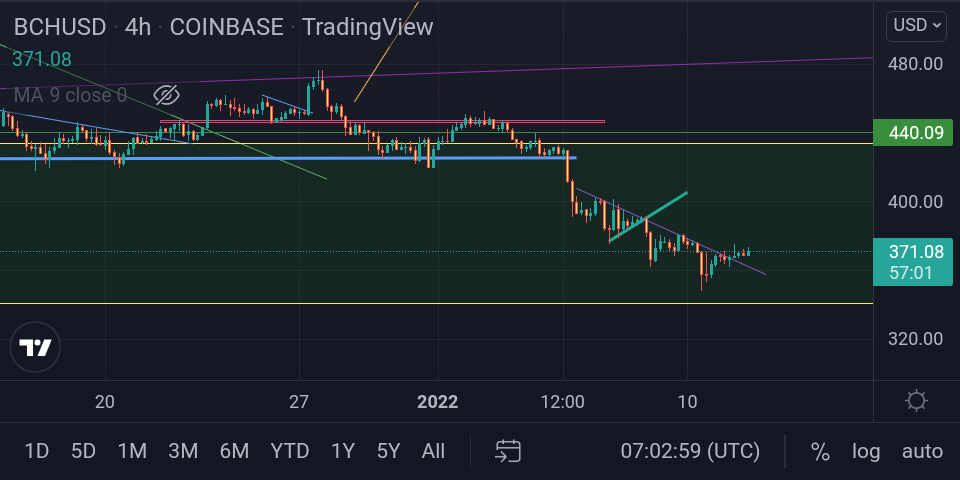
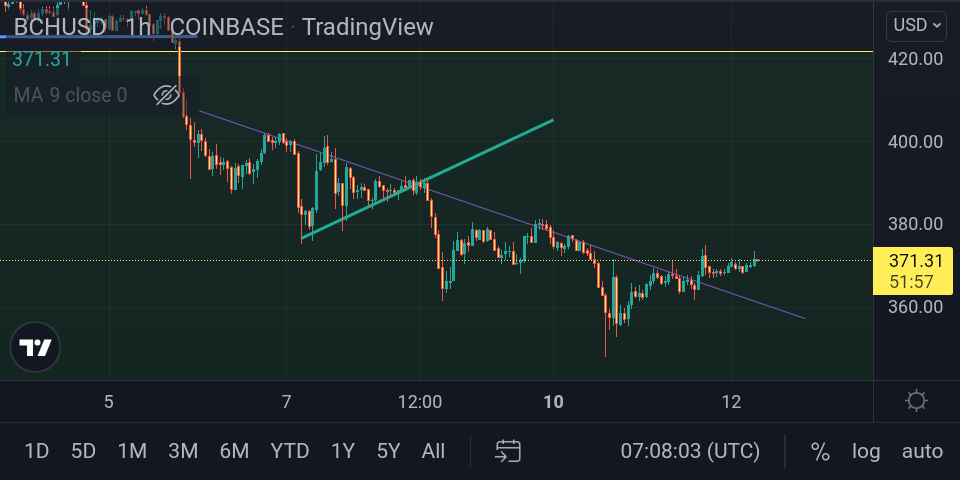
On the other hand using the 2H time frame, we're left with a figure that seems to be a symmetrical triangle.
Upon encountering this pattern we usually expect the pattern to be fully formed to it's tip before before we start expecting a breakout either Bullish (increase in price) or Bearish (decrease in price).
But anyways this is the crypto space and is almost unpredictable as different things influence the market and we could expect a breakout anytime soon hopefully on a bullish path.
Have a great day:)
**Until Next Time, Peace.**
BCH Analysis, Crypto To The Moon Series #57.
DISCLAIMER: I am not a financial advisor nor certified analyst. All contents discussed on this blogpost are solely my own personal views and for Trading education/entertainment purposes only . Do your own research and due diligence.
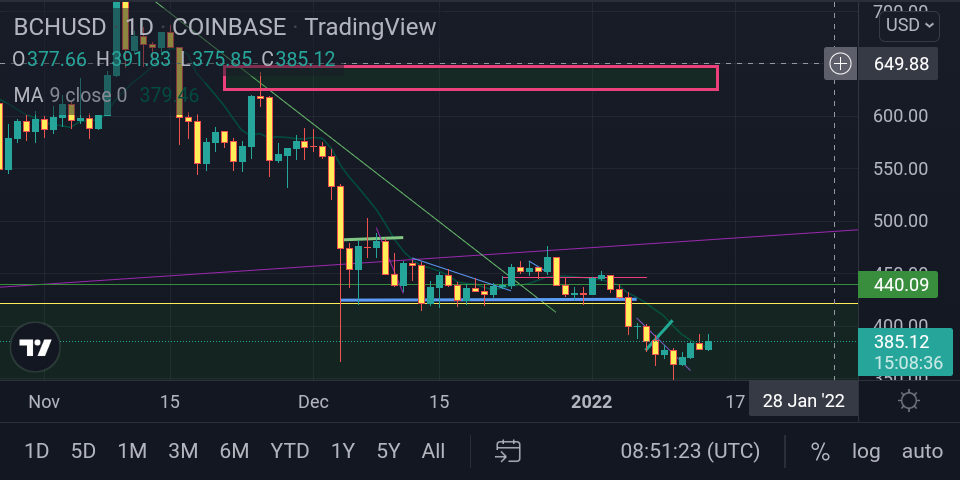
From the price analysis, we'll definitely admit to the fact that the Price of BCH has faced quite a real bearish state for sometime now as we continue to decrease in price as days pass by
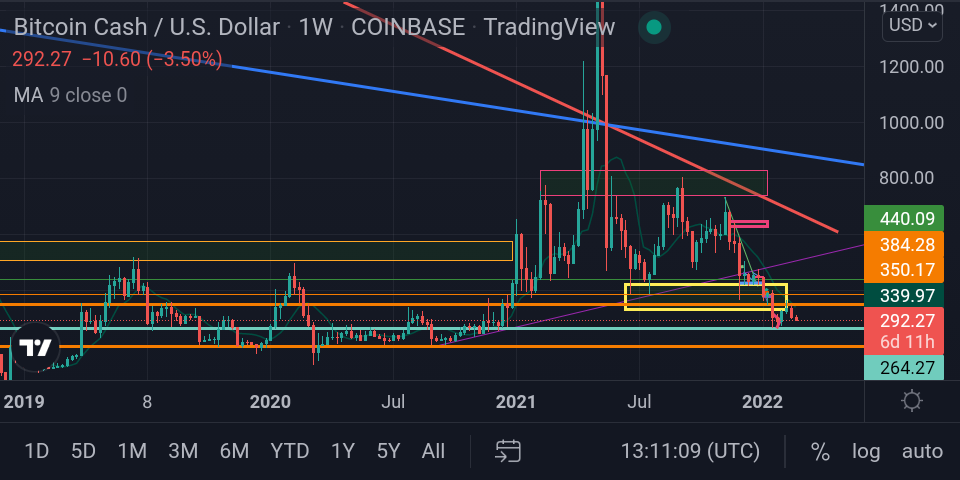
In a brief analysis, we'll get to see if there's a possible reverse or turning point for us to increase in price or go bullish. On the 1 week Timeframe,we can spot the fall in price as we drastically dropped from being recently priced more than $600 to now being priced at about $292.
Though it seems to be as though we retested on a support zone which made us increase in price a little bit, we soon retested the nearby resistance zone which made us continue a gradual fall in price.
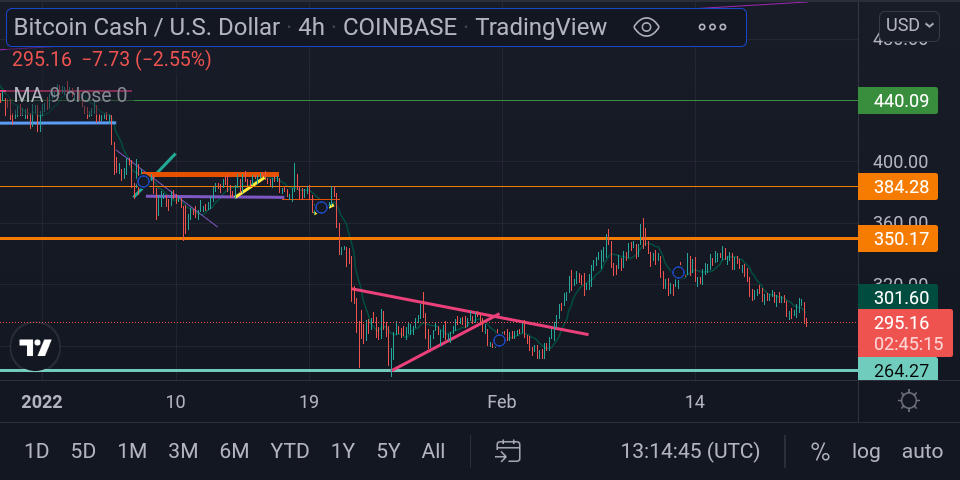
As we increased in price from being priced $264 on the low brightly coloured trend line to the increased price at about $350 which is at a resistance zone, we eventually had to go bearish as we are now priced $295 as if making this analysis.
I presume the fact that we could certainly reach for $264 yet again before going bullish or increasing in price.
During these moments, it's expected of us to buy even more as we could either hold for a short or long term and sell off when the price is slowly recovering.
`Have a nice day mates!`.
**Until next time, Peace.**
Axie Infinity (AXS) Analysis, Crypto To The Moon Series #56.
DISCLAIMER: I am not a financial advisor nor certified analyst. All contents discussed on this blogpost are solely my own personal views and for Trading education/entertainment purposes only . Do your own research and due diligence.
WHAT'S AXIE INFINITY?
Axie Infinity on the Ethereum Blockchain is a trading and battling game that allows players to collect, breed, raise, battle, and trade creatures known as "Axies" (characters based on axolotl), which are digitized as NFTs. As of September 2021, the majority of players were based in the Philippines. For a Long period of time now, Axie infinity has acted as a source of income for many people especially in the South East Asia in countries like Philippines and Vietnamese.
New players need to purchase at least three axies to begin playing. In February 2020, Sky Mavis estimated that the average player had spent around US$400 to match this starting requirement. By December 2021, the starting cost for three axies was up to US$1,000.
As of October 2021, a single AXS will have been easily priced US$164 as it approached it's All Time High Price which followed by an intense fall in price as it falls as low as from been priced $164 to been priced lower than $51.
But as for now, there could be an expected possible increase as we approach a new possible turning point reaching a support zone.
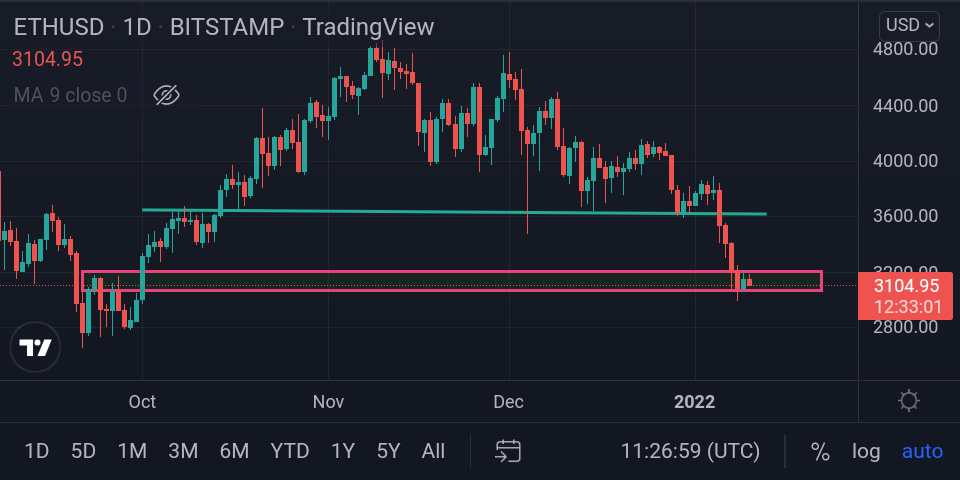
After using the 1 Day Timeframe, I eventually noticed that there has been multiple times on which we retraced on bounced on that pink support zone. Now, this could actually be either really good as we use this opportunity to go bullish (increase in price) or if the market is not on our side, there could just be a break out and we fall even much further.
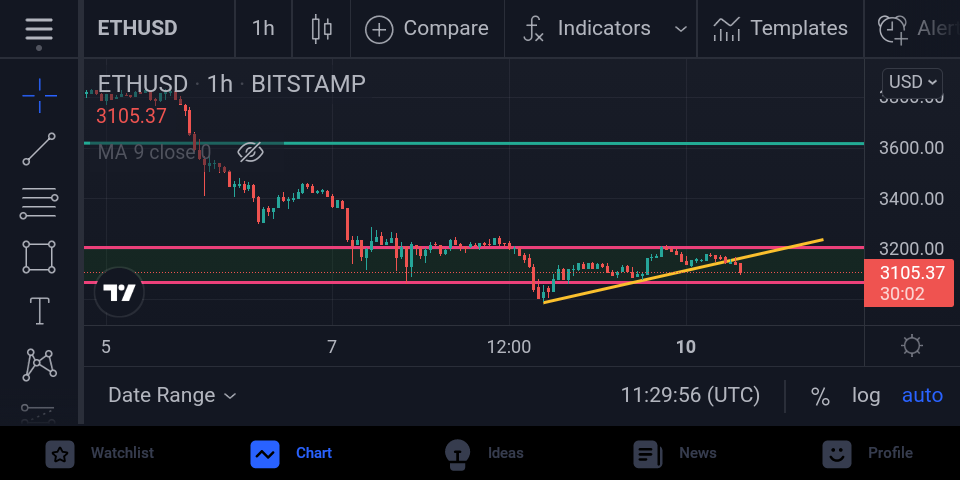
Further, on using the 4h Timeframe, it becomes even more evident that the price coul fall a little bit more until it eventually reaches the pink support zone.
But on either increasing or decreasing in price, I'll say I'm on it increasing this time due to the multiple retest.
**Until Next Time, Peace.**
https://read.cash/@InvestorOmar/bitcoin-analysis-free-trade-analysis-crypto-to-the-moon-53-2bfe5e03
https://read.cash/@InvestorOmar/bitcoin-analysis-crypto-to-the-moon-50-ad8f5523
Bitcoin Analysis; Crypto To The Moon Series #55.
DISCLAIMER: I am not a financial advisor nor certified analyst. All contents discussed on this blogpost are solely my own personal views and for Trading education/entertainment purposes only . Do your own research and due diligence.
With that being said, let's get it into it;
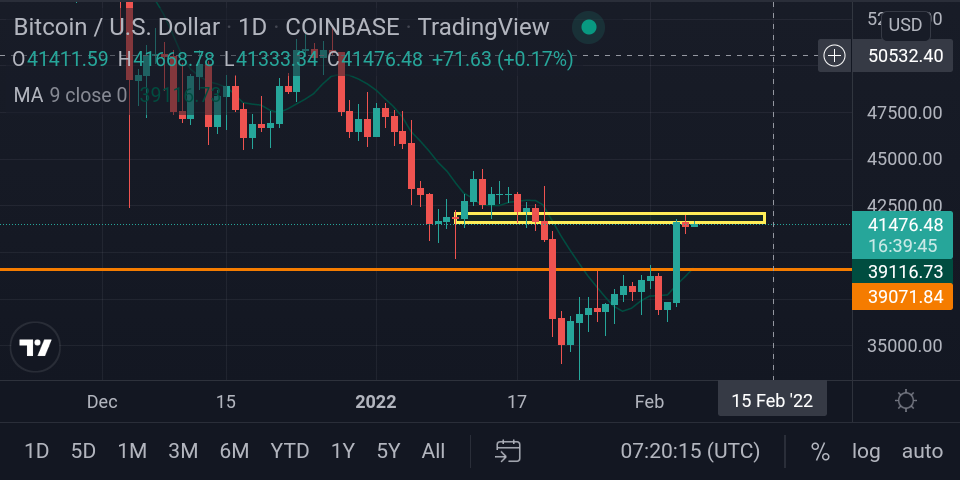
BTC 1D Timeframe.
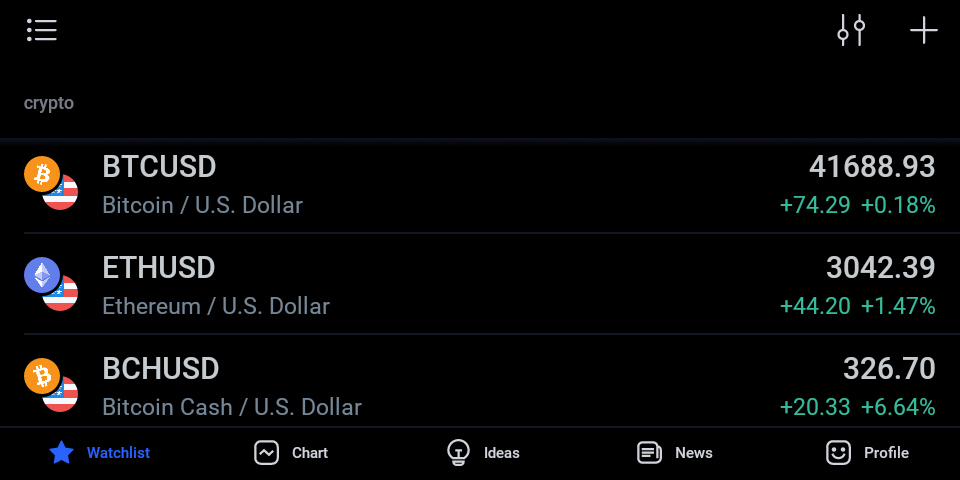
With BTC priced at about $41,476 we've been bullish those previous days no doubt. There was a fine bullish candlestick that was formed lately which took us to were we are presently.
After a breakout from the resistance zone, I think we might just be on our way to some bearish movements for some time again. As long as we're on the crypto market, it's normal to expect some bearish movements overtime no matter how bullish it has been.
After some increase in price on BTC, I think it's time for some bearish movements after we've approached the resistance zone.
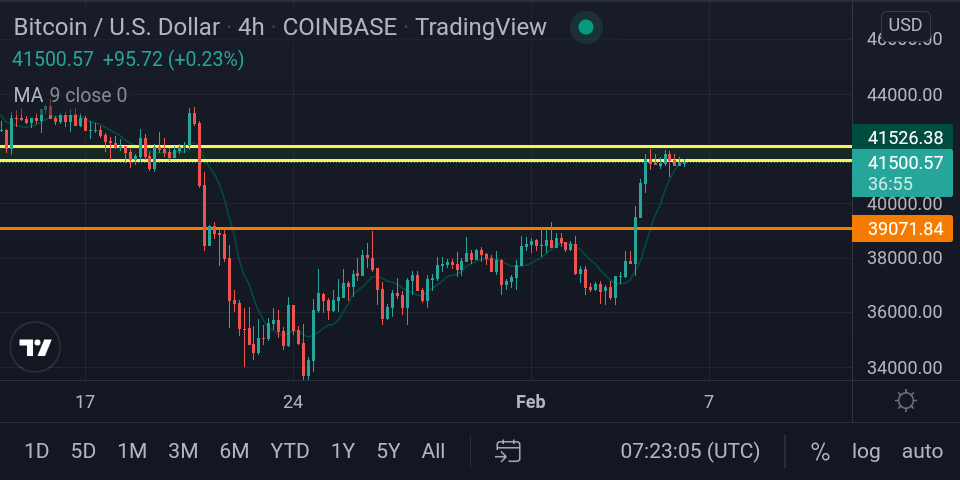
BTC 4H Timeframe
Whereas on using the 4h timeframe, we can still find a reason to say that BTC might just be going bearish due to the fact that the moving average is also about to be crossed to a bearish path.
The retest should go down to as much as $39,071 as it heads towards the support zone.
BCH 1H Timeframe
On using out the 1h Timeframe, we get even more assured of the next movement on BTC to translating into a bearish movement for some time.
We can clearly see that the BTC candlesticks have literally come to an end in the formed triangular structure in which the next breakout can be the path we move towards be it bearish or bullish.
Overall: BTC might just go on a bearish movement for some time before going bullish again.
`Previous articles:`
https://read.cash/@InvestorOmar/bitcoin-analysis-free-trade-analysis-crypto-to-the-moon-53-2bfe5e03
https://read.cash/@InvestorOmar/bitcoin-analysis-crypto-to-the-moon-50-ad8f5523
https://read.cash/@InvestorOmar/bch-analysis-free-trade-analysis-crypto-to-the-moon-series-54-8160f17b
`Until Next Time, Peace.`
Bch Analysis; Free Trade Analysis; #Crypto To The Moon Series #54.
DISCLAIMER: I am not a financial advisor nor certified analyst. All contents discussed on this blogpost are solely my own personal views and for Trading education/entertainment purposes only . Do your own research and due diligence.
Without further delay, let's get into it;
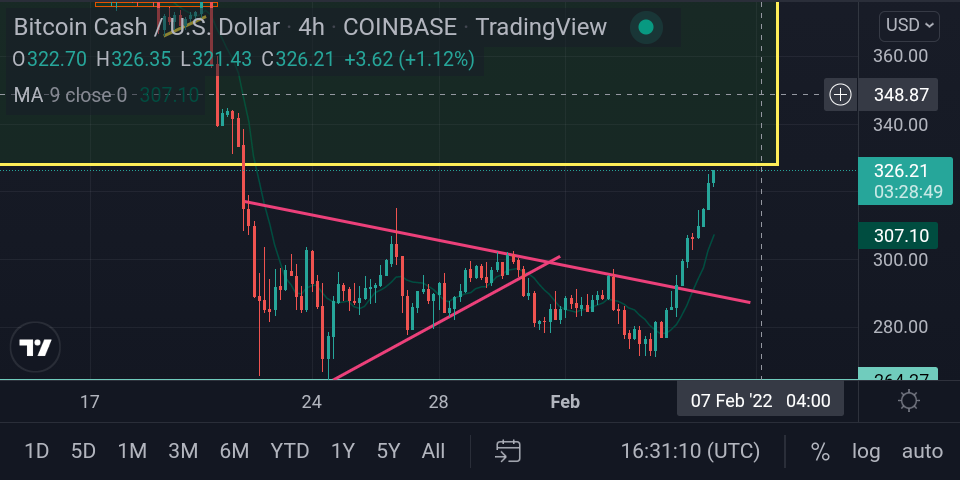
Bch 4H Timeframe.
Today's Market is surely a Green one. Finally, Our crypto portfolios are finally rising from the bearish movements we experienced not so long ago. Could this hopefully be the start of a new bearish movement? Like I always say, time would tell!
Bch has finally started going bullish (rising) after some bearish (decreased) movements for some time now. While we were still down or low in price, the bullish movement was still quite predictable as we got closer to crossing above the trend line everyday.
From being priced at about $280, were currently at $326 after the breakout. As for now, we are still bullish as we head towards a resistance zone.
Bch 1D Timeframe
On the other hand, while we are certainly bullish on Bch, we can easily spot a possible reverse zone on the 1D timeframe which is at about $360.
If any reverse is to occur at all at that point, I personally think it shouldn't be that drastic or deep as we've experienced recently hopefully. As for now, Markets are still as Green as Grasses.
`Until Next Time, Peace.`
Bitcoin Analysis; Free Trade Analysis; Crypto To The Moon #53.
DISCLAIMER: I am not a financial advisor nor certified analyst. All contents discussed on this blogpost are solely my own personal views and for Trading education/entertainment purposes only . Do your own research and due diligence.
Without further delay, let's get into it;
BTC 4h Timeframe
You might have all noticed, that BTC has increased in price those previous days that have went by. That nice feeling of finally seeing your portfolio increasing.
Anyways, there are nevertheless still chances of the price of BTC dropping again unfortunately. After some retest on a key level, we finally got some increase in price.
During this process, we have also retested a resistance zone multiple times as we experience a little drop in price each time we retested on the resistance zone.
As of the time of making this analysis, we're still at the upper level after successfully reaching for the resistance zone and we already started the formation of a red or bearish candlestick.
BTC 1w Timeframe
Using the 1w timeframe to get a broader look, there's definitely a bullish candlestick formed as we retest on the support zone.
And after the formed bullish candlestick, we can also see a new bullish candle stick being formed, Hopefully it gets us to an even more bullish movement.
But just above the formed bullish candlestick is the resistance zone. A retest can make us bearish again.
**Until Next Time, Peace.**
Bitcoin Cash Free Trade Analysis; Crypto To The Moon #52
DISCLAIMER: I am not a financial advisor nor certified analyst. All contents discussed on this blogpost are solely my own personal views and for Trading education/entertainment purposes only . Do your own research and due diligence.
With that being said, let's get into it;
BCH 4h Timeframe
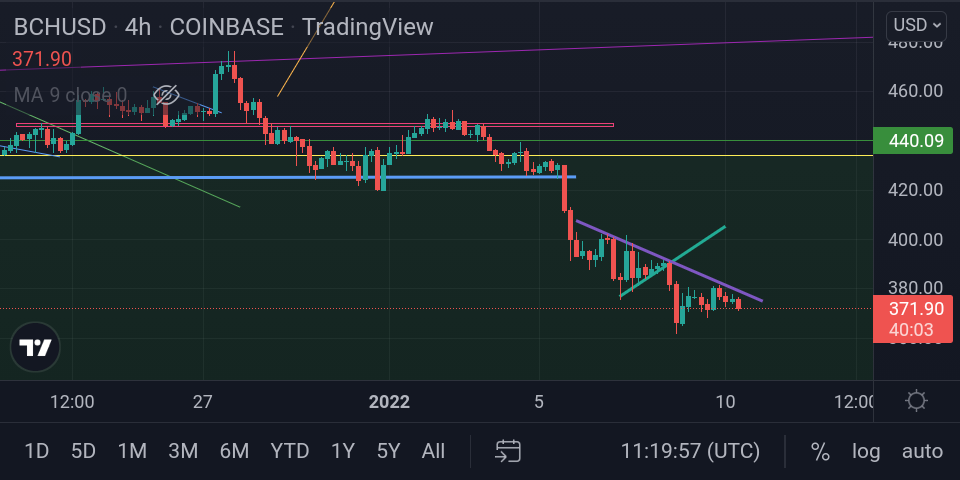
From my last Analysis on BCH, we've been experiencing some retest both on the support and resistance zone which led to the gradual formation of a symmetrical triangle.
As time goes by, we slowly but steadily got to the end of this symmetrical triangle formed and was finally time for us to either go bearish or bullish by either breaking out from the top or bottom part.
From the chart, you can easily spot the path we followed as we went bearish after breaking out from the lower part of the symmetrical triangle.
Hopefully if there should be more bearish movements, we'll not be going down too far as the support zone isn't that far from where we are right now.
BCH 1w Timeframe
Using the 1w timeframe, there hasn't been much progressions as it is we move in a quiet slow paste here on 1w timeframe.
But currently, what we can make analysis on is the fact that there has been multiple retest on the support zone.
`Could this be a sign that we're about to go bullish or are we going to eventually end up bearish heading towards the second support zone? Only time will tell.`
**Until Next Time, Peace.**
Bitcoin Cash Analysis; Crypto To The Moon #51.
DISCLAIMER: I am not a financial advisor nor certified analyst. All contents discussed on this blogpost are solely my own personal views and for Trading education/entertainment purposes only . Do your own research and due diligence.
With that being said, let's get into it;
1 Week Timeframe
Bch being priced $296.03 as of making this analysis has yet again undergone some bearish movements. The price of Bch dropped to being priced at about $264.27 at one point.
After a double retest on the support zone, could this finally be the turning point for Bch to going Bullish? If there's any bearish movements again, I'm sure we'll be landing on the lowest support zone I've marked so far which is priced as low as about $199.
4 Hour Timeframe
Using the 4h timeframe, we're able to see that a breakout is about to occur as this could send the price movements either bearish or bullish in no time.
A break out on the lower part of the formed structure, there'll be higher chances of going bearish again and heading towards a support zone.
`Until Next Time, Peace.`
Bitcoin Analysis; Crypto To The Moon #50.
DISCLAIMER: I am not a financial advisor nor certified analyst. All contents discussed on this blogpost are solely my own personal views and for Trading education/entertainment purposes only . Do your own research and due diligence.
With That Being said, let's get into it;
1 Week Timeframe.
Using the 1w timeframe, just as I stated the last time that the Price of BTC is definitely likely to fall even further before experiencing some bullish movements, we eventually did drop even further.
During these moments, it's not a wise thing to panic sell, not at all. We recently did make it to the support area which can help us in going bullish, but expecting some little bearish movements might still possible for a short time though.
During these bearish moments, it's definitely a good idea to buy the dip as prices are expected to rise in no time.
Overall: Market Still Red and Bearish but not for long hopefully as we make a retest towards the support zone.
`Until next time, Peace.`

Binance Coin Analysis; Crypto To The Moon #49.
DISCLAIMER: I am not a financial advisor nor certified analyst. All contents discussed on this blogpost are solely my own personal views and for Trading education/entertainment purposes only . Do your own research and due diligence.
With That being said let's get into it;
1 Week Timeframe.
Now as of making this analysis, BNB is currently priced at about $345.7231 as it solemnly base on a trend line acting as a support zone a of now.
A possible retest on this trend line will definitely make us bullish, but what chances are there?
If we're to break this trend line and head downwards, I'll suggest that the lowest area's that we can base on are the areas around $234.6963 as there's a support zone in that area.
Not only does that area mark a support zone or area, but there has also been multiple occasions where price dropped to that area but eventually increased in price in a relatively short amount of time.
**Swap your crypto anytime for free without account registration** https://sideshift.ai/a/Omar
`Until Next Time, Peace`


Shiba Inu analysis; Crypto To The Moon #48.
DISCLAIMER: I am not a financial advisor nor certified analyst. All contents discussed on this blogpost are solely my own personal views and for Trading education/entertainment purposes only . Do your own research and due diligence.
With that being said, let's get into it;
Shiba Inu has also been greatly affected by the bearish state of the crypto market as we drastically dropped in Price.
Previously after retesting on one of the trend lines, we got bullish as we surpassed $0.00003000 but not for so long as we eventually reached a resistance zone or area.
Upon reaching the resistance zone, it starts to go bearish slowly. Finally approaching a new support zone, we started to go on a zigzag like pattern for sometime, then retesting the resistance zone for the last time.
After that final retest, we immediately started going on a bearish streak, further breaking the second support zone and going bearish further as we're currently priced at about $0.00001864 after making this analysis.
**Swap your crypto anytime for free without account registration** https://sideshift.ai/a/Omar
`Until Next Time, Peace.`


Bitcoin Cash Analysis; Crypto To The Moon #47.
DISCLAIMER: I am not a financial advisor nor certified analyst. All contents discussed on this blogpost are solely my own personal views and for Trading education/entertainment purposes only . Do your own research and due diligence.
With that being said, let's get into it;
1 Month Timeframe.
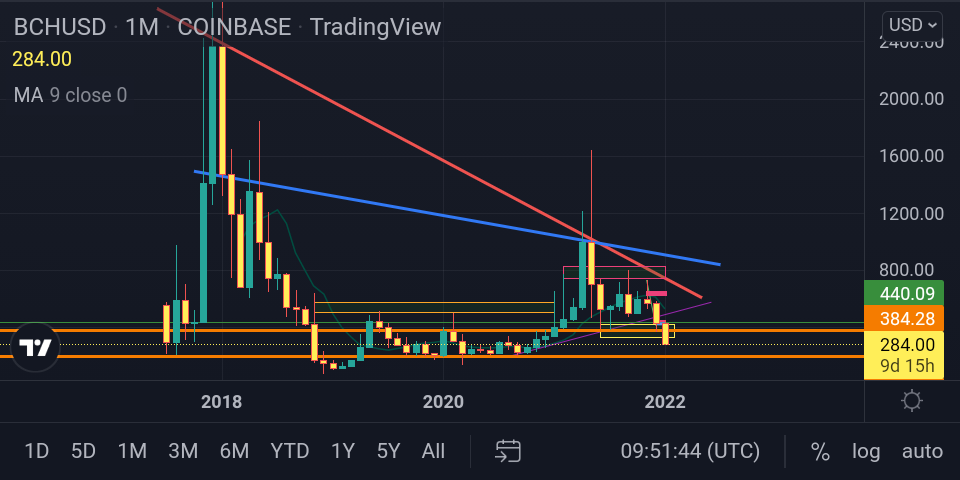
The current crypto market status is 'RED'
Using the one month timeframe, I easily spotted that we will eventually go beariish after there was a breakout on a major trend line towards a bearish path, and here we are.
Ever since we experienced the breakout, we've been on a bearish streak since then. Not only did we break out from the first support zone and went bearish, but we did break yet again another support zone as we went even more bearish.
The price we're at presently ($284) is quite surprising though. But what can we say, crypto is volatile.
Something to note down is that the next support zone we are heading towards is about $200. We're not that far from reaching there at this point of time. Hopefully we start a strong bullish movement after reaching that point.
**Swap your crypto anytime for free without account registration** https://sideshift.ai/a/Omar
`Until Next Time, Peace.`

Bitcoin Analysis; Crypto To The Moon #46
DISCLAIMER: I am not a financial advisor nor certified analyst. All contents discussed on this blogpost are solely my own personal views and for Trading education/entertainment purposes only . Do your own research and due diligence.
With that being said, let's get into it;
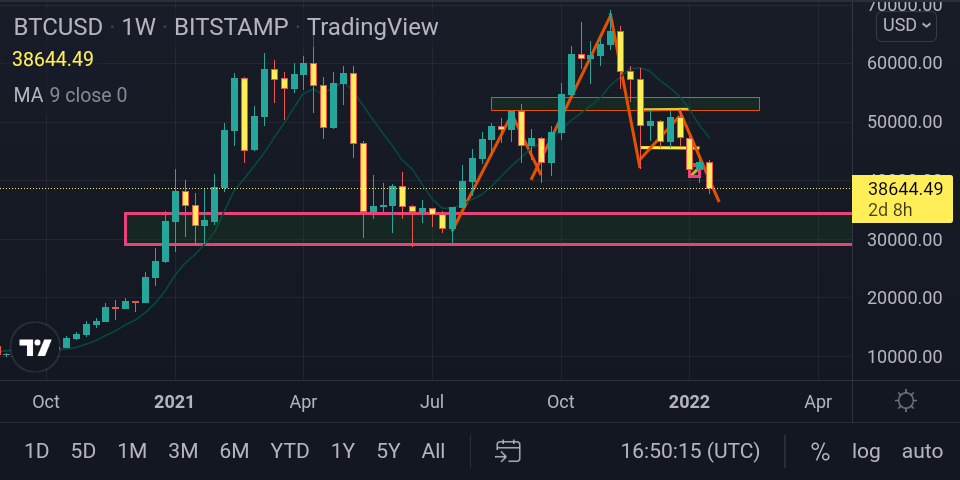
1 Week Timeframe.
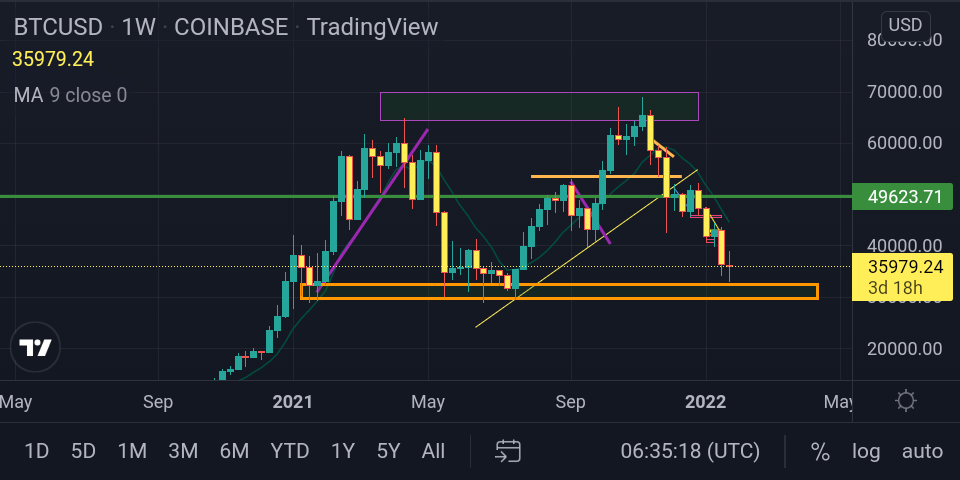
Just as I've stated before, there were all chances of the price of BTC going further down as it is now.
Using the 1w Timeframe, we can easily see BTC forming a head and shoulders formation.
During this formation, there was a resistance after some bullish movement which made us retest and go bearish for sometime.
After undergoing this bearish movement, we found ourselves going bullish to the extent that we got to a new highest price which exceeded $60000 respectively.
Going on with the formation, we then eventually went bearish as we found ourselves priced below $50000. Retesting on the now formed support zone, we finally got some bullish movements
Nothing much, which eventually landed us at our new resistance zone. At this point, most people started to think that we're finally over with the bearish movements. But unfortunately, that's not it.
Once on the resistance zone, we went bearish yet again. This is the point we're we are today. I'll say there are still all chances of going even more bearish, but not for so long, as we head towards the support zone.
**Swap your crypto anytime for free without account registration** https://sideshift.ai/a/Omar
`Until Next Time, Peace.`

Ethereum Update; Crypto To The Moon #45.
DISCLAIMER: I am not a financial advisor nor certified analyst. All contents discussed on this blogpost are solely my own personal views and for Trading education/entertainment purposes only . Do your own research and due diligence.
With that being said, let's get into it;
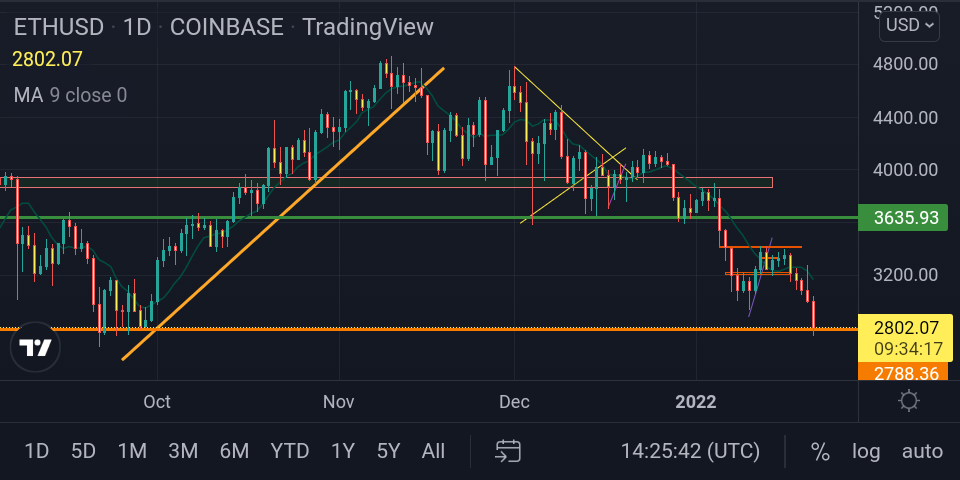
Using The 1Day timeframe,we can easily get to analyze what's happening on the ethereum chart.
After respecting the green coloured key level which acted both as a support and resistance zone on multiple occasions, we finally got to break through heading towards a major resistance zone.
On reaching the resistance zone at first, we got to experience some bullish movement which leads us to a new resistance level.
As usual, since there was no break through, we then happened to retest the resistance zone and go bearish as we are now based on a support zone, ready for a bullish movement if we eventually don't end up breaking the support zone.
`We're currently priced $2802.07 as of making this analysis.`
***Swap your crypto anytime for free without account registration*** https://sideshift.ai/a/Omar
`Until Next Time, Peace.`

Bitcoin Cash Analysis, Crypto To The Moon #44.
DISCLAIMER: I am not a financial advisor nor certified analyst. All contents discussed on this blogpost are solely my own personal views and for Trading education/entertainment purposes only . Do your own research and due diligence.
With That being said, let's get into it.
1 Hour Timeframe.
Using the 1h timeframe,we get to see a really clear view as to what's happening in the chart.
Starting our analysis with the previous trend line which was respected as a support zone multiple and several times.
But eventually, we broke the trend line acting as a support zone further going down and forming a new support zone. Though the trend line acting as a support zone was still respected but this time as a resistance zone.
There's currently a strong break out thankfully which leads to a bullish movement. We're currently based on a resistance zone after going on a bullish movement.
Being based on the resistance zone, we can either expect to go further up or eventually bounce a little back to the nearest support zone.
Swap your crypto anytime for free without account registration https://sideshift.ai/a/Omar
`Until next time, Peace.`


Bitcoin Analysis, Crypto To The Moon #43
DISCLAIMER: I am not a financial advisor nor certified analyst. All contents discussed on this blogpost are solely my own personal views and for Trading education/entertainment purposes only . Do your own research and due diligence.
With that being said, let's get into it;
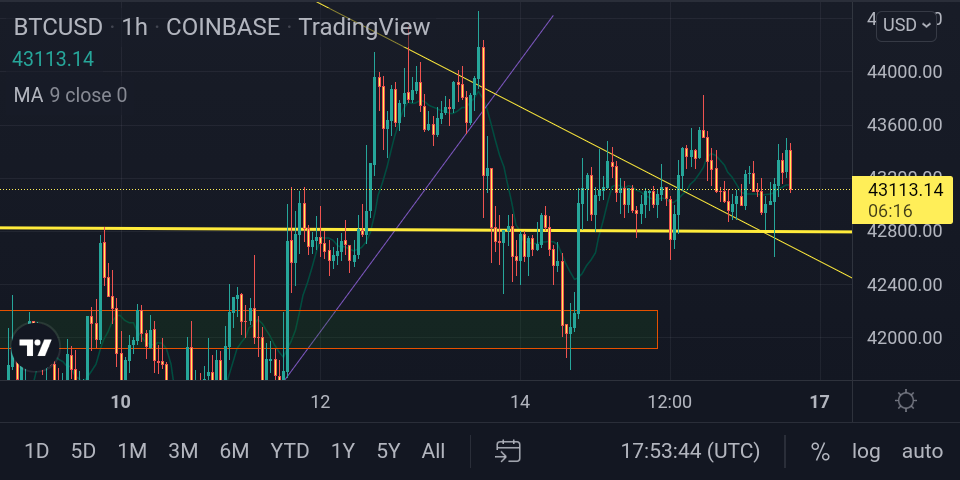
1 Hour Timeframe.
From where we stopped last time, My analysis has been followed and respected crucially by the candlesticks on BTC chart.
After a retest on the thin yellow trend line,we made our way even more closer to existing the symmetrical triangle. As I've said before, the point of break out determines it being bearish or bullish. Fortunately, we were bullish on our point of breakout.
After the break out,we eventually retested a resistance zone and made our way respecting the former thin yellow trend line which acted as a resistance zone back then, but this time, it played out as a support zone as it made us increase in price and go bullish.
We're currently at a point were we retraced this time 2 trend lines both the thick and thin yellow trendlines which both acted as a support zone as we went bullish reaching for a resistance zone.
It seems to be as though we recently retested a resistance zone and might go bearish for a short term hopefully.
****A Big Shout Out To My Sponsors****
**@foryoubtc09** **✔️** https://read.cash/@foryoubtc09
**@Omar.A** **✔️** https://read.cash/@Omar.A
`Until next time, Peace.`

I just wanted to say Thanks Big Time To my sponsors:
@foryoubtc09 💜
@Omar.A💜
Thanks For Your Support.
Bitcoin Cash Analysis; Crypto To The Moon #42
DISCLAIMER: I am not a financial advisor nor certified analyst. All contents discussed on this blogpost are solely my own personal views and for Trading education/entertainment purposes only . Do your own research and due diligence.
With that being said, let's get into it;
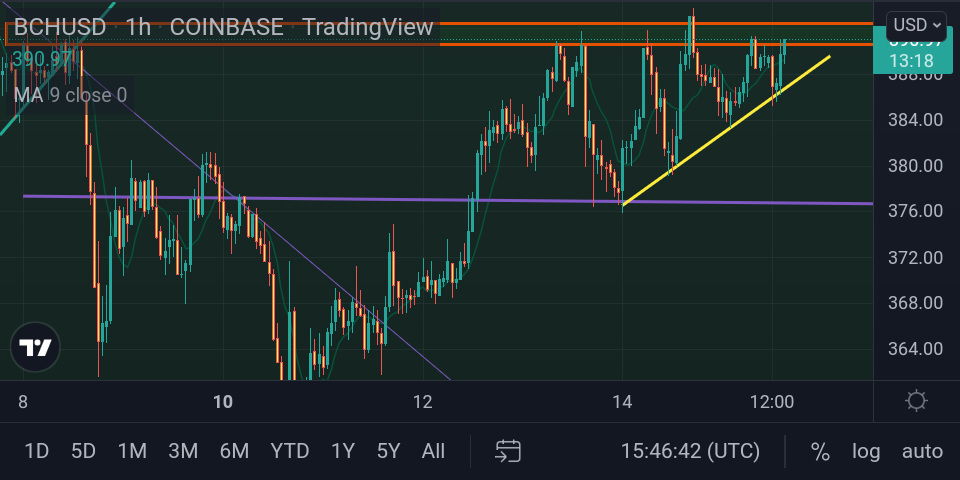
1 Hour Timeframe.
We can really see the increase in price taking place on the 1h timeframe as we're on a steady increase.
After retesting a major key level multiple times, we finally got to cross or breakout of the key level in a bullish path as we landed on the nearest resistance zone.
We've currently formed a structure resembling that of a symmetrical triangle and that too came to an end of the triangle. So what happens next is quite important in what happens on the price movement of BCH.
There has been multiple retest on the trend line as we make it to the resistance zone.
We're expecting Either;
A continuous bullish movement, as we break the trend line acting as a resistance zone.
The resistance zone has much effect on us and after a retest on it, we go bullish for some time.
`We all hope it's the first one though:)`
Swap your crypto anytime for free without account registration https://sideshift.ai/a/Omar
`Until Next Time, Peace.`

Ethereum Analysis; Crypto To The Moon #41.
DISCLAIMER: I am not a financial advisor nor certified analyst. All contents discussed on this blogpost are solely my own personal views and for Trading education/entertainment purposes only . Do your own research and due diligence.
With that being said, let's get into it;
4 Hour Timeframe.
Today we're going to be basing our analysis on the 4h timeframe for our analysis. Something to take note of is that there are some similarities on the price movement of these top Alt coins and the price movement of BTC.
On the Ethereum chart, there has been some retest or respect as on a major key level which acted as a resistance zone in the initial beginning.
But after a break out from the top part of this key level following a retest on it, it acted as a support level which lead to a bullish movement until we eventually reached the next resistance zone.
During this movements, we were gradually following up a trend line, which we broke after multiple retest on the top resistance zone which then translated to a bearish movement.
We're currently retesting on a resistance zone, which might lead to a bearish movement but not for so long hopefully, since the nearest support zone is not that far off.
Swap your crypto anytime for free without account registration https://sideshift.ai/a/Omar
`Until Next Time, Peace`


Bitcoin Analysis; Crypto To The Moon #40.
DISCLAIMER: I am not a financial advisor nor certified analyst. All contents discussed on this blogpost are solely my own personal views and for Trading education/entertainment purposes only . Do your own research and due diligence.
With that being said, let's get into it;
4 Hour Timeframe.
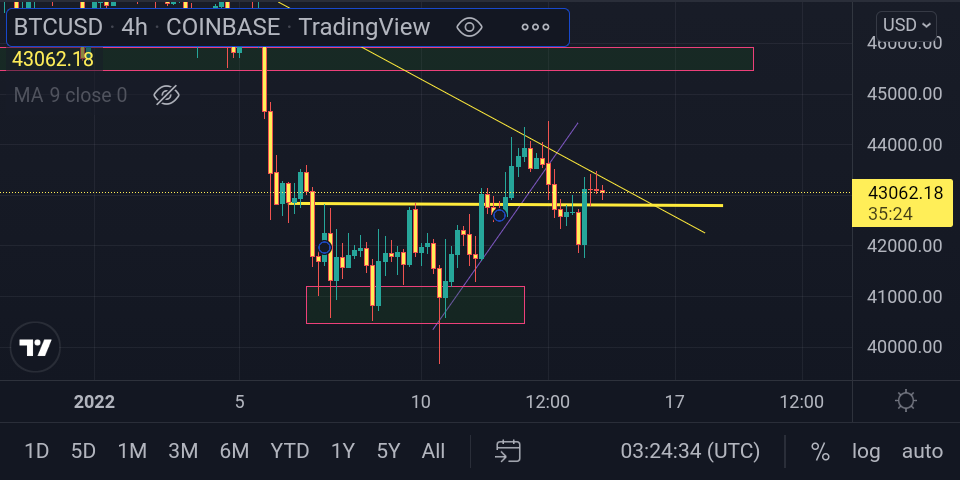
Starting up with the 4h timeframe, we currently seem to have retested on a trend line which has been respected some couple of times now.
Not only did we retested, but we also we seem to have been respecting a major key level all this while on the 4h timeframe (*The thick yellow trend line).
The key level has acted both as support and resistance zone but at this point of time, it might just be acting as a support which might support a bullish movement.
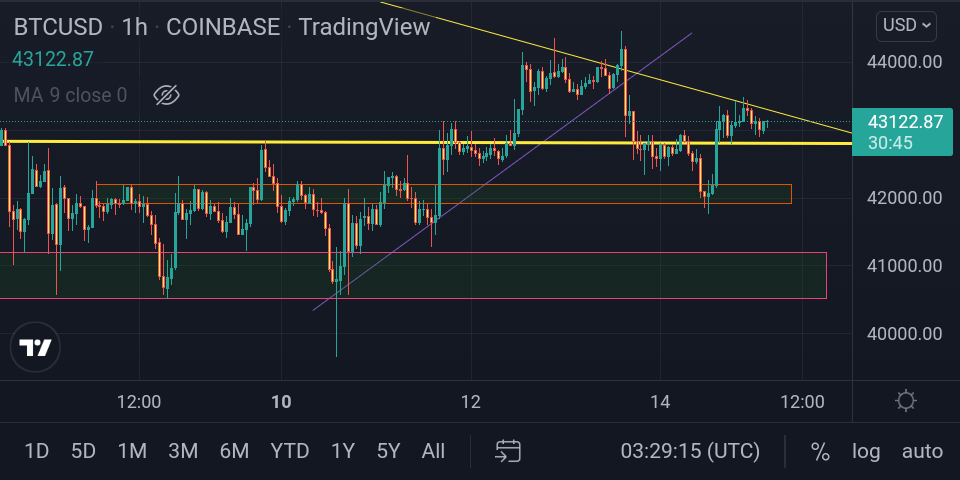
1 Hour Timeframe.
Meanwhile, on the 1h timeframe, there was a recent breakout of a trend line (*purple thin trendline) which made us drop experiencing some bearish movements for some time just before we retested on a key level which acted as a support zone or area.
Where we currently are at, we retesting on that major key level can certainly relate to a bullish movement. But a break out will eventually be leading to otherwise a bearish movement.
Swap your crypto anytime for free without account registration https://sideshift.ai/a/Omar
`Until next time, Peace.`
Bitcoin cash Analysis; Crypto To The Moon #39.
DISCLAIMER: I am not a financial advisor nor certified analyst. All contents discussed on this blogpost are solely my own personal views and for Trading education/entertainment purposes only . Do your own research and due diligence.
With that being said, let's get into it;
1 Day Timeframe.
Starting with the 1 day timeframe, We're currently recovering bit by bit after experience some bearish movements for quite some time time now.
Hopefully it continues in this way and pattern till we fully recover and reach for the nearest support zone.
4 Hour Timeframe.
Using the 4h timeframe to get a closer and detailed look at the chart, It seems to be as though we're following and respecting a trend line as we progress and move upwards reaching a resistance zone.
We recently a crossed over a resistance zone which now acts as a support zone as we bounce on it and further made a retest landing on the resistance zone.
Once on the resistance zone, we're either going further up by breaking the resistance zone we are currently on.
Failure to do so, we might just go bearish for sometime reaching for the nearest support zone which is not that far from where we are.
Swap your crypto anytime for free without account registration https://sideshift.ai/a/Omar
`Until Next Time, Peace.`
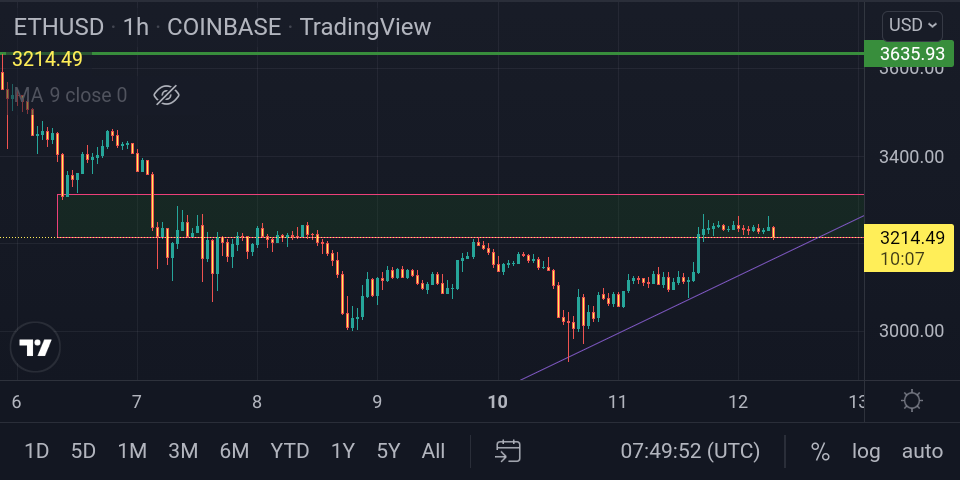
Ethereum Analysis; Crypto To The Moon #38.
DISCLAIMER: I am not a financial advisor nor certified analyst. All contents discussed on this blogpost are solely my own personal views and for Trading education/entertainment purposes only . Do your own research and due diligence.
With that being said, let's get into it;
1 Hour Timeframe.
Ethereum has had bullish movement and further more increased from about $3000 to now about $3214.49 as of making this analysis.
Though it has been following up a trend line and moving up gradually, it seems to be that it still respects a resistance key level.
We're currently still just above the trend line as we proceed to retest the trend line below.
`what could be the possible outcome`
We successfully retest on the trend line and move even further up above the current resistance zone
Chances are we'll just breakout of the trend line and go bearish looking for the nearest support zone
Swap your crypto anytime for free without account registration https://sideshift.ai/a/Omar
`Until next time, peace.`

Bitcoin cash Analysis; Crypto To The Moon #37.
DISCLAIMER: I am not a financial advisor nor certified analyst. All contents discussed on this blogpost are solely my own personal views and for Trading education/entertainment purposes only . Do your own research and due diligence.
With that being said, let's get into it;
4 Hour Timeframe.
Using the 4h Timeframe, taking off from were we stopped last time.We were previously under the purple trend line as we had retested it several times three times to be precise before finally undergoing a breakout.
Now, a breakout could either be a good or a bad sign, depending on the part it occurred be it up or down. But as we can clearly see in the analysis, it's fortunately from the top side as this provides more hope for a bullish start.
1 Hour Timeframe.
Using the 1h Timeframe as usual gives us an even more closer view and detailed information on what's happening on the BCH charts.
We get to see a very detailed and and beautiful retests as we went bearish. After the break out, there are still chances of us still going bearish as we head towards a support zone.
Swap your crypto anytime for free without account registration https://sideshift.ai/a/Omar
`Until next time, peace.`
Bitcoin Analysis; Crypto To The Moon #36.
DISCLAIMER: I am not a financial advisor nor certified analyst. All contents discussed on this blogpost are solely my own personal views and for Trading education/entertainment purposes only . Do your own research and due diligence.
With that being said, let's get into it;
1 Month Timeframe.
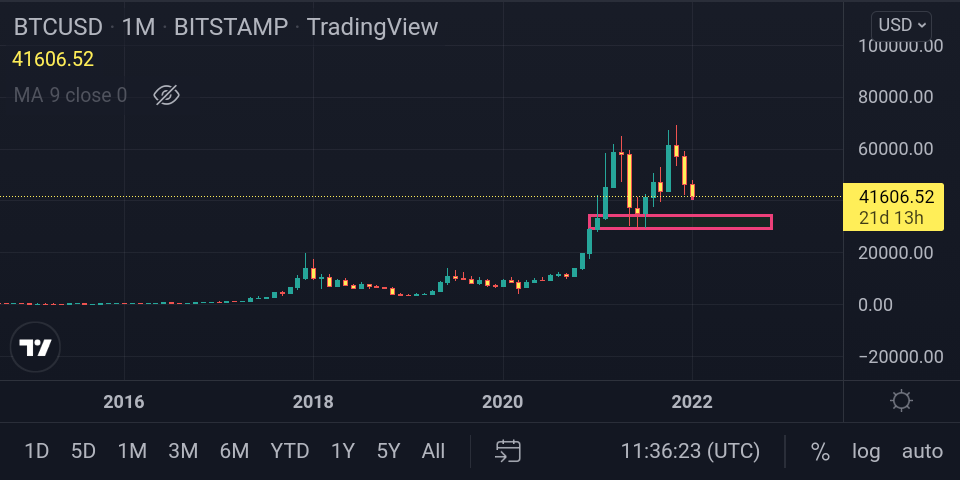
Bitcoin's price has drastically reduced during these past months as we're now priced at about $41606.52 as it clearly shows in the chart. How come of such a big bearish movement? Hopefully, some investors we're able to see this coming.
As all Know, since the falling in price of BTC, all other Alt coins have also been in bearish state for quite some time now.
Some experts have also said that there's all possible hope of this precious crypto to fall even further!
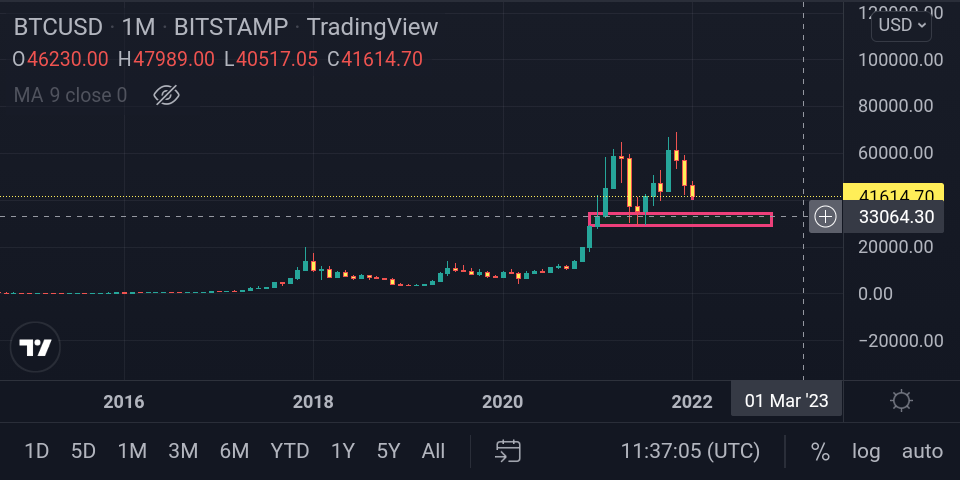
we might find ourselves priced $33064.30 yet again as that price ($33064.30) area mark's a support zone or area as we head towards it.
I also find it totally possible at a point that Bitcoin can actually fall further to being priced at about $33064.30 respectively. And it shouldn't be new to us, as we were previously priced just about $33064.30 or even lower in the year 2021.
***Swap your crypto anytime for free without account registration*** https://sideshift.ai/a/Omar
`Until next time, peace`
Bitcoin Cash Analysis; Crypto To The Moon #35.
DISCLAIMER: I am not a financial advisor nor certified analyst. All contents discussed on this blogpost are solely my own personal views and for Trading education/entertainment purposes only . Do your own research and due diligence.
With that being said, let's get into it;
4 Hours Timeframe.
Using the 4 hours Timeframe, If you can remember clearly on my last analysis on BCH, I mentioned something about not being surprised if BCH goes even further downwards or bearish.
Unfortunately as of making this analysis, using the 4 hours timeframe, the condition for us to go on a bearish movement for a short time hopefully has been met, as we retest on the purple resistance zone and make our way down.
Could this bearish movements be as a result of Bitcoin's bearish movement? What do you think?....
Swap your crypto anytime for free without account registration https://sideshift.ai/a/Omar
`Until next time, peace`
Ethereum Analysis; Crypto To The Moon #34.
DISCLAIMER: I am not a financial advisor nor certified analyst. All contents discussed on this blogpost are solely my own personal views and for Trading education/entertainment purposes only . Do your own research and due diligence.
with that being said, let's get into it;
1 Day Timeframe.
Starting the analysis On the 1 Day Timeframe chart on Ethereum, there was a previous breakout from a major support zone as we head downwards looking for the nearest support zone to balance ourselves for the meantime.
After the first breakout, we were able to find a new support zone as we're based there as of making this analysis.
1 Hour Timeframe.
There's currently high chance of going even further downwards or bearish as you may call it, and this became clear to me after making this analysis.
The major cause or reason for the bearish movement we're about to undergo is the fact that there's a breakout on another trend line but this time on the 1 hour Timeframe as the candlesticks head even more downwards.
But let's hope this won't be going too far as we're on the 1 hour timeframe.
Swap your crypto anytime for free without account registration https://sideshift.ai/a/Omar
`Until next time, peace.`
Bitcoin Cash Analysis #33; Crypto To The Moon.
DISCLAIMER: I am not a financial advisor nor certified analyst. All contents discussed on this blogpost are solely my own personal views and for Trading education/entertainment purposes only . Do your own research and due diligence.
With that being said, let's get into it;
1 Month Timeframe.
Using the 1 month Timeframe,the present candlestick has just rwtwsti on the major key level. As a matter of fact, this might just be indicating a strong bearish movement, as we're currently down at about $372.13 as of writing this article.
........
1 Day Timeframe.
In the 1Day timeframe, we broke out of what seems to be a symmetrical triangle but yet again at a bearish point as we go down even further.
Don't be surprised that we'll rest the resistance zone and go even more further down. But hopefully not as it might act as a support zone towards a bearish part.
......
4 Hours Timeframe.
Using the 4 hours timeframe, we simply elaborate on what's happening on the 1 Day timeframe as we get to see the symmetrical triangle even more clearly.
We also have a clear sight on the break out in the bearish point. But we're currently trying to move up towards the nearest line which might act as a support or resistance zone.
I repeat, don't be surprised if we're faced with a resistance zone as we go down further, but hopefully not.
After the movement of BTC a lot of altcoins have sold off and are now in an excellent position to pump! The resistance on these coins is lower than it has been in a long time meaning they can be pumped higher than ever including BCH.
`Overall: BCH still at a bearish movement for quite some time now. Hopefully we're already at the turning point!`
**Swap your crypto anytime for free without account registration** https://sideshift.ai/a/Omar
`Until next time, peace.`
Bitcoin Cash Analysis #32; Crypto To The Moon.
DISCLAIMER: I am not a financial advisor nor certified analyst. All contents discussed on this blogpost are solely my own personal views and for Trading education/entertainment purposes only . Do your own research and due diligence.
With that being said, let's get into it;
**The crypto market is currently generally down as BTC and other famous Alt Coins like Eth,Bch... are all in a bearish condition.**
BCH Analysis;
1 Month Timeframe.
The fact that BCH broke out of the symmetrical triangle at a bearish point might really be one of the factors affecting the current price movement of BCH.
Another thing to note again is that in our current position,BCH is not responding to a major key level which should've acted as a support zone as it continues to go bearish.
But it's a good thing that this is the 1 month timeframe as there's still much time for it to reverse it's movement to a bullish path hopefully.
1 Day Timeframe.
From one point, were able to see a perfect break out and that too at a Bullish part.
But it all changed as the candlesticks retested a resistance zone and made its way down on bearish stance.
The candlesticks also retested another resistance zone and made it's way to the nearest support zone as there were hopes of it stopping there and making it's way upwards.
But unfortunately, BCH had other plans as it surpassed that support zone yet again.
4 Hour Timeframe.
Like I always say, using the smaller time-frames will help give you an indepth view of the chart.
But this time around, If we look closer, we'll also find same multiple resistance zones that happened on the 1Day timeframe repeating itself in the 4 hour timeframe.
Overall: The BCH market is on a bearish moment right now. Hopefully things will be getting better as time goes on.
**Swap your crypto anytime, without account registration. Fast and Secured. 🔽🔽🔽**
https://sideshift.ai/a/Omar
**Until next time, Peace.**
SideShift.ai; A Convenient Way To Swap Your Crypto Without Account Registration.
Today, I'm introducing you to a fast and convenient way to swap your crypto even faster and more secured which I use personally. **(Sideshift.ai)** https://sideshift.ai/a/Omar
Sideshift.ai is a really great place to swap your Crypto and Tokens as it currently supports about 48! Cryptocurrencies and Tokens which you can swap to anytime, anywhere That too including BCH. https://sideshift.ai/a/Omar
Sideshift.ai also refunds your crypto if you experience any inconveniences.
HOW TO USE?
To use Sideshift.ai is as simple as you think. Below are the simple steps to follow: https://sideshift.ai/a/Omar
Once on the platform, select the crypto or token you will be sending and also the crypto or token you'll be receiving.
Simply paste your contact address of what crypto or token you'll be receiving in the space provided.
Send the amount of crypto or token you want to swap or exchange to the provided contact address you'll be given.
That's it! You'll be receiving your desired crypto or token you want.
Below are the Cryptocurrencies and Tokens supported on Sideshift.ai: https://sideshift.ai/a/Omar
***AVAX*** `(AVALANCHE)` https://sideshift.ai/a/Omar
**AXS**`(Axie Infinity)` https://sideshift.ai/a/Omar
**BUSD**`(BUSD)BEP-20)` https://sideshift.ai/a/Omar
**BAT**`(Basic Attention Token)` https://sideshift.ai/a/Omar
**BNB**`(Binance Coin)BSC` https://sideshift.ai/a/Omar
**BTC**`(Bitcoin)` https://sideshift.ai/a/Omar
**BCH**`(Bitcoin Cash)` https://sideshift.ai/a/Omar
**ETH**`(Ethereum)` https://sideshift.ai/a/Omar
**MIM**`(Magic Internet Money)` https://sideshift.ai/a/Omar
**XMR**`(Monero)` https://sideshift.ai/a/Omar
**MATIC**`(Polygon)POLYGON` https://sideshift.ai/a/Omar
**MATIC**`(Polygon)ERC-20` https://sideshift.ai/a/Omar
**SHIB**`(Shiba Inu)ERC-20` https://sideshift.ai/a/Omar
**XAI**`(Sideshift Token)Balance` https://sideshift.ai/a/Omar
**XAI**`(Sideshift Token)ERC-20` https://sideshift.ai/a/Omar
**SLP**`(Smooth Love Potion)` https://sideshift.ai/a/Omar
**SOL**`(Solana)` https://sideshift.ai/a/Omar
**XLM**`(Stellar Lumens)` https://sideshift.ai/a/Omar
**LUNA**`(Terra)TERRA` https://sideshift.ai/a/Omar
**UST**`(Terra USD)TERRA` https://sideshift.ai/a/Omar
**USDT**`(Tether)ERC-20` https://sideshift.ai/a/Omar
**WBTC**`(WBTC)ERC-20` https://sideshift.ai/a/Omar
**XRP**`(XRP)` https://sideshift.ai/a/Omar
**FLEXUSD**`(flexUSD)SLP` https://sideshift.ai/a/Omar
**COMP**`(Compound)ERC-20` https://sideshift.ai/a/Omar
**SRM**`(Serum)ERC-20` https://sideshift.ai/a/Omar
**SUSHI**`(Sushi)ERC-20` https://sideshift.ai/a/Omar
**USDC**`(USDC Solana)Solana` https://sideshift.ai/a/Omar
**USDC**`(USDC)Bep-20` https://sideshift.ai/a/Omar
**USDC**`(USDC)ERC-20` https://sideshift.ai/a/Omar
**USDC**`(USDC.e)AVALANCHE` https://sideshift.ai/a/Omar
**USDT**`(USD.e)AVALANCHE` https://sideshift.ai/a/Omar
**UNI**`(Uniswap)ERC-20` https://sideshift.ai/a/Omar
**YFI**`(Yearn.finance)ERC-20` https://sideshift.ai/a/Omar
**DAI**`(Dai)ERC-20` https://sideshift.ai/a/Omar
**USDH**`(Honest coin)Slp` https://sideshift.ai/a/Omar
**USDT**`(Tether)LIQUID` https://sideshift.ai/a/Omar
**USDT**`(Tether)Slp` https://sideshift.ai/a/Omar
**XAUT**`(Tether Gold)ERC-20` https://sideshift.ai/a/Omar
**L-BTC**`(Bitcoin)LIQUID` https://sideshift.ai/a/Omar
**BTC**`(Bitcoin)LIGHTNING` https://sideshift.ai/a/Omar
**DASH**`(Dash)` https://sideshift.ai/a/Omar
**DOGE**`(Dogecoin)` https://sideshift.ai/a/Omar
**FTT**`(FTX Token)ERC-20` https://sideshift.ai/a/Omar
**LTC**`(Litecoin)` https://sideshift.ai/a/Omar
**ZEC**`(Zcash)Transparent` https://sideshift.ai/a/Omar
**ZEC**`(Zcash)Shielded` https://sideshift.ai/a/Omar
*Sideshift.ai also provides you with the minimum and maximum amount you can swap on each Crypto or Token which is generally accepted. https://sideshift.ai/a/Omar
*Sideshift.ai also supports staking using their native token (XAI). https://sideshift.ai/a/Omar
https://read.cash/@InvestorOmar/update-crypto-to-the-moon-bitcoin-cashbtc-12dfd92 https://read.cash/@InvestorOmar/update-crypto-to-the-moon-bitcoin-cashbtc-12dfd928
**That's it for Today:)**
**Until Next Time, Peace.**
Bitcoin Cash Analysis #31; Crypto To The Moon.
DISCLAIMER: I am not a financial advisor nor certified analyst. All contents discussed on this blogpost are solely my own personal views and for Trading education/entertainment purposes only . Do your own research and due diligence.
With that being said, let's get into it;
1 Month Timeframe.
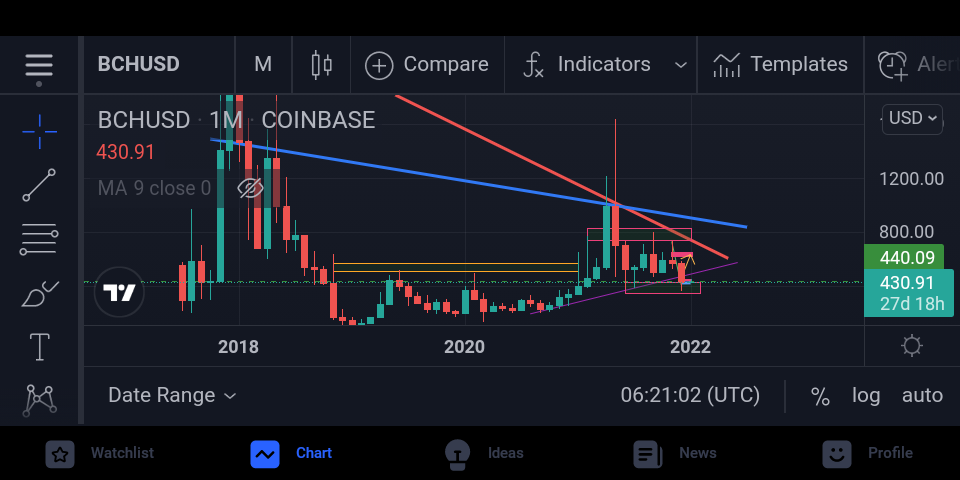
On the 1 month timeframe, we're still on the base level of the support zone and as we are priced $430.91, we struggle to bounce of the support zone and make our way up to the nearest resistance zone.
But the fact that we broke out on the bearish part of the symmetrical triangle, that's actually something to maybe worry about, But we're still hoping it's nothing but just a false break out.
1 Day Timeframe.
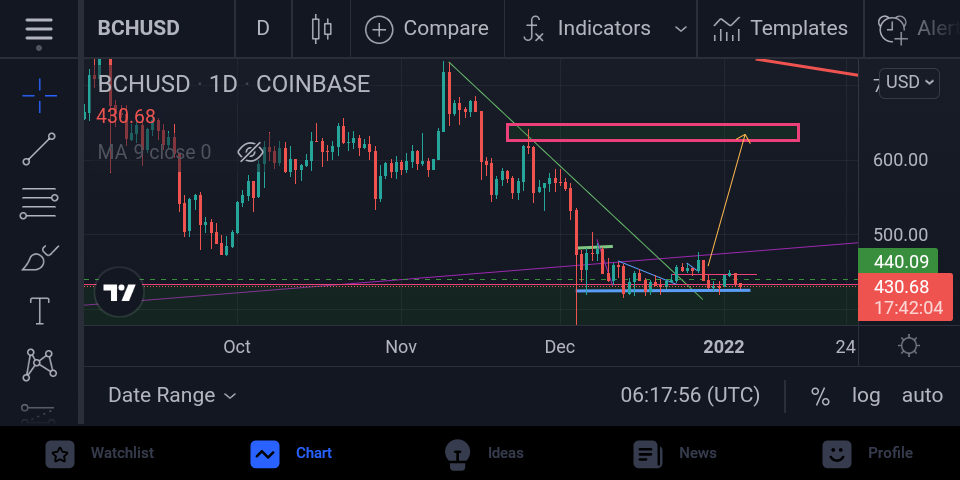
I'm sure you must have noticed that in those previous days, the price of BCH has decreased for sometime now from about $456 - $430.68 as of the time I'm making this analysis . If you've been following up with my analysis, you could have known the reason why we experienced some decrease in price as I've already made analysis on it, and guess what, I was right again.
So in my previous analysis, I spoke about the candlestick that was formed and that gradually made its way up to the nearest resistance zone, right. And I also mentioned about it falling as we were based on the resistance zone.
So what happened was simple. As we got to the resistance zone, we couldn't move further in a bullish path anymore. On we reaching the resistance zone, we were forced to move downwards or go on a bearish movement
Well That's It For Today.
Make sure you stay updated on the price movements of your crypto because you'll never know when to buy more or sell more.
Overall: We underwent some little bearish movement as predicted, but not to worry, were already at the support zone which will support our bullish movement.
*swap your crypto anytime for free without account registration*
https://sideshift.ai/a/Omar
`Until next time, Peace.`
 @InvestorOmar