Bitcoin Cash Analysis #30; Crypto To The Moon.
DISCLAIMER: I am not a financial advisor nor certified analyst. All contents discussed on this blogpost are solely my own personal views and for Trading education/entertainment purposes only . Do your own research and due diligence.
With that being said, let's get into it;
1 Day Timeframe.
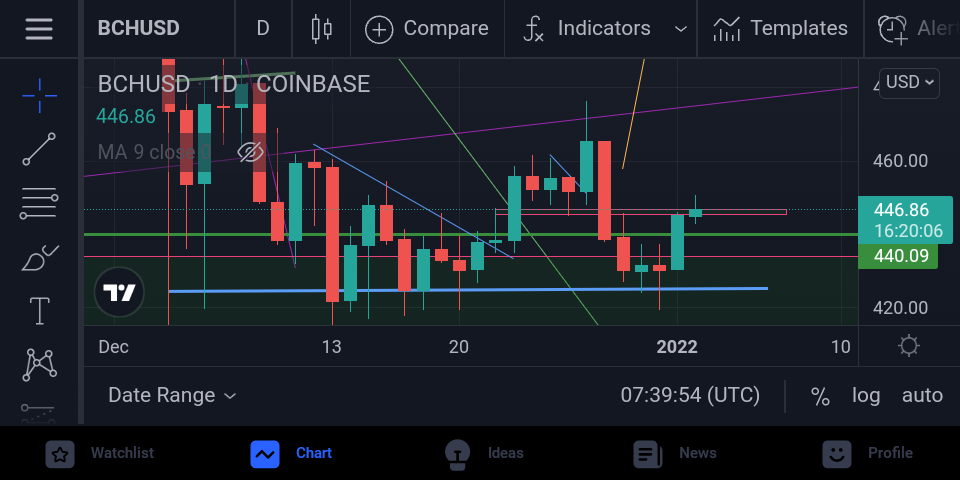
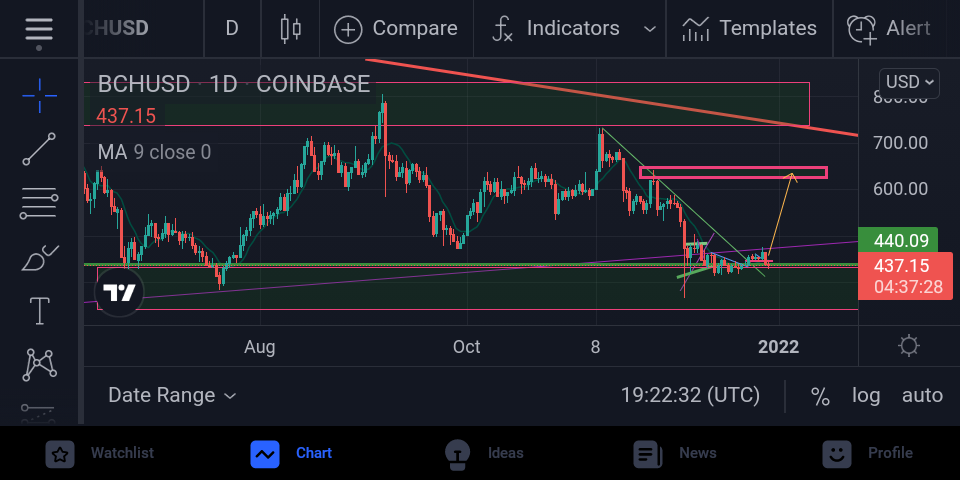
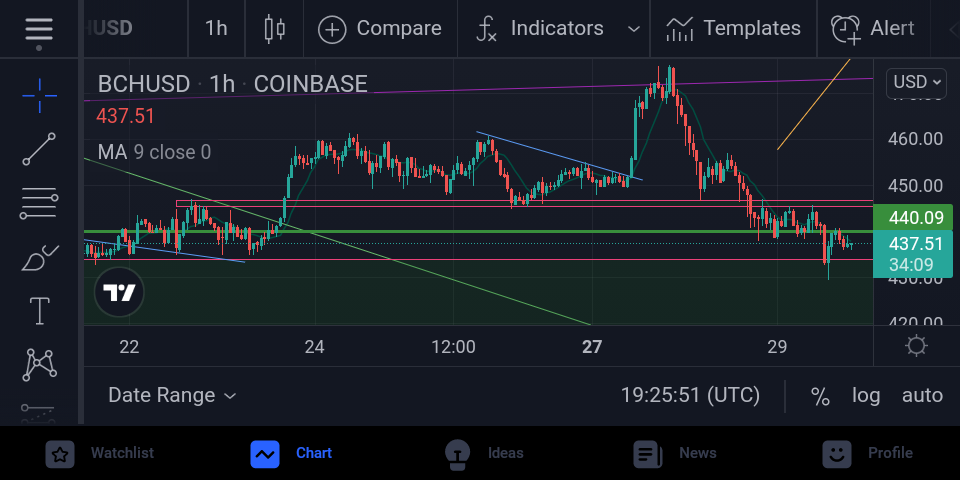
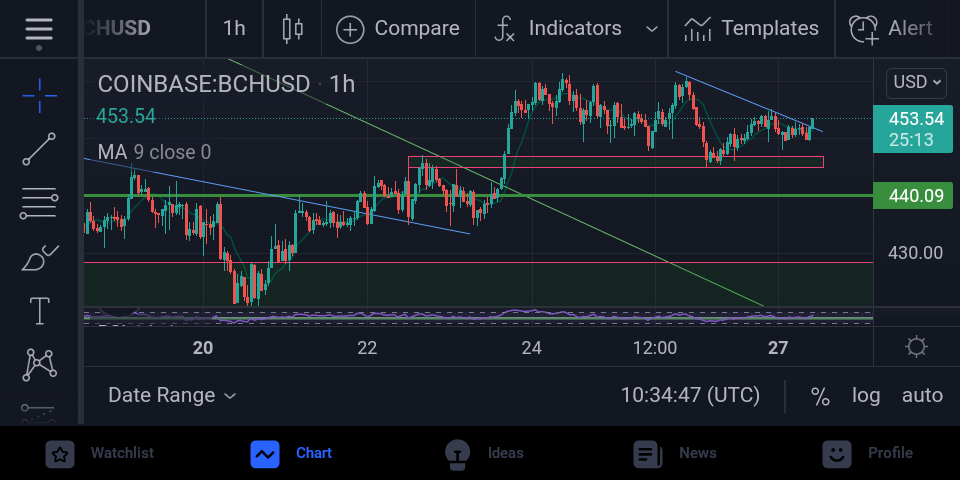
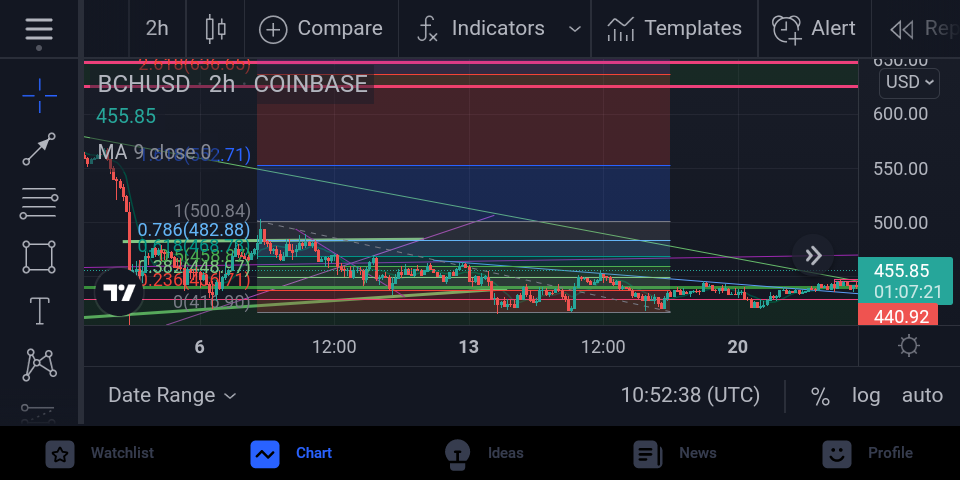
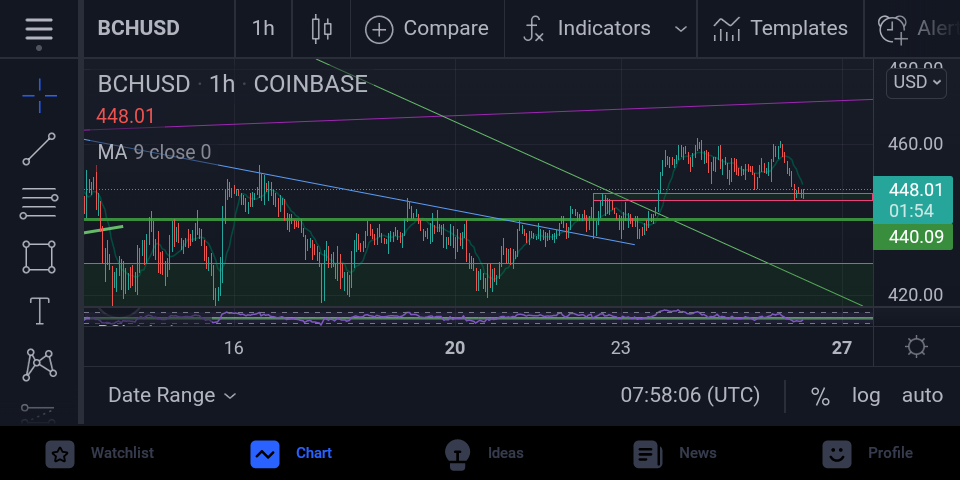
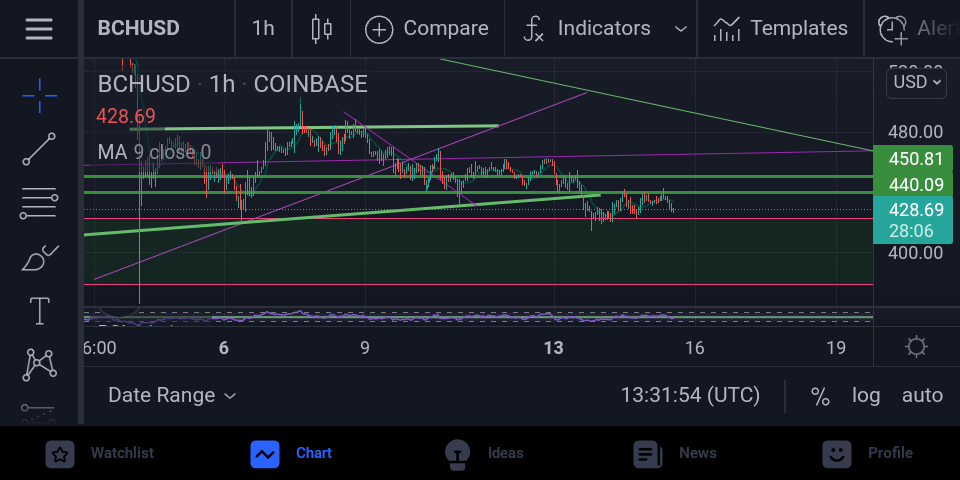
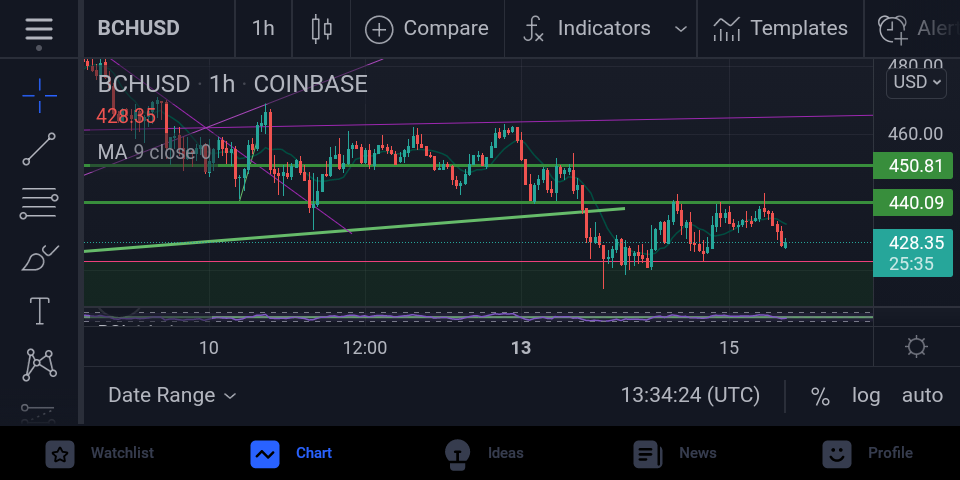
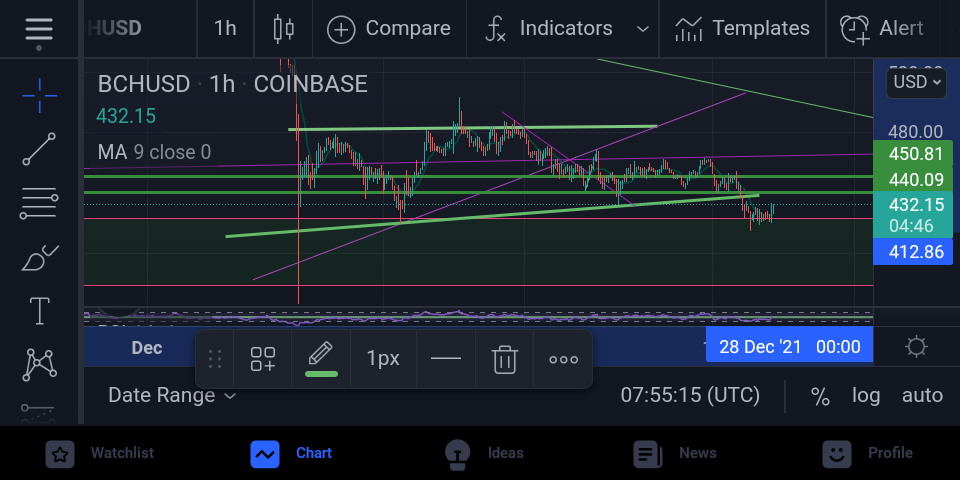
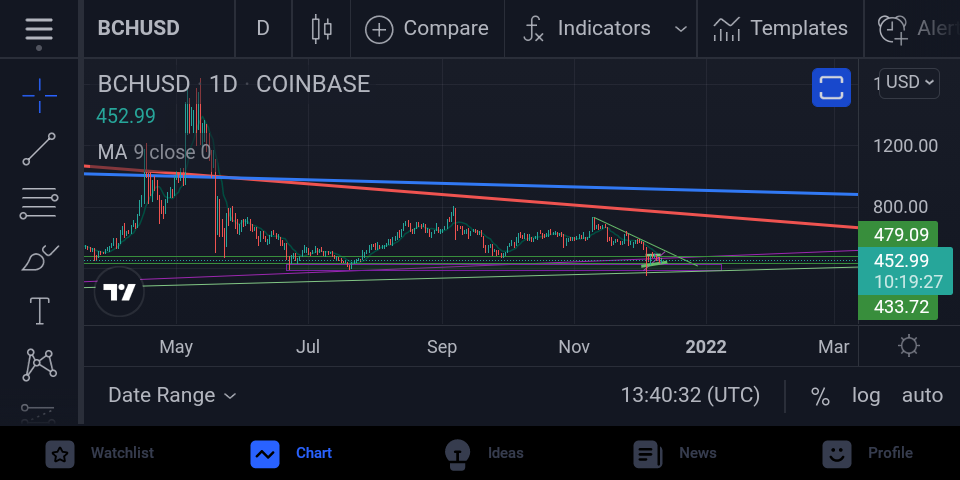
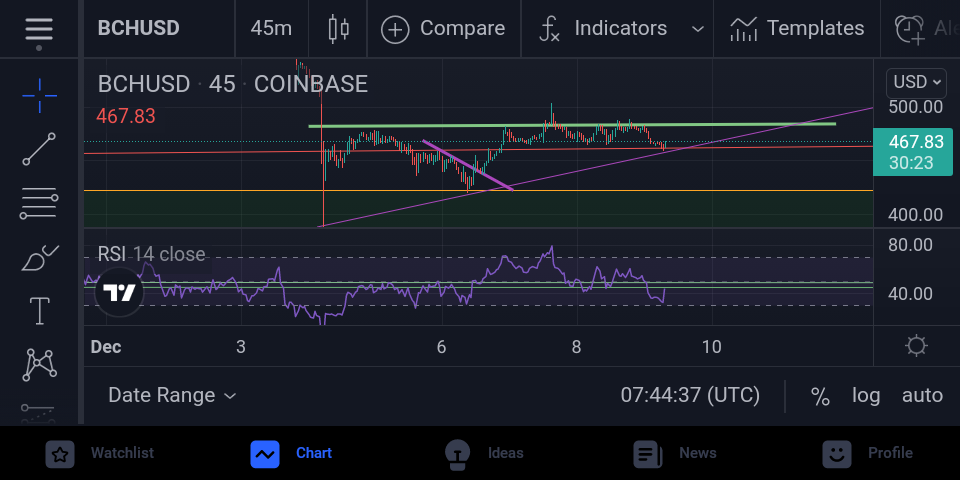
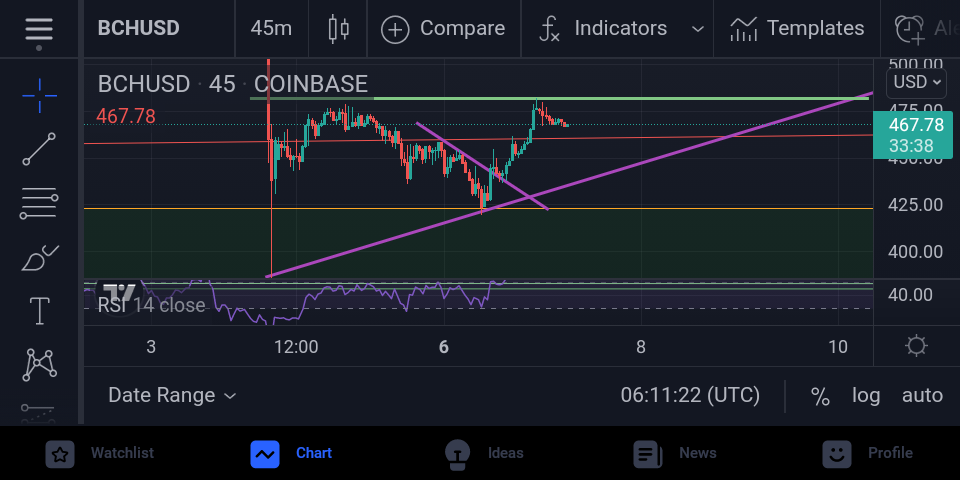
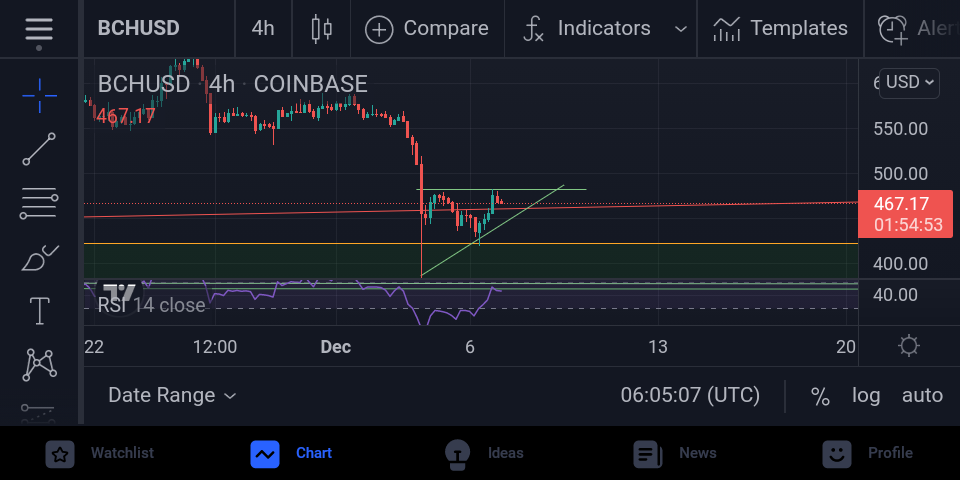
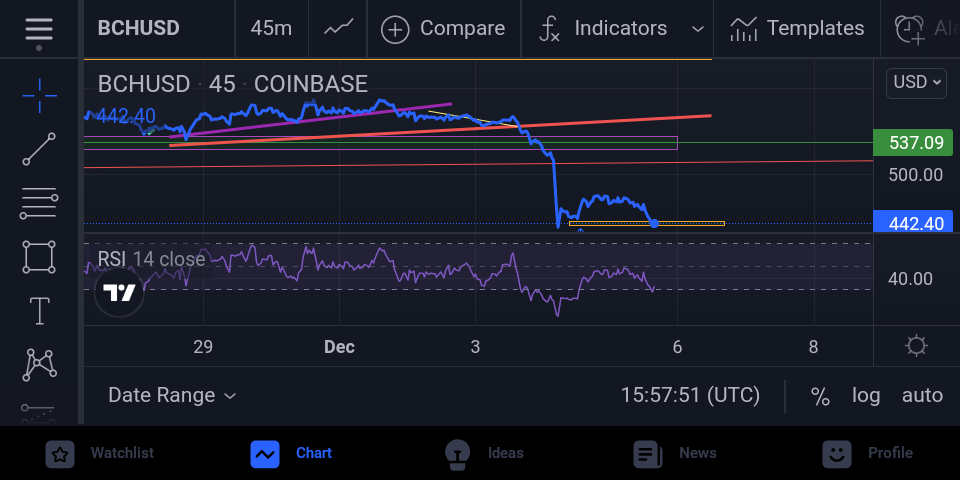
Starting with the 1 day Timeframe, Nothing much has happened from were we stopped yesterday. As of now, there's a new candlestick which is created just above the one we stopped at yesterday.
With the Newly formed candlestick, we can either go bearish for some short period of time if there's failure to move above the support level. Nothing much has happened in the 1 Day Timeframe.
***Moving on to the 1 month timeframe, well I think there might be some little problem. But hopefully, I hope it gets cleared up in no time.***
1 Month Timeframe.
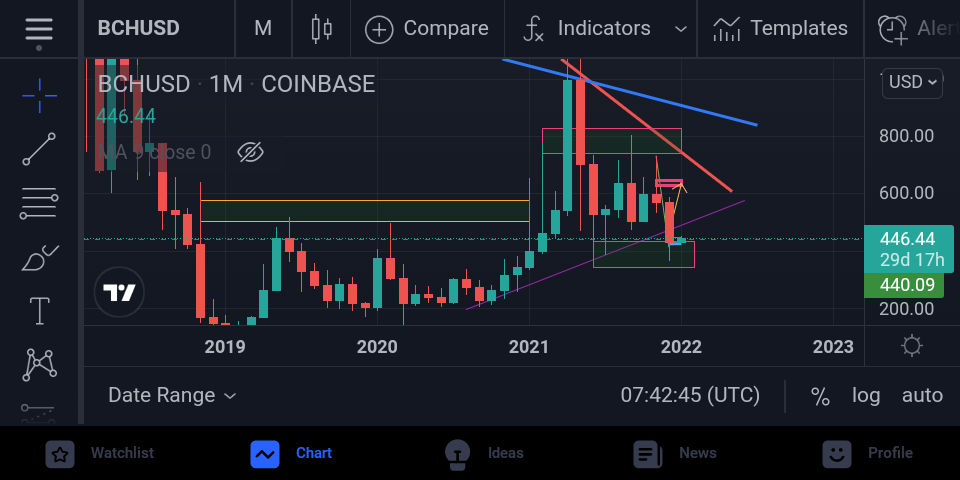
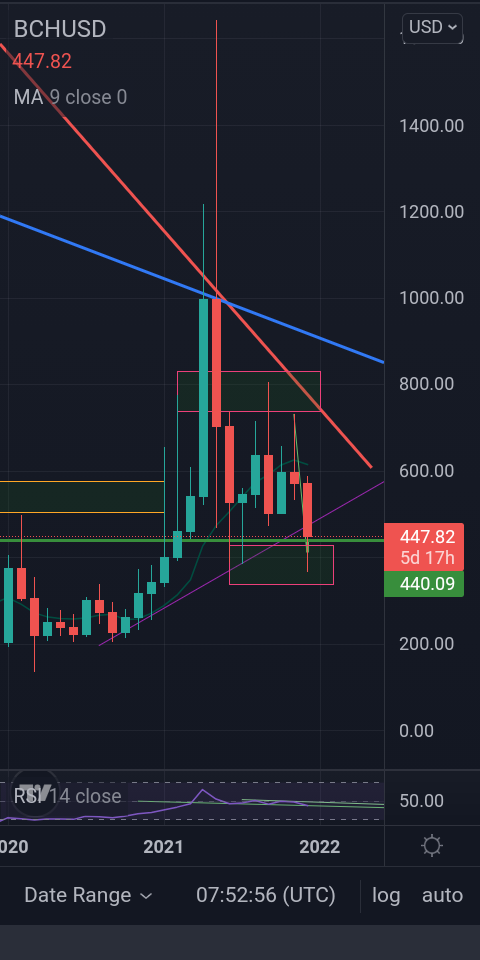
Now, this is were things get a little complicated. Part of being a trader is you accepting you don't know what's going to be happening all the time on any chart be it in crypto or stocks.
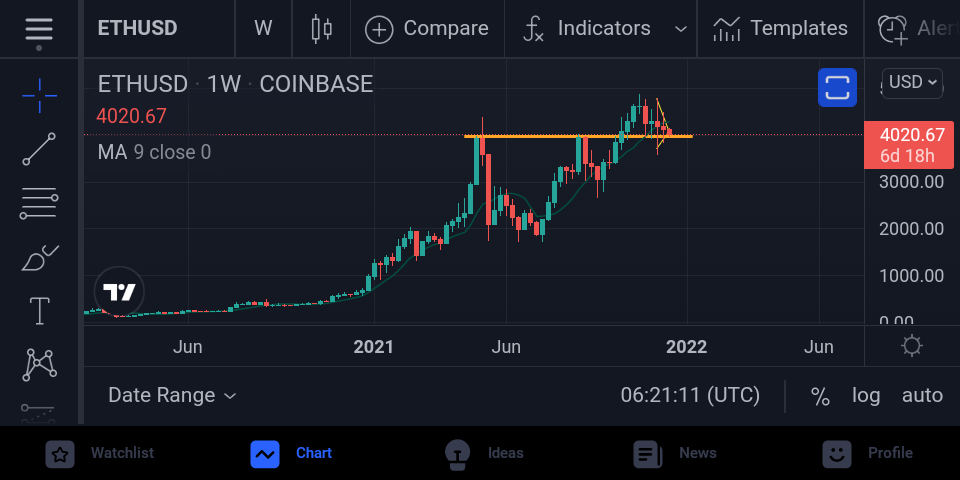
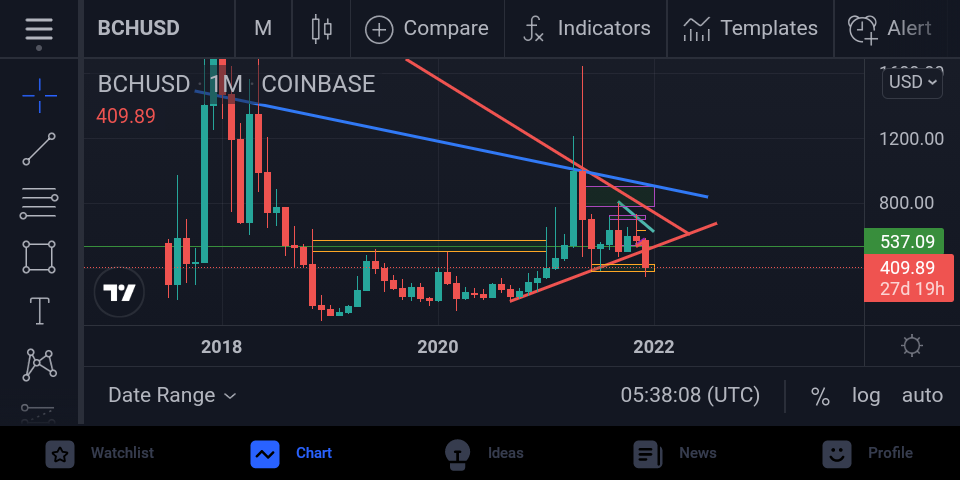
What happened is that we were actually expecting that last Red candlestick to close inside of the symmetrical triangle or at least just above the purple trend line. But that's clearly not what happened as the opposite of it happened.
We eventually ended up closing below the purple trend line and breaking the symmetrical triangle at a bearish point or path. But not to worry, We hope this is just a false breakout as we go bullish.
Just so you know, There's still hope for a bullish movement as we are still based on the the key level which acts as a support level.
Overall: We're still at the base level of a major key level which acts as a support zone for bullish movements.
Support our work :)
`Bnb address:`
0x82A2571BcC2FD815eA681A26e79a541373cf2718
`Until next time, Peace.`
Bitcoin Cash Analysis #29; Crypto To The Moon; Jan,1,2022.
DISCLAIMER: I am not a financial advisor nor certified analyst. All contents discussed on this blogpost are solely my own personal views and for Trading education/entertainment purposes only . Do your own research and due diligence.
With That Being Said, Let's Get into it;
1 Day Timeframe Analysis.
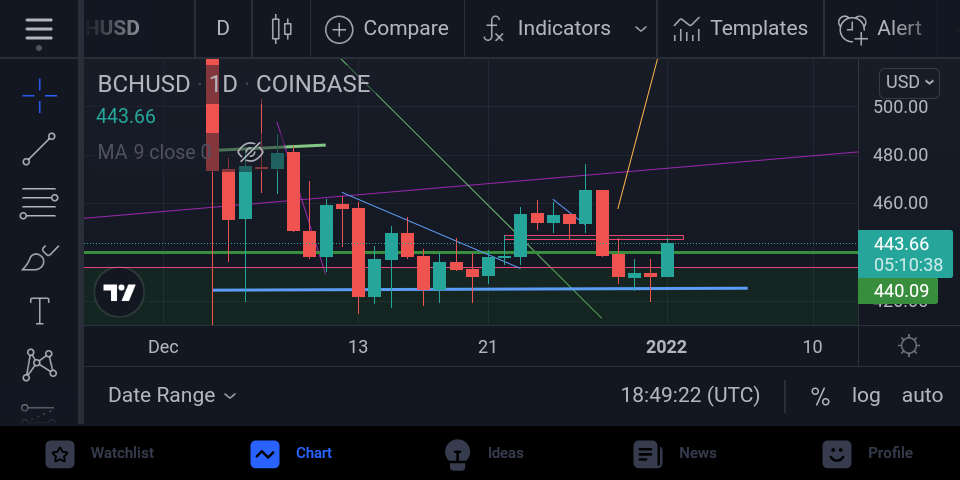
Using the 1 Day Timeframe, from were we stopped last time, there has been a retest on the purple trend line which translated further into a bearish movement as it bounces it back into the support level created just below the candlesticks (it's colored light blue on the chart)
After the retest on the trend line,the candlesticks didn't only went bearish but it also broke The Key level which acted as both support and resistance as it made it's way to the support zone.
After the retest on the support zone, the candlestick then bounced up further and we had some increase in price as we're now at priced at around $443.66 respectively.
But we might experience some bearish movement for a short time as we make it to the Key level which acts as a resistance zone.
1 Hour Timeframe.
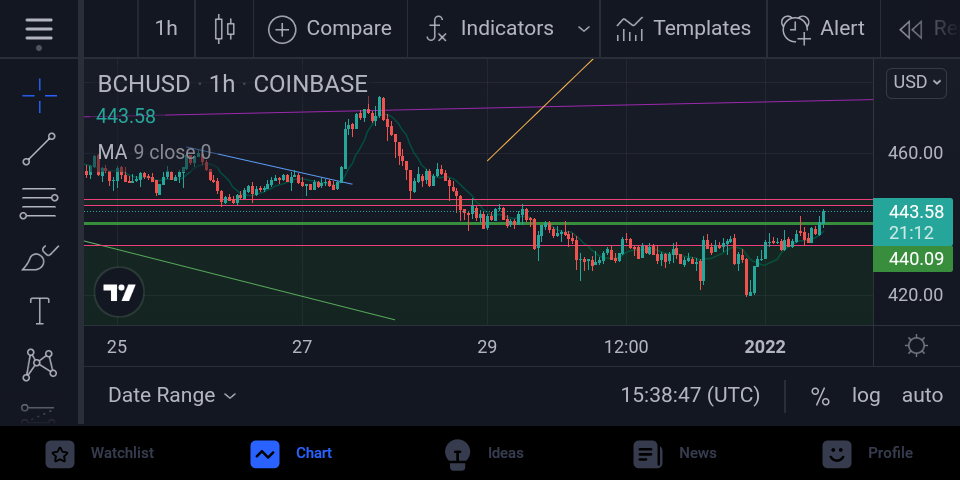
Using the 1 Hour timeframe, we'll just get an even more detailed look on what's happening on BCH price movement.
After reaching the resistance zone just as stated earlier, I repeat " we might go on a short bearish movement as we retest the the key level.
**And that's it for today guys, Tune in the next update as I have something quite important to share about the 1 month timeframe.**
Overall: We might experience some short term bearish movement nonetheless.
*https://read.cash/@InvestorOmar/update-crypto-to-the-moon-bitcoin-cashbtc-12dfd928https://read.cash/@InvestorOmar/update-crypto-to-the-moon-bitcoin-cashbtc-12dfd928*
**Until next time, Peace.**
A Chat With A Deceptive Crypto Scammer; Beware!!
As long as you're on the crypto market, trust me you're exposed to them more than you might think, so please do be careful.
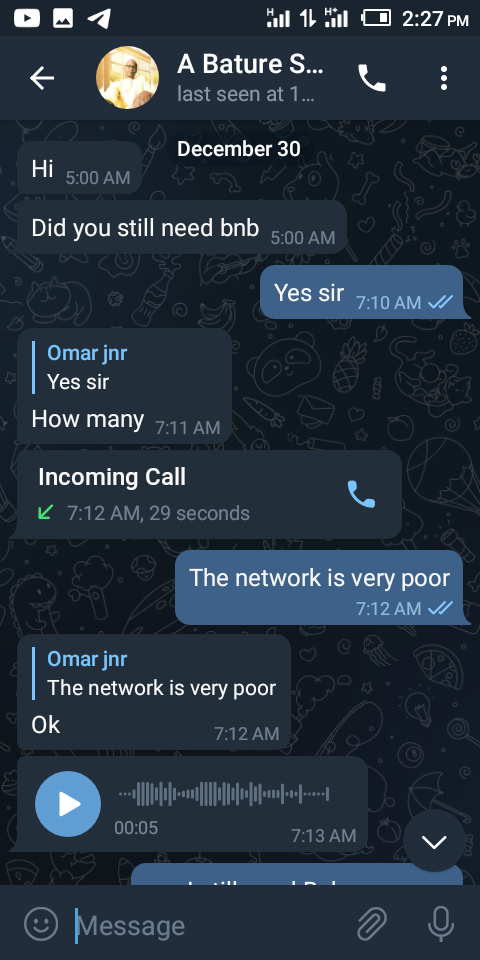
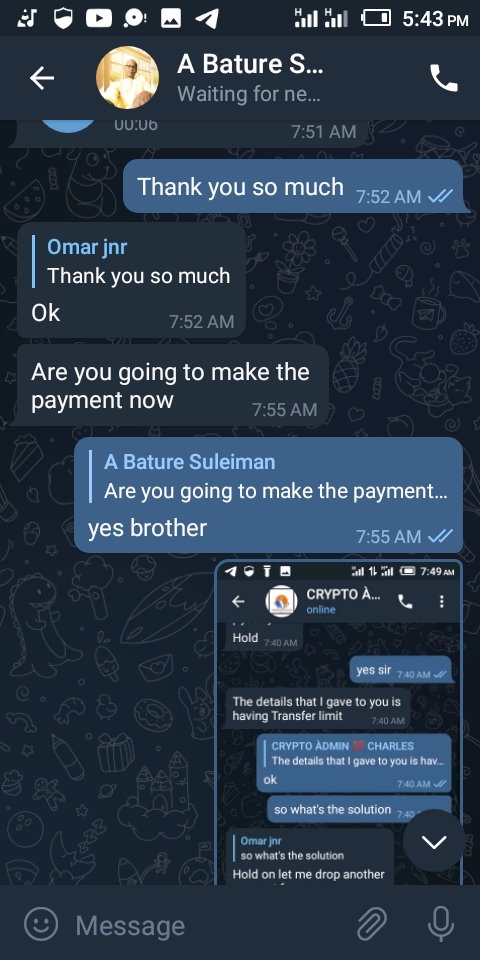
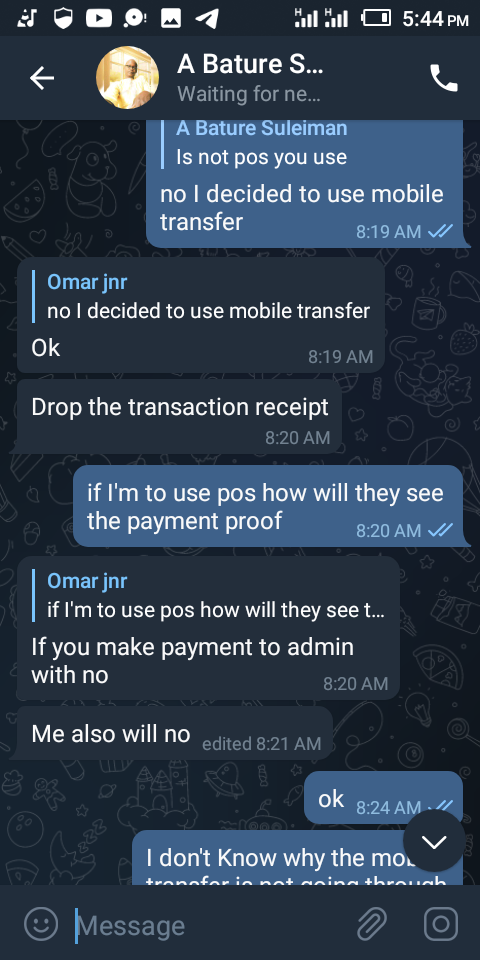
Below is a conversation that took place between a scammer and Omar jnr:
How it started;
clip 1.
Clip 2.
And Then;
clip 3.
Continued scamming with his dead and broken english.
clip 4.
After receiving the payments;
After Payment's;
clip 5.
He then decides to pressure omar jnr into buying $500 worth of BNB just so he can scam and steal his $500.
After More Pressure;
clip 6.
Scammer finally runs away after understanding that Omar jnr has recognized his a scammer. He was able to get away with money which is worth 0.11 BCH
At the end of the day, don't trust people who dm you to buy for sell crypto unless they're well known and recognized for buying and selling crypto (which you'll hardly find.
It's best if you buy from legit sources like Binance, Bitcoin.com etc.
`Please stay safe and keep your crypto safe too.`
https://read.cash/@InvestorOmar/update-crypto-to-the-moon-bitcoin-cashbtc-12dfd928
**Until next time, peace.**
Bitcoin Cash Analysis #28; Crypto To The Moon.
DISCLAIMER: I am not a financial advisor nor certified analyst. All contents discussed on this blogpost are solely my own personal views and for Trading education/entertainment purposes only . Do your own research and due diligence.
We'll be using the 1 Hour and 1 Day time-frames respectively. With that being said, let's get into it;
1 Day Timeframe
Using the 1 Day timeframe in our analysis, we can tell that the candlesticks at BCH after a bullish breakout still underwent a bearish movement or a decrease in price for some time as the candlesticks find time to move gently on the support zone.
There might be a bullish or increase in price on BCH anytime soon as these candlesticks keep on moving on the support zone.
**what where spotted on BCH Charts After Analysis;**
There are still high possibilities of Going Bullish or increasing in price anytime soon after the break out on the 1 Day Timeframe.
Since The Candlesticks are still moving on the Support zone which is literally above it and not below it, we're definitely still good to go.
1 Hour Timeframe
**Some Key points in the chart analysis**
The first pink line is the first support zone
The second line coloured green is the second support zone.
And finally,the last or third support Zone is the thin pink line.
While the 1 Hour Timeframe gives us a more in-depth on what's happening on BCH Price movement by giving us a more closer view and definitely more information. After the candlesticks in BCH had reached the resistance zone and furthermore retested back to the support zone.
But this time, it doesn't bounce off but insteadly,it broke it and continued reaching for the next support zone. But on getting there again, it didn't stop but made a break through yet again.
After some time, it finally settled for sometime on the second support zone before it finally reached for the last support zone. On reaching the last support zone, it then finally bounced off. And that's where we are presently.
*Overall: We've undergone some bearish or decrease in price for sometime now but we've likely came to it's end. Buying some more BCH might be a Good Idea.*
https://read.cash/@InvestorOmar/update-crypto-to-the-moon-bitcoin-cashbtc-12dfd928
until next time, Peace.
Bitcoin Cash Analysis #27; Crypto To The Moon
DISCLAIMER: I am not a financial advisor nor certified analyst. All contents discussed on this blogpost are solely my own personal views and for Trading education/entertainment purposes only . Do your own research and due diligence.
with that being said, let's get into it;
1 Day Timeframe
Today using the 1 Day timeframe, we've taking a little leap from where we stopped yesterday. BCH underwent a bullish movement but nevertheless reached a resistance zone close by which made it retrace or fall a little bit.
The falling shouldn't be that much because of two main factors which are stated below;
Firstly, we just broke out of a trend line and that too at a bullish standard.
Secondly, even if we were to fall or go bearish, it wouldn't be for too long since the support level is not far from were we are.
`So it's therefore a win win situation:)`
2 Hour Timeframe
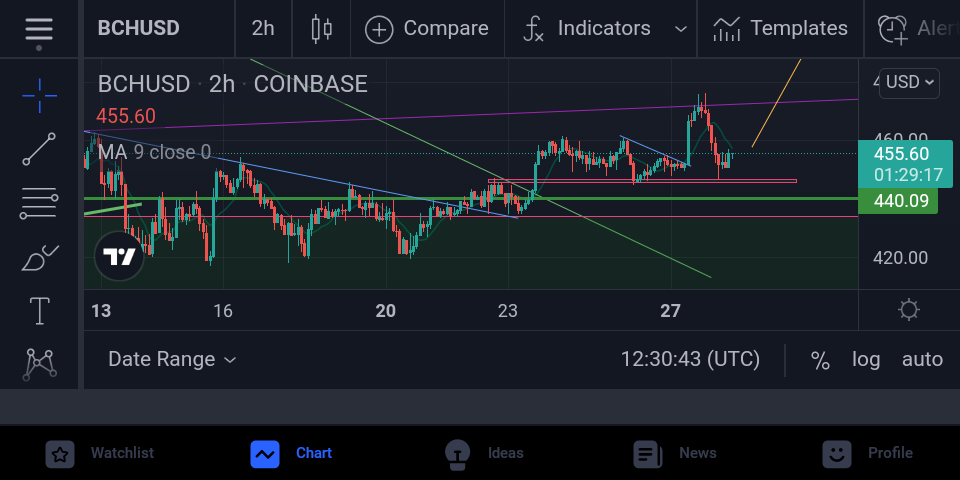
Using the 2 Hour Timeframe, we'll see the candlesticks moving in a bullish way after it broke out of the previous trend line which we used on the 1 Day Timeframe. After some increase in price, we then experienced respect on the support zone some couple of times. Twice to be precise.
Before the previous respect on the trend line, the candlesticks moved in a bullish way to the extent it was able to touch the resistance zone, right above it and then retraced immediately to the nearest support zone. And that's where we currently are.
OVERALL: BCH Is definitely going on a bullish streak or increase in price. Buying more might be a good idea.
https://read.cash/@InvestorOmar/update-crypto-to-the-moon-bitcoin-cashbtc-12dfd928
***Have A Nice Day!!***
Stand A Chance To Claim 0.4 BNB First 10 clickers 🎉🎉🎉 https://t.me/bnbbscairdrop_bot?start=1222242090
`Until Next Time, Peace.`
BCH Analysis #26; (Dec/27/2021) Crypto To The Moon. #fibonacci
DISCLAIMER: I am not a financial advisor nor certified analyst. All contents discussed on this blogpost are solely my own personal views and for Trading education/entertainment purposes only . Do your own research and due diligence.
With that being said, let's get into it;
1 Day Timeframe;
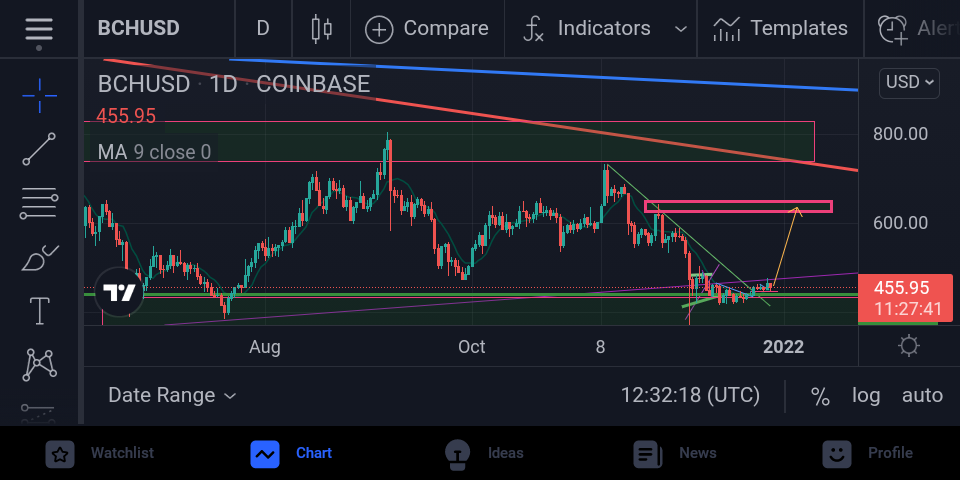
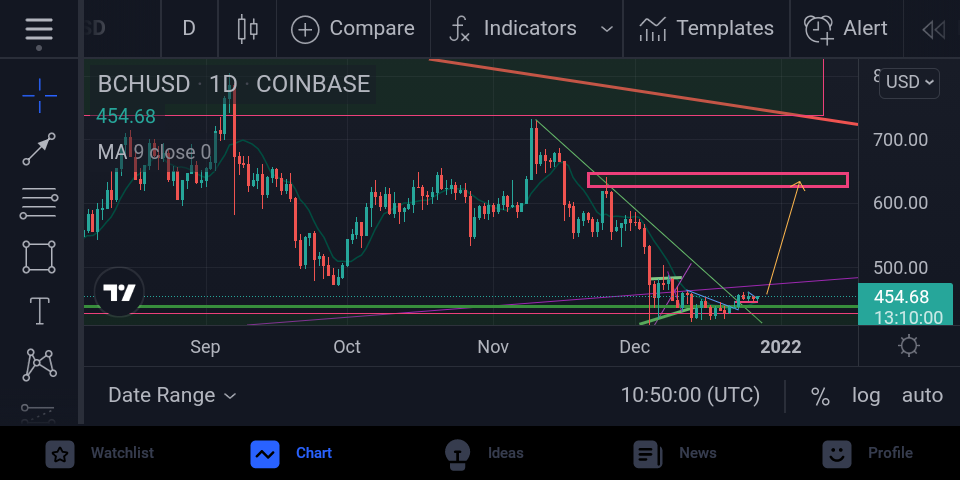
Today we're up at about $454.68 on BCH. Using the 1 Day timeframe, we all clearly see that we've just broken the trend line and we're still on the "base level" you could say as we haven't yet still increased in price that much as we're still on the base level of the breakout.
But in no time, we'll find 1 BCH priced about $600+ as there's a resistance zone there.
The Resistance zone in the chart is coloured pink in bold.
1 Hour Timeframe
Using the 1 Hour timeframe, from where we stopped yesterday there has been some bearish movement and we finally found ourselves landing on the support zone and then bouncing right back up.
During this movements, a little trend line In the form of a symmetrical triangle was formed right above the candlesticks. But as of the time of making this analysis, it has already being broken and that too at a bullish point.
The little line which is coloured light blue is the trend line I'm talking about.
The #Fibonacci Sequence Using The 2h Timeframe
Now this is the famous "Fibonacci sequence" in use. With the use of fibonacci sequence, I'm guaranteed yet again that we'll soon be pricing about $600+ as the 2.618 point of the fibonacci sequence lands on the expected resistance zone which is also around $600+.
Overall: Buying more BCH might be a good idea as price increases overtime.
Previous Analysis;
*Bitcoin Cash Analysis #25; Crypto To The Moon December-26 -2021.* https://read.cash/@InvestorOmar/bitcoin-cash-analysis-25-crypto-to-the-moon-4d6dfb95
Bitcoin Cash Analysis #25; Crypto To The Moon.
**DISCLAIMER: I am not a financial advisor nor certified analyst. All contents discussed on this blogpost are solely my own personal views and for Trading education/entertainment purposes only . Do your own research and due diligence.**
With That Being said, let's get into it;
**BCH Analysis; 1 Month Timeframe.**
Above is the 1 month Timeframe which is very crucial in Identifying long term trends be it bullish or be it bearish.
One of the main factor that can determine us being bullish or increase the price of BCH, is and should be the closing of BCH inside the symmetrical triangle formed or simply closing above that purple trend line.
If it does so as expected,then we can expect a continuation movement of the Trend line inside the triangle and then finally a break out which will lead to an increase in price of BCH. **More information on the 1 Hour Timeframe**
**BCH Analysis; 1 Hour Timeframe**
Currently, I've spoken about a trend line formed in the 1 Day - 1 Hour timeframe which would lead to an increase in price after it's breakout. Well, that's exactly what happened as we experience an increase on price in these past days.
But recently, the price of BCH reduced from around $460.00 to $448.01 . This was due to the fact that the candlesticks reached for the nearest support level respectively.
No worries though, hopefully we'll get back up in no time after the candlesticks bounce off the support zone.
Overall: BCH has finally broke the trend line and began a bullosh movement.
https://read.cash/@InvestorOmar/update-crypto-to-the-moon-bitcoin-cashbtc-12dfd928
**Until next time,Peace.**
Daily Crypto Analysis; BCH Today; Crypto To The Moon.
`DISCLAIMER: I am not a financial advisor nor certified analyst. All contents discussed on this blogpost are solely my own personal views and for Trading education/entertainment purposes only . Do your own research and due diligence.`
With That being said, let's get into it;
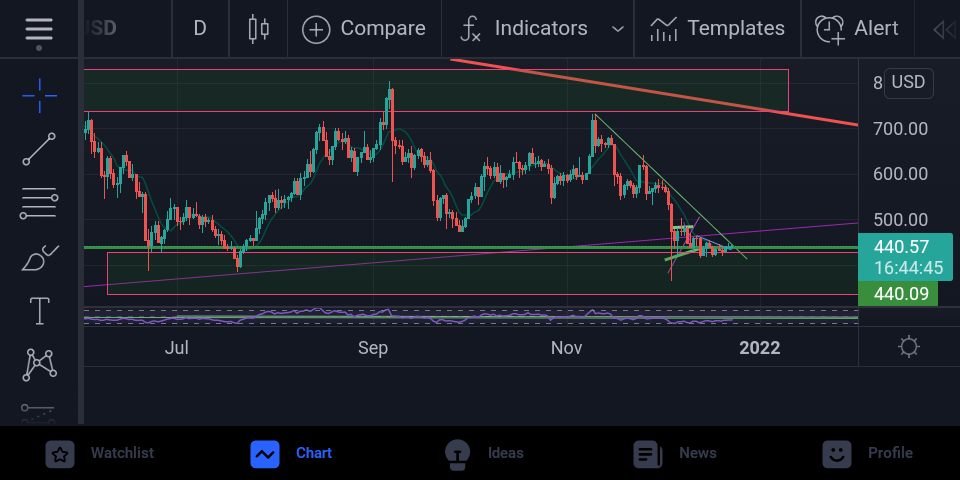
1 Day Timeframe
Today, we're currently about $440.57 on BCH as of writing this article. We're still at the support level which was created lately on the 1 Day Timeframe as we wait patiently for a breakout on the trend line formed.
It's really a Good News that we're literally on the verge of that breakout which will hopefully and surely lead to a Bullish movement.
***What Where Spotted After The Analysis on 1 Day Timeframe.***
A Trend line which we're on the verge of breaking to a bullish stance.
Respect on the the support zone as we get closer to the end of the trend line.
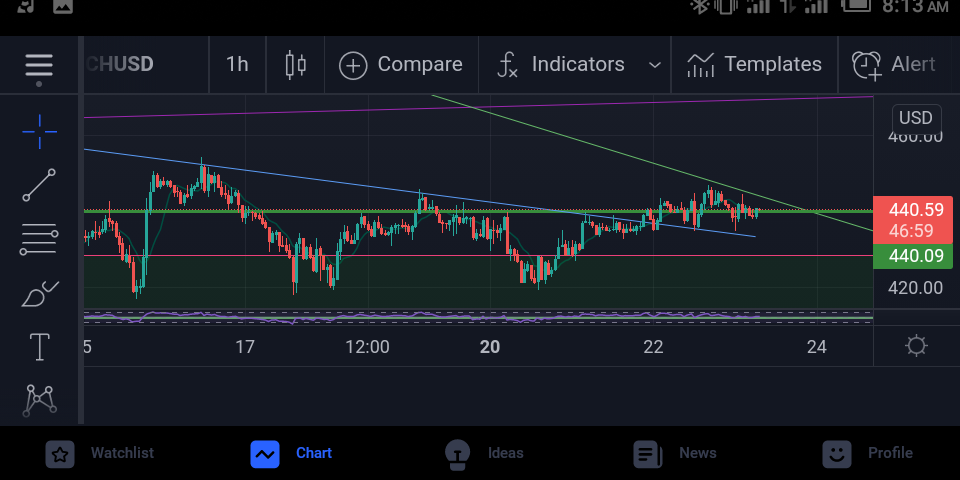
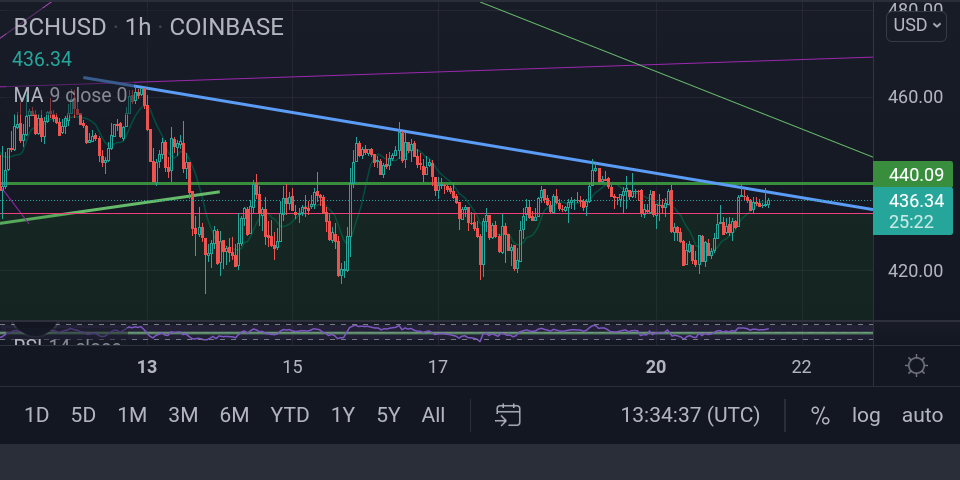
1 Hour Timeframe
As for the 1 Hour timeframe, we're moving towards the end of the trend line as we rise and reach for the trend line for a bullish break out.
Here on the 1 Hour timeframe, we also find, multiple retest on the support zone. After the last retest, we then moved towards the trend line and now waiting for a break out.
And also, there was also a previous trend line which we broke after it had multiple respect on the trend line. As we moved further,the trend line also acted as a support zone.
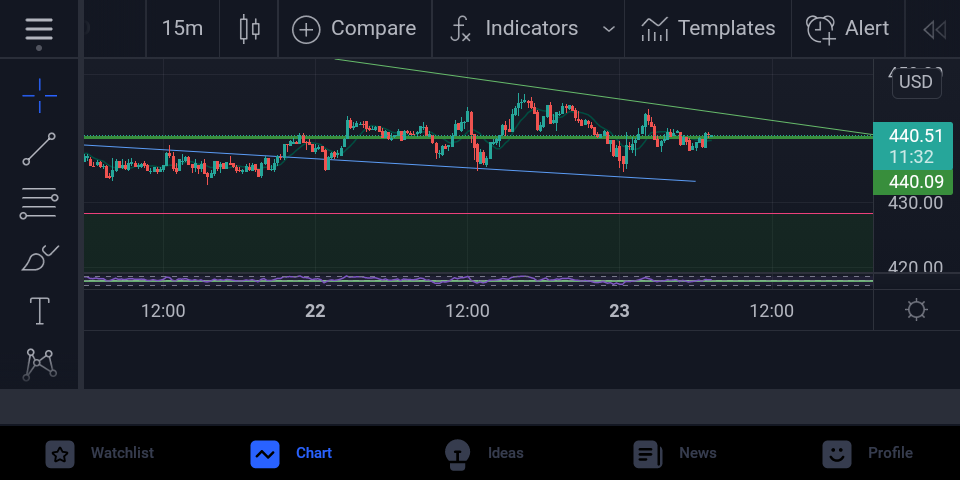
15 minutes timeframe
And finally, using the 15 minutes timeframe we simply just elaborate an have an even more clearer view of The 1 Hour Timeframe as we can see the previous breakout and multiple retest on the trend line.
`Overall: We're on the verge of breaking the trend line which will be leading to a bullish movement. Buying more BCH might be a good idea.`
https://read.cash/@InvestorOmar/update-crypto-to-the-moon-bitcoin-cashbtc-12dfd928
`Until next time, Peace.`
Crypto Update; Bitcoin And Bitcoin Cash Analysis; Crypto To The Moon.
DISCLAIMER: I am not a financial advisor nor certified analyst. All contents discussed on this blogpost are solely my own personal views and for Trading education/entertainment purposes only . Do your own research and due diligence.
With that being said, let's get into it;
BCH 1H TIMEFRAME
Surprisingly, BCH and BTC are moving in a very similar pattern. Me making an analysis on BCH is pretty much the same as making one on BTC. You'll Get to see that in no time.
In the above 1H timeframe, we're moving in a fine descending triangle pattern as we've respeced the support zone multiple times as you can see in the above analysis.
With all these happening, we're again going and getting closer bit by bit to the upcoming bullish increase very soon. After the respect on the trend line, we might go down a little bit but eventually get back up and move even more further hopefully.
BTC 1 DAY TIMEFRAME
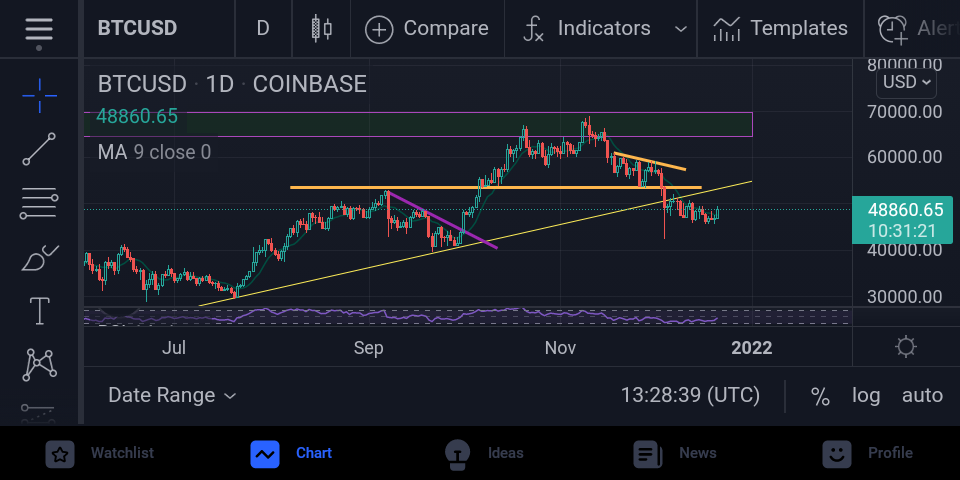
Using the 1 Day Timeframe on BTC, you'll see a breakout which lead to a quite long bearish candlestick afterwards. BTC is still at the stage where it broke out from the trend line. Though we can see something even more promising on the 1H timeframe.
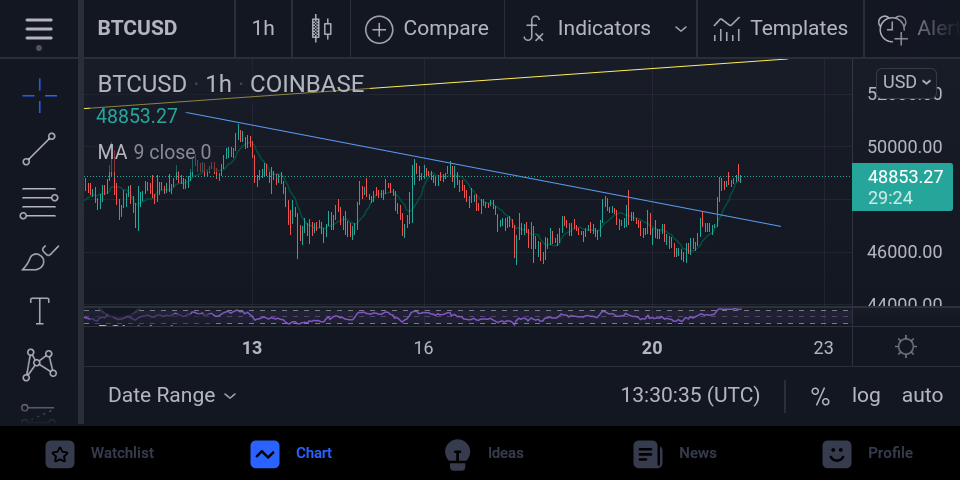
In the 1H timeframe, we can see a continuation of what happened after the break out and things are already looking good if you ask me. The trend line which is being formed or created which is similar to that created on BCH, has finally incurred a break out at the top level of the trend line which might just be a bullish start point for BTC after undergoing it's bearish moments.
`Overall: BTC and BCH are both about to engage in some bullish movements although BTC might have already had a start up.`
Update; Crypto To The Moon; Ethereum Analysis.
`DISCLAIMER: I am not a financial advisor nor certified analyst. All contents discussed on this blogpost are solely my own personal views and for Trading education/entertainment purposes only . Do your own research and due diligence.`
With that being said, let's get into it;)
1 Day Timeframe
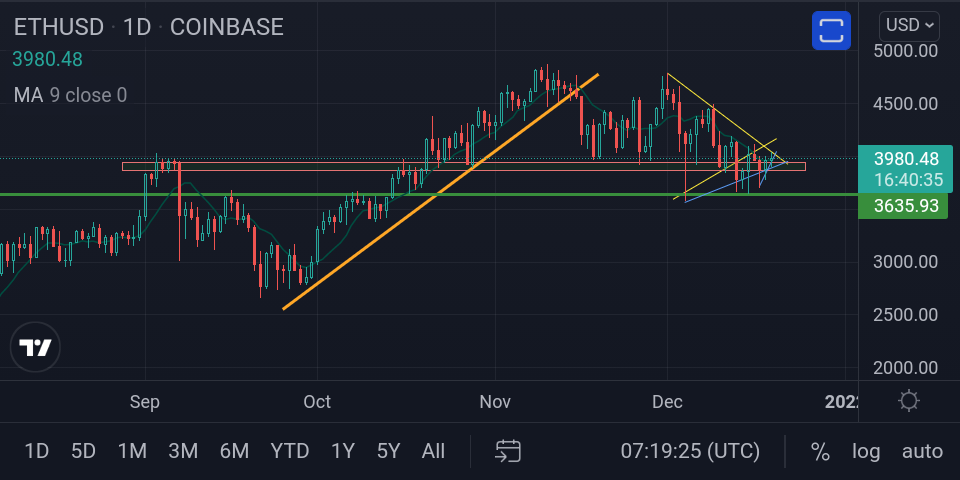
This is a continuation of Ethereum after cancelling it's trip to the moon for a relatively short period of time. And right now, we're quite sure that it's back to it's feet and ready to take the long bullish race ahead.
After some couple of analysis, it finally became clear that during those moments of ethereum being in a bearish state repeatedly for some time, It was actually forming a support trend line which will be able to aid it's new bullish increase.
Not only did we found a trend line on the 1 Day timeframe, but we also found another one in the smaller time frames like the 1 hour timeframe which we're going to use for a more indepth view of what's happening on Ethereum's chart.
1 Hour Timeframe.
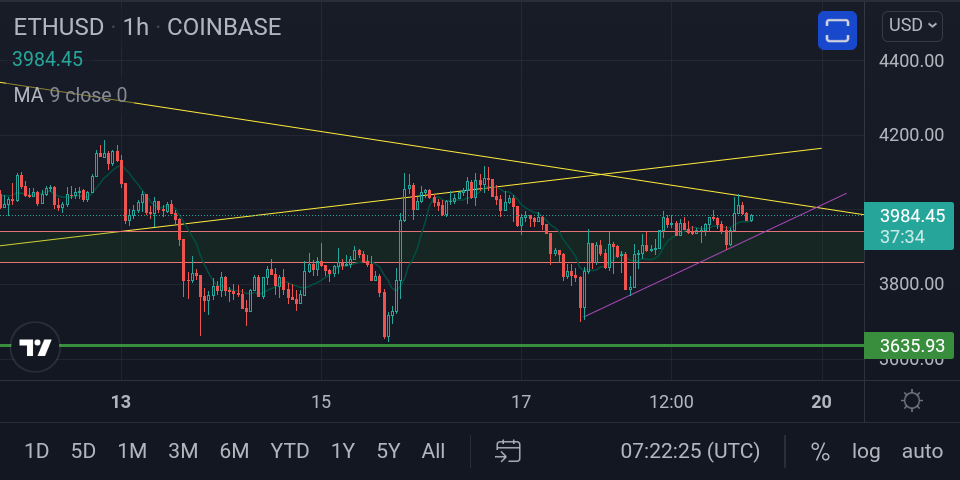
Using the 1 hour timeframe, we can then clearly see the two trend lines formed on Ethereum chart which are both acting as a support zone to further aid the bullish movement of Ethereum's price.
The first trend line was formed following the breakout which occurred earlier and brought about some bearish movement for a short period of time. The support trend line further helped in directing the candlesticks to a bullish area.
As for the second trend line which also acts as a support zone but for the candlestick that's currently developing. Hopefully, things keep on going well for Ethereum.
And to top it up, don't forget the key level which also acts as support zone.
`Overall: Currently expecting a bullish movement soon.`
https://read.cash/@InvestorOmar/update-bch-today-crypto-to-the-moon-fc174d06
*https://read.cash/@InvestorOmar/update-free-bitcoin-cash-chart-analysis-bch-to-the-moon-3cbb7e90*
`Peace.`
***🔼Care for a sponsor? Trust me, I'm sure you can do it.***
Update; BCH Getting Close To The Bullish Run Everyday.
`DISCLAIMER: I am not a financial advisor nor certified analyst. All contents discussed on this blogpost are solely my own personal views and for Trading education/entertainment purposes only . Do your own research and due diligence.`
With that being said, let's go into it.
1 week Timeframe
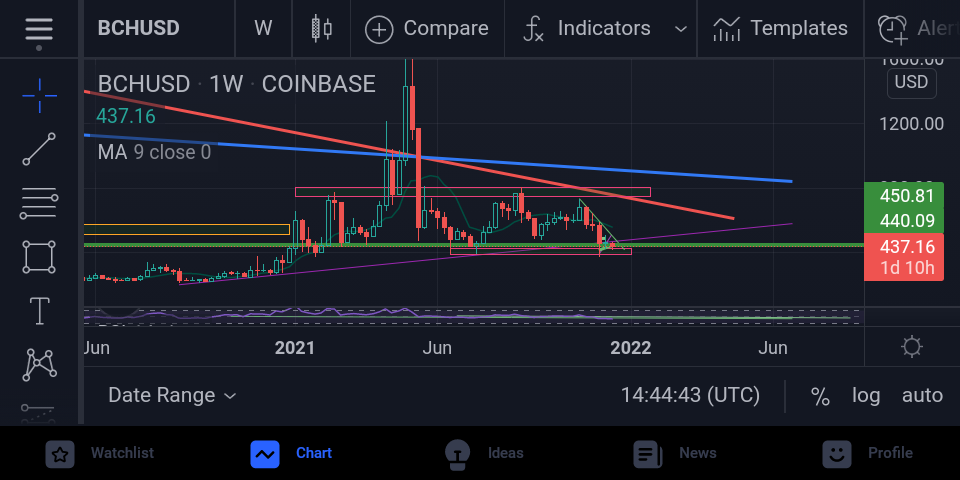
In the above analysis, we're using the 1 week timeframe in order to get a broad and brief view on what's happening on BCH. Not to worry, I'll be getting into it further, using the 1 Day timeframe.
Using the 1 Week analysis, we'll see the candlesticks lying patiently on the support and key levels respectively. Though this is a good sign if everything goes and plays along well. One of the major thing we don't want to happen is; For the candlesticks to end up closing below the support and key levels as this might give rise to a bearish movement especially if it occurs on the bigger time frames. But as usual; So far, So good.
1 Day Timeframe
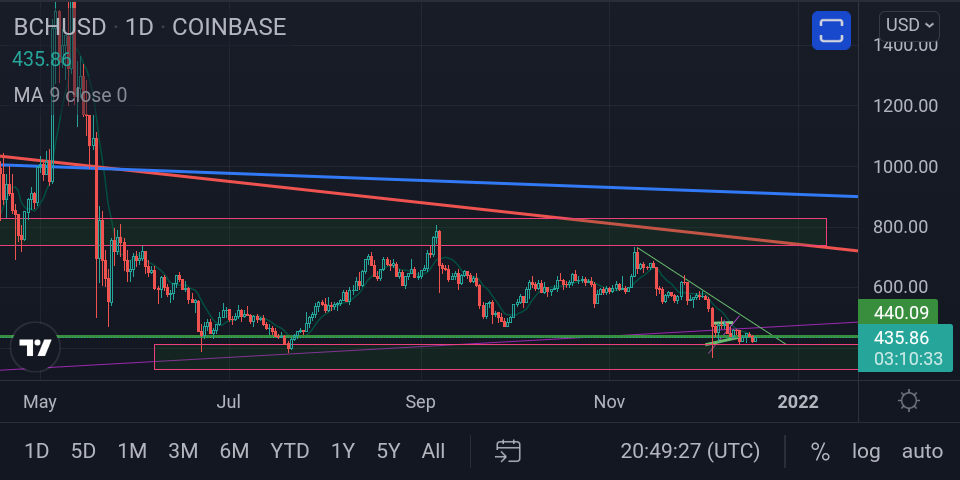
Now, the 1 Day timeframe helps us elaborate and gives us a much in depth view with what's happening to BCH as you can clearly see on the analysis.
So, what the chart is telling us is quite simple but yet still very important. At some point, it shows us the ranging pattern of which occurred as there art multiple retest on both the key level and support zone. We're kinda still on the support zone though and expecting some bullish increase.
Not only is there a ranging pattern, but also most importantly, is the trendine formed. And as it is, we've come really close to the end of this trend line and all we need is just a breakout in the top or upper part of this trend line.
By the way, there's quite a chance of this happening which then translate to a bullish movement since we're already close to the end of the trend line and we're still at the support zone. Keep Your Hopes High.
`Overall: Expecting some bullish movement in a matter of time after a breakout of the trend line.`
https://read.cash/@InvestorOmar/update-bch-today-crypto-to-the-moon-fc174d06
*https://read.cash/@InvestorOmar/update-free-bitcoin-cash-chart-analysis-bch-to-the-moon-3cbb7e90*
`Until next time, Peace.`
***🔼Care for a sponsor? come on, I know you can :) Thanks By The Way ;)***
Ethereum; Cancelled Trip To The Moon?
`DISCLAIMER: I am not a financial advisor nor certified analyst. All contents discussed on this blogpost are solely my own personal views and for Trading education/entertainment purposes only . Do your own research and due diligence.`
With that being said, let's get into it;
Now, I know the title might actually sound funny. Ever heard a crypto canceling trip to the moon? Well, guess what, Ethereum might just be on the verge of cancelling it's trip to the moon but hopefully for a short time:)
Using my analysis, if you're keeping up with my analysis, some couple of days ago, I made an analysis on Ethereum and BCH, but today we're focusing on Ethereum.
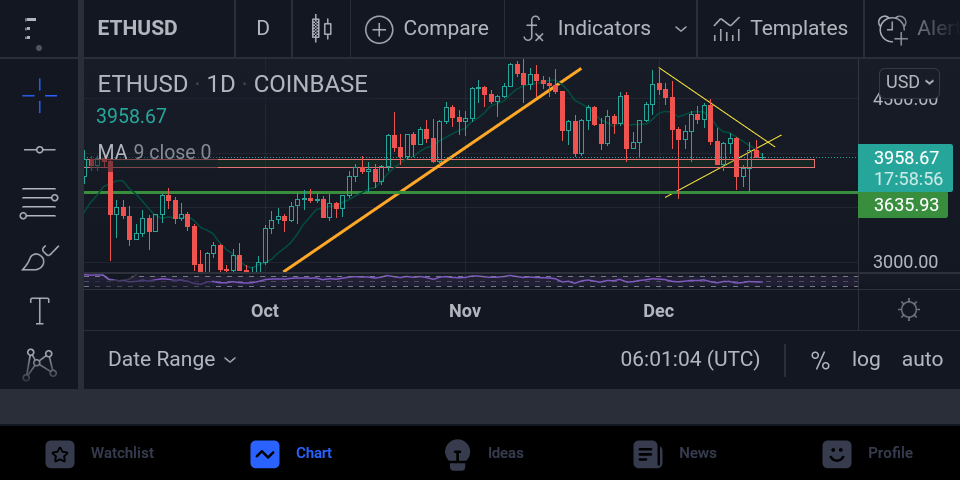
The reason behind the taught of a possible bearish movement on ethereum is simply because of the breakout on the bottom or lower part of the symmetrical triangle formed in my last article or analysis. So, in my last analysis on ethereum, I mentioned about the possible chances of a bullish movement if there was to be a breakout on the top side, but unfortunately, it didn't happen that way.
If you're to look closely at the chart, you'll see the clear, break out in the symmetrical triangle. And not only did it break out, but it also had a retest on the lower trend line formed. But not to worry, there's a support zone nearby, hopefully it stops there.
The current price is about $3958.67 though there are possible chances of It dropping down to around $3635.93 .
`Overall: A short bearish movement for some time.`
https://read.cash/@InvestorOmar/update-bch-today-crypto-to-the-moon-fc174d06
*https://read.cash/@InvestorOmar/update-free-bitcoin-cash-chart-analysis-bch-to-the-moon-3cbb7e90*
`Bch update coming up hopefully later in the day. Until Next Time, Peace.`
Update; BCH Turning point; Crypto To The Moon.
`December 16,2021.`
DISCLAIMER: I am not a financial advisor nor certified analyst. All contents discussed on this blogpost are solely my own personal views and for Trading education/entertainment purposes only . Do your own research and due diligence.
With that being said, let's get into it.
BCH 1h Timeframe.
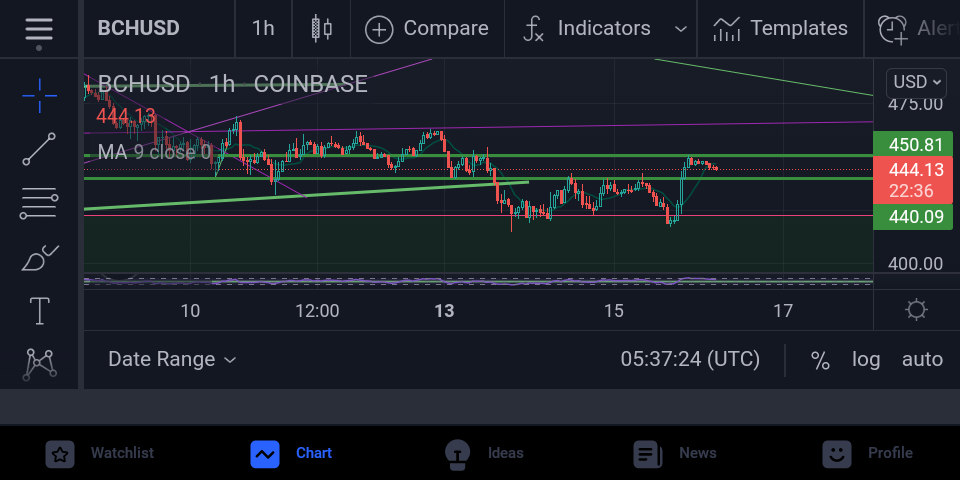
Today, we're currently up $444.13 as of writing his article from where we stopped yesterday.
The Zigzag pattern I was talking about yesterday, has finally being completed as the candlesticks reach for the nearest support area, just as I said earlier.
But currently, there has being a bullish movement after the candlesticks made it to the support area which brings us to where we are presently. As for now, we've reached a key level which acts as a resistant zone.
After reaching the key level which acts as a resistant level, were made to take some reversal or bearish movement back to the nearest key level.
`Overall: Hold on tight to your BCH. Adding some BCH might be a good idea.`
Previous 🔽
*https://read.cash/@InvestorOmar/update-bch-today-crypto-to-the-moon* https://read.cash/@InvestorOmar/update-bch-today-crypto-to-the-moon-fc174d06
`Until next time, peace.`
Update; BCH Today; Crypto To The Moon.
DISCLAIMER: I am not a financial advisor nor certified analyst. All contents discussed on this blogpost are solely my own personal views and for Trading education/entertainment purposes only . Do your own research and due diligence.
With that being said, let's get into it;
I was really happy after yesterday's analysis, after the initial bounce off in the support zone, which is pretty much a sign a good start if you ask me.
Today is simply just the continuation of the bounce off that took place yesterday. The candlesticks eventually did rise after the bounce off and I initially reached the nearest key level right above it and made a retest back to the supply zone and then back of to the supply zone. This is more of like a Zigzag pattern.
Well, I'll say we're definitely still good to go as we approach the end of this symmetrical triangle.
`overall: Hold on to your BCH tightly and maybe consider adding more to your portfolio.`
https://read.cash/@InvestorOmar/update-crypto-to-the-moon-bitcoin-cashbtc-12dfd928
https://read.cash/@InvestorOmar/update-free-bitcoin-cash-chart-analysis-bch-to-the-moon-3cbb7e90
`Peace`.
BCH Analysis predictions came right;Bullish Runs Ahead.
DISCLAIMER: I am not a financial advisor nor certified analyst. All contents discussed on this blogpost are solely my own personal views and for Trading education/entertainment purposes only . Do your own research and due diligence.
With that being said, let's get into it.
My analysis and predictions on BCH turned out to be more than correct. If you've been following up with my articles, you'll probably know the precise predictions I made using my analysis.
In my previous articles based on BCH analysis, I clearly stated that BCH would go on some little bearish run for a short period of time as it reaches for the nearest support area and that's exactly what happened. Currently, as of writing this article, it had just bounce of that support zone.
"Do you know what that means ?. It simply means : Get Ready For Some Bullish Run, as we we aim for the Moon.
Though our initial goal is to make it across that Symmetrical Triangle trend line formed. After a breakout, Then We're sure good to go.
**Overall: Buying extra BCH might be a good choice to consider.**
`If you enjoyed this article, and I know it makes you feel good, give it a thumbs up, and consider subscribing for more updates.`
*https://read.cash/@InvestorOmar/update-free-bitcoin-cash-chart-analysis-bch-to-the-moon-3cbb7e90*
*https://read.cash/@InvestorOmar/update-crypto-to-the-moon-bitcoin-cashbtc-12dfd928*
`I'm out, Peace.`
Crypto To The Moon; Free Trade Analysis; BCH,ETH....
DISCLAIMER: I am not a financial advisor nor certified analyst. All contents discussed on this blogpost are solely my own personal views and for Trading education/entertainment purposes only . Do your own research and due diligence.
With that being said, let's get into it. Firstly, let's start with Ethereum..
Ethereum Analysis.
Today, I chose to make some analysis on one of the most know and widely used crypto; ETHEREUM (ETH).
Ethereum is the most priced or expensive crypto right after the famous BITCOIN (BTC) which is currently priced approximately around $4000.
Ethereum has otherwise had a really Good Bullish run over the Years. But with it's Bullish run, comes it's High Gas Fees which has become quite a problem while transactions take place in the Ethereum network. Below are some analysis on this crypto:
1 Week Timeframe
With the above analysis, we can see how ETH has really rised right from the creche all the way up to where it is today, what a beautiful sight indeed.
At the time of making this analysis, it's current price is about $4020.67 as there are expectations of it rising even further.
There has been a major key level formed on the chart which brings hope of even more bullish movements as long as the candlesticks don't close below the key level which is around $4000.
1 Day Timeframe
On the 1 Day timeframe, there was beautiful trend line formed which leads to a breakout and then eventually multiple supports on the key level which brings us where we are today.
Not only was there a major support on the Key level but also a Symmetrical Triangle formed as we wait patiently for a breakout to occur, hopefully on the positive side.
BITCOIN CASH.
Bitcoin Cash, which is also referred to as "The Real Bitcoin" as it support's Peer-To-Peer transactions is undoubtedly a crypto with real potentials as it grows overtime. Though it's currently down a little bit, it will be wise for investors to consider investing into this great crypto as it is brought into awareness of the general public. Below is the analysis on BCH from where we stopped yesterday: *BCH Today; Crypto To The Moon; Trade Analysis.* https://read.cash/@InvestorOmar/bch-today-crypto-to-the-moon-trade-analysis-74c20fcf
1h Timeframe
At the moment of writing this article, BCH's current price is about $452.78 after having an astonishing rise but just a little bit above the nearest key level which can definitely act as a resistance a further more, causing it to retrace back to the nearest supply zone befi a massive bullish increase.
`I'll leave it here for now, until next time, peace.`
*https://read.cash/@InvestorOmar/update-free-bitcoin-cash-chart-analysis-bch-to-the-moon-3cbb7e90*
*https://read.cash/@InvestorOmar/update-crypto-to-the-moon-bitcoin-cashbtc-12dfd928*
`Don't Forget To Give A Thumbs up. Thanks`!
BCH Today; Crypto To The Moon; Trade Analysis.
DISCLAIMER: I am not a financial advisor nor certified analyst. All contents discussed on this blogpost are solely my own personal views and for Trading education/entertainment purposes only . Do your own research and due diligence.
With that being said, let's get into it.
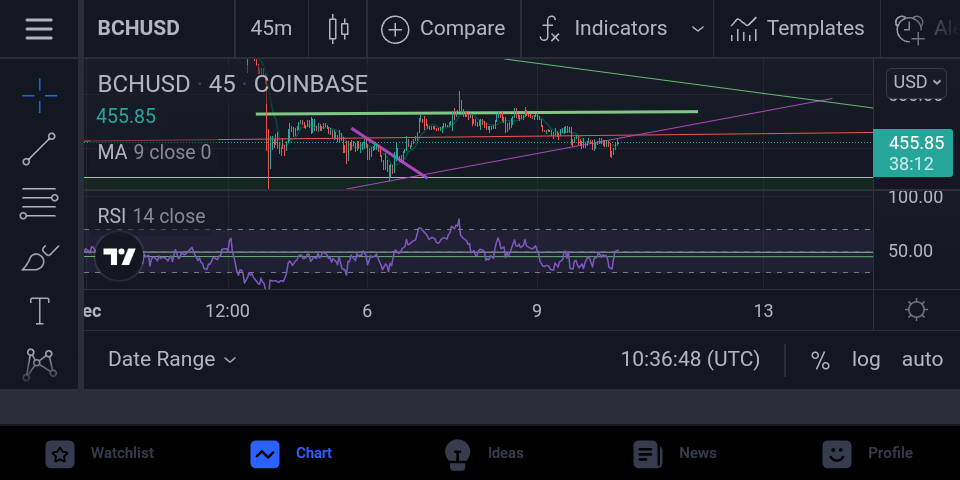
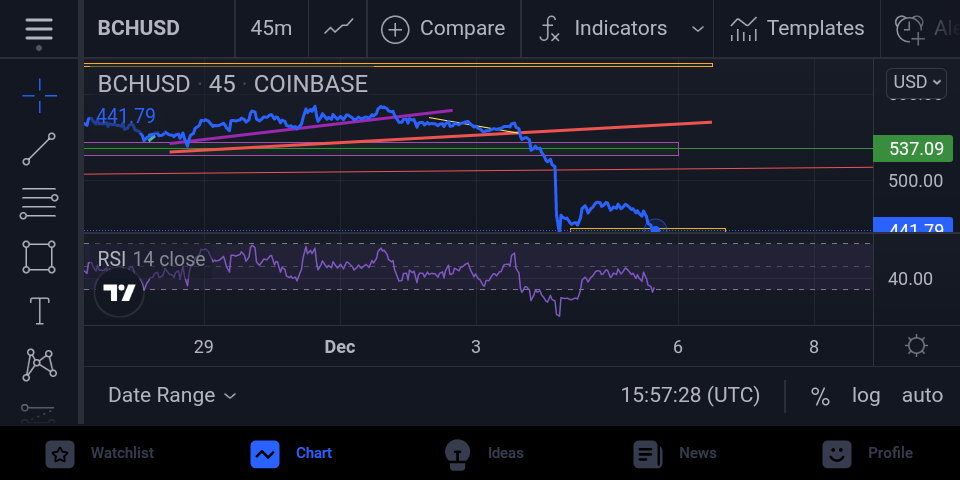
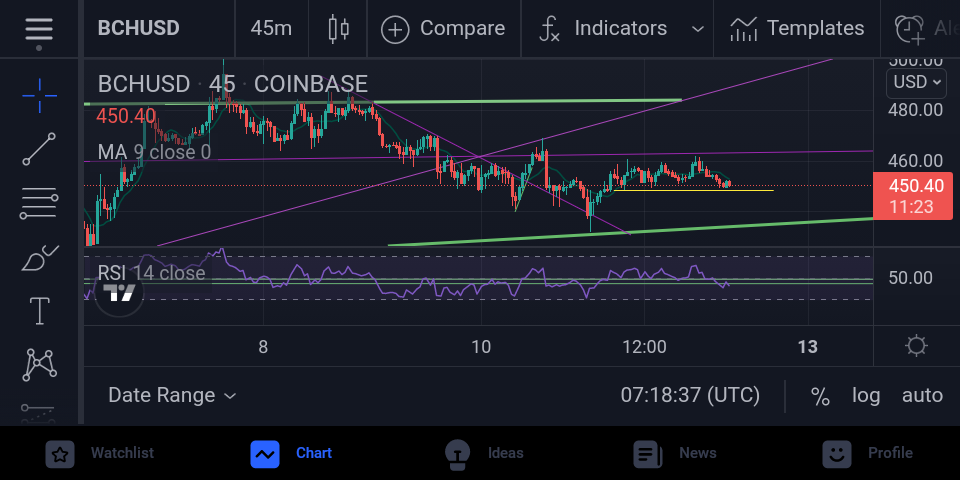
Using the 45m timeframe in today's analysis, the candlesticks seems to be in a ranging formation today after some couple of retracing in both trend lines formed ( up and down) with their respective colours; Purple for the up and Yellow for the down.
What I should be expecting from this formation is a short term bearish run right back to the major support area or zone.
Also, above the candlestick currently formed is the Moving Average which can also act as a Resistance point in most cases.
Overall: Some short term bearish movement before bouncing off the support zone.
https://read.cash/@InvestorOmar/update-free-bitcoin-cash-chart-analysis-bch-to-the-moon-3cbb7e90
https://read.cash/@InvestorOmar/update-crypto-to-the-moon-bitcoin-cashbtc-12dfd928
***Peace***.

BCH Analysis; Crypto To The Moon; + Free NFT Airdrop.
DISCLAIMER: I am not a financial advisor nor certified analyst. All contents discussed on this blogpost are solely my own personal views and for Trading education/entertainment purposes only . Do your own research and due diligence.
with that being said, let's get into it
1 Day Timeframe.
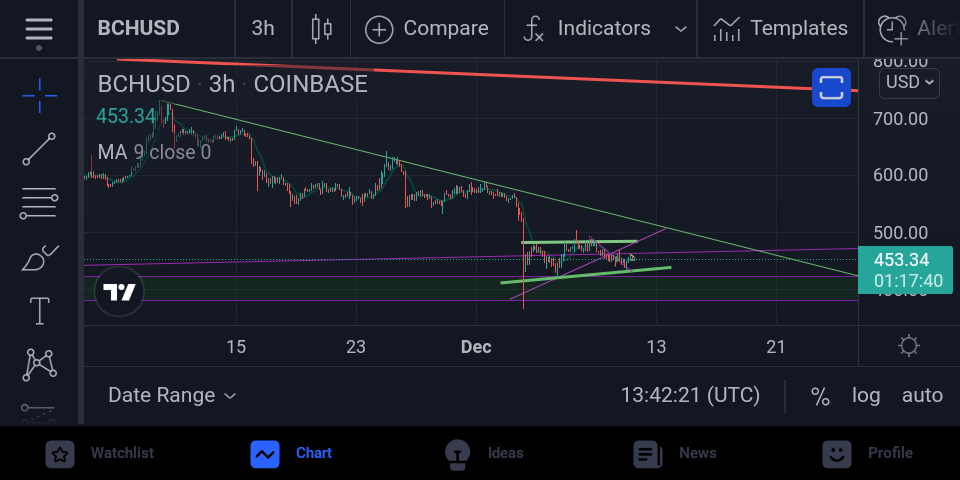
Using the 1 Day timeframe, you'll see a trend line been formed. And also, looking closer you'll be able to spot a little wedge been formed. To get a clearer view, use the smaller time frames available such as the 3hours, 45minutes, and so on. Above the wedge is the trend line which can support a bullish movement if it eventually turns to a support zone.
3 Hours Timeframe.
On using the 3H timeframe, you'll get an even clearer view on the formed trend line and also the wedge that's about to break out and eventually bounce off the trend line and continue a bullish run.
Get some exclusive NFTs now🔽🔽
*https://doodletoken.digital/?ref=0x82A2571BcC2FD815eA681A26e79a541373cf2718*
***Peace***.
Bch, Today's analysis; Outcome.
DISCLAIMER: I am not a financial advisor nor certified analyst. All contents discussed on this blogpost are solely my own personal views and for Trading education/entertainment purposes only . Do your own research and due diligence.
On my last article, I wrote on Bch being bearish or undergoing a bearish trend after a breakout from a triangle and also a retrace back to the purple resistant zone. Which it did certainly.
Presently, I'm spotting a Head and shoulder formation.
In a Head and shoulder formation, there are tripple tops with the middle one being more longer than the two opposite tops.
A common thing to expect in this formation is a proper retraced candlestick, which will go all the way to the support zone.
Overall: some bearish movements but hold on tight to your Bch.
https://read.cash/@InvestorOmar/update-free-bitcoin-cash-chart-analysis-bch-to-the-moon-3cbb7e90
https://read.cash/@InvestorOmar/update-crypto-to-the-moon-bitcoin-cashbtc-12dfd928
*peace*.

BCH Update; Crypto To The Moon; Free Technical Analysis.
DISCLAIMER: I am not a financial advisor nor certified analyst. All contents discussed on this blogpost are solely my own personal views and for Trading education/entertainment purposes only . Do your own research and due diligence.
With that being said, let's get into it
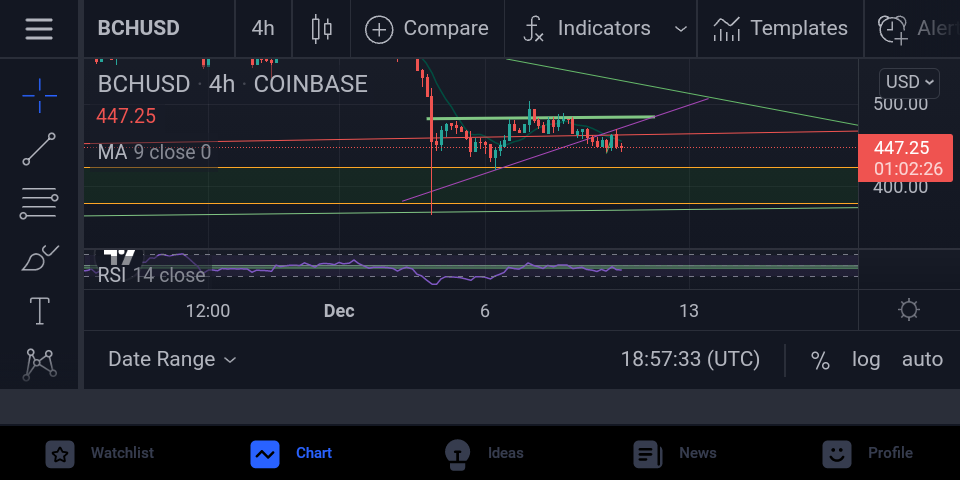
In my last article, I talked about the formation of a triangle in various Bch time-frames. And one of them was the 45m timeframe. As expected, there's a break out in the formed triangle but this time in the lower part of the triangle which translates to a downward or bearish movement.
But thankfully,it might not last long since it's based on the 45m timeframe.
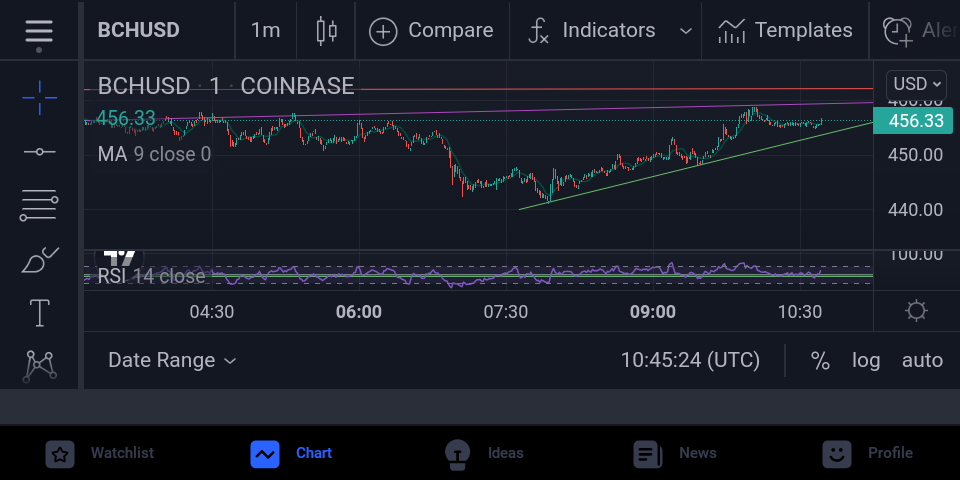
In the 1m timeframe, there have been multiple respecting of the purple trend line formed, that too after a breakout from the formed triangle.
This could lead to a short term bearish trend or movement.
Overall:Holding on tight to your Bch might just be the right thing to do.
https://read.cash/@InvestorOmar/update-free-bitcoin-cash-chart-analysis-bch-to-the-moon-3cbb7e90
https://read.cash/@InvestorOmar/update-crypto-to-the-moon-bitcoin-cashbtc-12dfd928
*Peace*.
Bitcoin,The Hacked cryptocurrency?
After much research, I've finally came to the realization that Bitcoin can't be Hacked as I totally agree with this article. What do you think? Feel free to comment on what you think.
Can Bitcoin be Hacked?
**If you are new to Bitcoin and know that it’s digital money that “lives” on the Internet, you may be wondering, “Can Bitcoin be hacked?”**
In this article, we will answer that question.
**Bitcoin and Security: Can the Bitcoin Network be Hacked?**
No, Bitcoin is considered hack-proof.
The reason why **it’s essentially impossible to hack the Bitcoin network is because of its decentralized nature that prevents the Bitcoin blockchain from having a single point of failure**.
Over 10,000 Bitcoin nodes across the globe verify transactions and dozens of bitcoin mining operations that secure the network by deploying their hash power.
To launch an attack on the Bitcoin blockchain, a hacker would have to acquire over 50% of the hash rate of the Bitcoin network. To achieve that, they would need to deploy more bitcoin mining machines than half the bitcoin mining industry, which is next to impossible given the economic investment that would be required.
Also, if an attacker were to launch what is known as a **51% attack** on the Bitcoin blockchain by acquiring over 50 percent of the network’s hash rate, the economic incentive would be not to hack the network – by creating double-spend transactions – as that would lead to a sharp drop in the value of bitcoin, which would financially hurt the attacker.
The Bitcoin network’s code is open-source, which means it has been reviewed by hundreds (if not thousands) of skilled developers from across the globe, and it’s regularly updated to make improvements. As a result, it’s extremely difficult for someone to find a vulnerability in the Bitcoin code that could affect the integrity of the network.
So Why Are There So Many Bitcoin Hacks?
While the Bitcoin network cannot really be hacked, your bitcoin wallet could be hacked if you are not careful when managing your bitcoin.
Most bitcoin wallet hacks targeting everyday users involve some form of social engineering, tricking users into unknowingly giving access to their bitcoin wallets. **Phishing scams** and **crypto-stealing malware** are the two biggest threats that bitcoin wallet users need to be aware of.
Phishing scams involve emails, messages, or phone calls that aim to trick you into giving away your bitcoin wallet login credentials and/or private keys. For example, you could receive a message on social media with a fake account claiming to be from a Bitcoin wallet Support Team saying that you need to provide your recovery phrase so that a tech issue can be fixed with your Bitcoin Wallet.
***Note: A bitcoin wallet will never ask you for your seed phrase***
**Crypto-stealing** icious software that could end up on your computer or mobile phone with the intention of capturing your bitcoin wallet’s login credentials and/or private keys. Avoid clicking on any attachments coming from unknown individuals or companies to prevent crypto malware from attacking your devices. Also, make sure you have up-to-date anti-virus software on your devices.
Though some networks can fall prey to notorious hackers out there if care is not taken. An example is the "POLY NETWORK" which suffered a hack of $600m. This is arguably referred to the biggest hack in history.
With that being said, Bitcoin can't be Hacked But Bitcoin wallets can.
`leave a comment on what you think of Bitcoin being hacked.`
Thanks for reading!!


BCH Today; Crypto To The Moon; Free Trade analysis.
DISCLAIMER: I am not a financial advisor nor certified analyst. All contents discussed on this blogpost are solely my own personal views and for Trading education/entertainment purposes only . Do your own research and due diligence.
with that being said, let's get into it.
Just as I said earlier on my last article, Bch is moving in a pattern which forms a triangle structure. Usually when we see this structure being formed, it is simply telling you to expect some major changes be it positive or negative (bullish or bearish) at the end of the formed structure.
Looking at the chart and analyzing it, the candlesticks are presently forming that triangle like structure slowly but steadily moving towards the up side 📈. well, so far so good, as usual be expecting some bullish movements any time soon.
The RSI Indicator isn't showing any reliable signals for now.
**HOLD ON TO YOUR BCH.**
***Until next time, peace.***
https://read.cash/@InvestorOmar/update-free-bitcoin-cash-chart-analysis-bch-to-the-moon-3cbb7e90
https://read.cash/@InvestorOmar/update-crypto-to-the-moon-bitcoin-cashbtc-12dfd928
Bitcoin Cash update;Free Trade Analysis; Crypto To The Moon;
DISCLAIMER: I am not a financial advisor nor certified analyst. All contents discussed on this blogpost are solely my own personal views and for Trading education/entertainment purposes only . Do your own research and due diligence.
with that being said, let's get into it
The 45m Timeframe
After a breakout and a retest, using my analysis, Bitcoin Cash has formed a new structure to some extent ranging and also definitely a triangle as we wait patiently to slowly retest back to to the long purple trend line formed. After a retest, we'll then be expecting some bullish movement as it gets closer to the end of the triangle which will eventually break out and continue a bullish movement.
There are high chances of this happening after my analysis on the 1 Month Timeframe.(scroll down to the last time frame for the 1 Month timeframe).
The 4H Timeframe
Using The 4h timeframe, we'll see a more clearer picture of the soon ending triangle formation which we can account for a bullish movement.
**Before this will be happening, we're still waiting patiently for the rest on the purple trend line on the 4h timeframe. And Finally..**
The 1 Month Timeframe
Using the 1 Month Timeframe, the Big Bearish Candlestick that was formed earlier which made us go into a dip,is now closing up, which is definitely a good thing. But what we want is for the candle stick to close inside the formed triangle and not outside it. Reason being that it closing inside of the triangle makes a bullish movement even more possible. And most importantly, this is the 1 Month timeframe where I'll say "*the candle movements are expensive".*
Chances are it will go in our favor since it already started to close up.
Feel free to comment on what you think about the current price of BCH.
https://read.cash/@InvestorOmar/update-free-bitcoin-cash-chart-analysis-bch-to-the-moon-3cbb7e90
*https://read.cash/@InvestorOmar/update-crypto-to-the-moon-bitcoin-cashbtc-12dfd928*
Peace.
Bitcoin Cash Update; Crypto To The Moon; Free Trade analysis.
DISCLAIMER: I am not a financial advisor nor certified analyst. All contents discussed on this blogpost are solely my own personal views and for Trading education/entertainment purposes only . Do your own research and due diligence.
With that being said, let's get into it
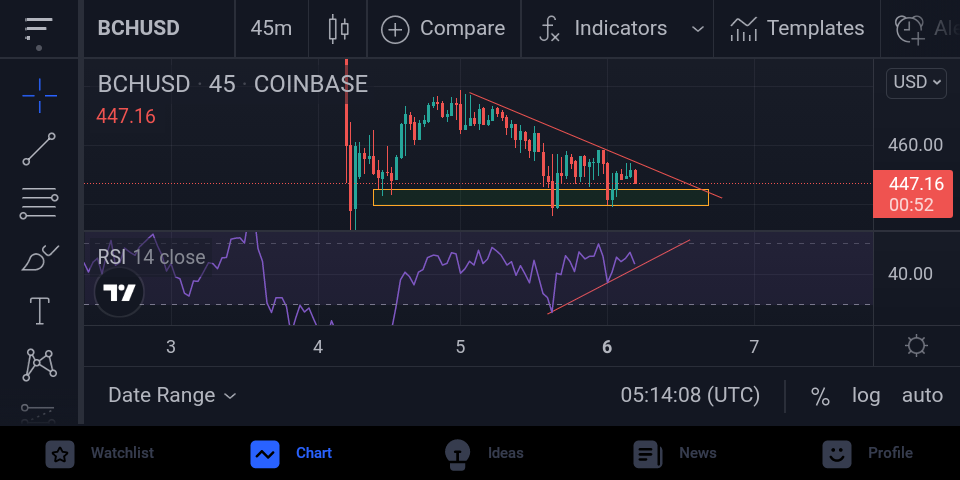
Bitcoin Cash has made some movements which brings about a very much possible bullish movement for the day. 1 BCH currently cost approximately $447.16 at the time of writing this post as I expect it to cost even more as the day goes by.
I used the 45M chart timeframe for my analysis which shows me a Descending Triangle which is likely going to bring about a bullish movement as there's a high chance of it breaking out of the triangle in a bullish area hopefully.
Using the RSI, a trend line was formed as we patiently wait for it to retrace back to the trend line and then take a positive turn.
Final Thoughts:
Hold on tight to your BCH.
https://read.cash/@InvestorOmar/update-crypto-to-the-moon-bitcoin-cashbtc-12dfd928
https://read.cash/@InvestorOmar/update-free-bitcoin-cash-chart-analysis-bch-to-the-moon-3cbb7e90
*until next time, peace.*

Bitcoin Cash Analysis; Crypto To The Moon.
DISCLAIMER: I am not a financial advisor nor certified analyst. All contents discussed on this blogpost are solely my own personal views and for Trading education/entertainment purposes only . Do your own research and due diligence.
With that being said, let's get into it.
BCH On The 45M Timeframe
Bitcoin cash is currently recovering from the unexpected crash we experienced yesterday.
Though after some little increase in price, It eventually drop again but this time not as much as the crash we experienced yesterday.
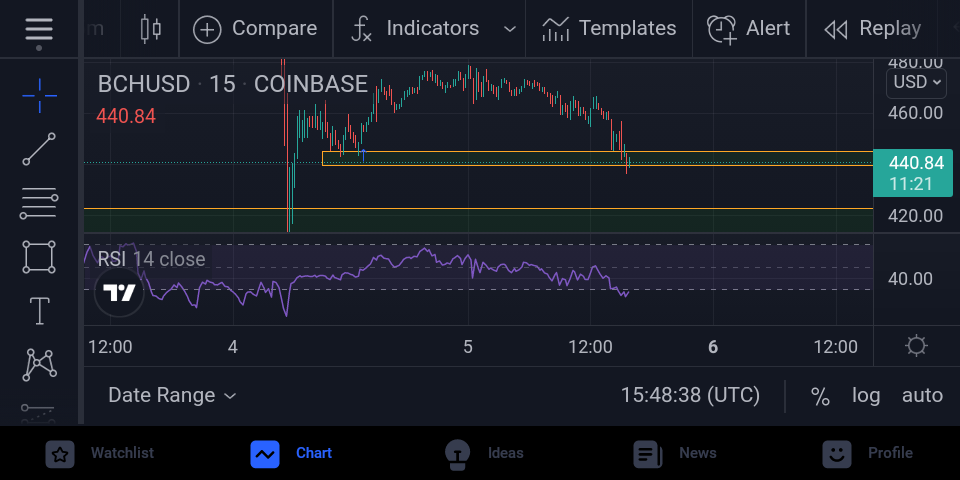
In today's analysis, the candlesticks have made it back to the support level at around the price of $442.40 respectively.
Not only is there a bounce off at the support zone but also, using RSI, we can clearly see it reaching the oversold region. This interprets to a new turn in market trend towards a bullish trend.
What do you think about the current state of BCH? feel free to comment below.
*https://read.cash/@InvestorOmar/update-free-bitcoin-cash-chart-analysis-bch-to-the-moon-3cbb7e90*
*https://read.cash/@InvestorOmar/update-crypto-to-the-moon-bitcoin-cashbtc-12dfd928*
This is the moment; Buy The Dip; Bitcoin Cash.
DISCLAIMER: I am not a financial advisor nor certified analyst. All contents discussed on this blogpost are solely my own personal views and for Trading education/entertainment purposes only . Do your own research and due diligence.
Bch 1 Month Timeframe
As I had previously stated in my past blogspot on my analysis on Bch going bearish, Well this is it happening right now.
My best advice to you right now is definitely not to panic sell your Bch at a low price. But instead be expecting it to go bullish after retesting or reaching the supply zone which it has.
I would advise you not to panic sell. Instead, Buying the dip might just be the best idea.
https://read.cash/@InvestorOmar/update-free-bitcoin-cash-chart-analysis-bch-to-the-moon-3cbb7e90
https://read.cash/@InvestorOmar/update-crypto-to-the-moon-bitcoin-cashbtc-12dfd928
Bitcoin Cash Update; Free trade analysis.
DISCLAIMER: I am not a financial advisor nor certified analyst. All contents discussed on this blogpost are solely my own personal views and for Trading education/entertainment purposes only . Do your own research and due diligence.
BCH analysis; December 3.
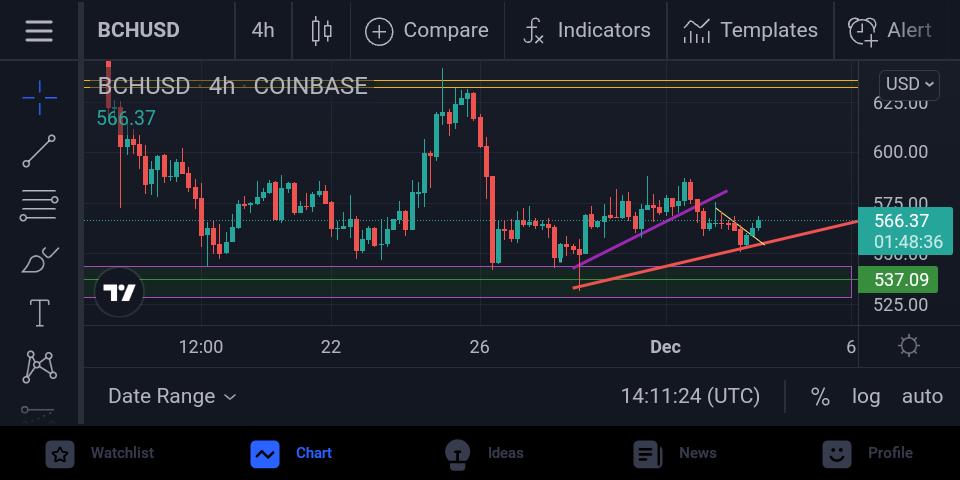
Today, we're up $566.37 on BCH. Just as expected, BCH was definitely going on a bullish movement and this right here might just be the turning point of BCH as it moves the moon.
With my analysis,it clearly shows that BCH has bounced of a trend line as usual which made it start trending the opposite direction which is Bullish. Hopefully it continues this way up to $2000.
Before the Bullish movement,there was recently a break out from a previous trend line created.
Hope you guys stick around as we rise on BCH. If you have a crypto in mind, feel free to drop it and I'll see to it that I make a clear analysis.
https://read.cash/@InvestorOmar/update-free-bitcoin-cash-chart-analysis-bch-to-the-moon-3cbb7e90
https://read.cash/@InvestorOmar/update-crypto-to-the-moon-bitcoin-cashbtc-12dfd928
Until next time, Peace.
Update Bitcoin Cash; BCH To The Moon: BCH* buy the dip?..
DISCLAIMER: I am not a financial advisor nor certified analyst. All contents discussed on this blogpost are solely my own personal views and for Trading education/entertainment purposes only . Do your own research and due diligence.
With that being said, let's get into it
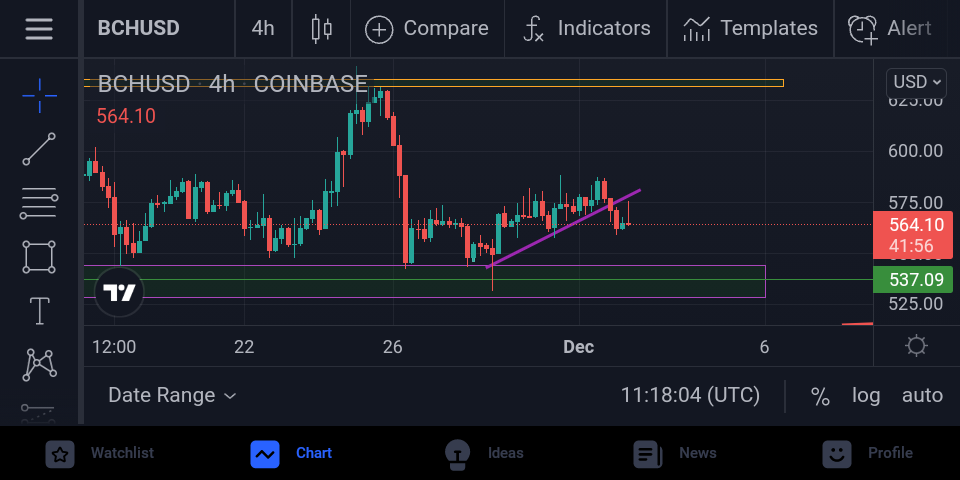
BCH 4H Timeframe
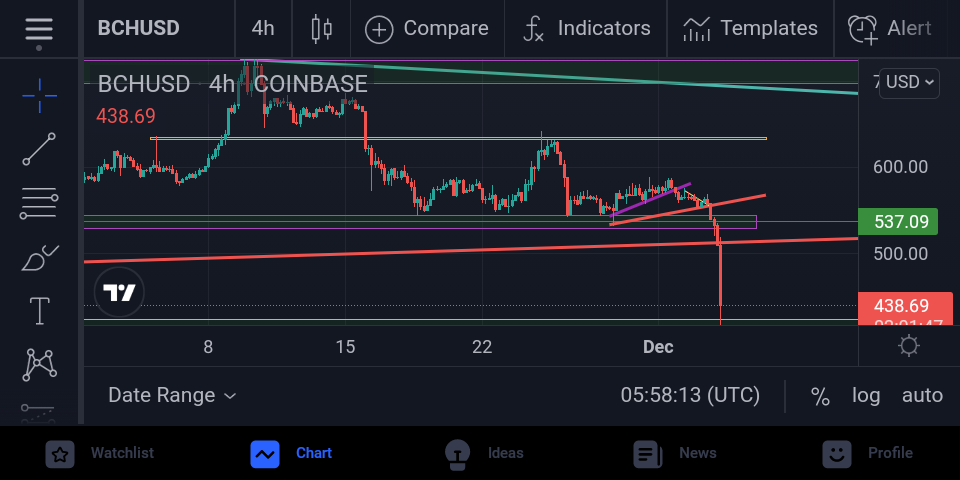
The above chart shows us the BCH 4H timeframe. After my analysis on BCH, I've finally came to know the reason why Bitcoin cash's price is being bearish those days using my chart analysis.
Bch is being bearish for sometime now but that does not relates to it's overall overwhelming and outstanding future. Bch has been Bearish after crossing the trend line it created for sometime now. It's not a wise idea to panic sell in situations like this.
Though BCH still has some bearish movement's to attain for a short period of time before it continues it's bullish run. Price is expected to fall to approximately $540.00 before appreciating.
Overall analysis: BCH, BUY THE DIP.
until next time, peace..
https://read.cash/@InvestorOmar/update-crypto-to-the-moon-bitcoin-cashbtc-12dfd928
https://read.cash/@InvestorOmar/update-free-bitcoin-cash-chart-analysis-bch-to-the-moon-3cbb7e90

Update; Free Bitcoin Cash chart analysis; BCH To The Moon.
DISCLAIMER:I am not a financial advisor nor certified analyst. All contents discussed on this blogpost are solely my own personal views and for Trading education /entertainment purposes only. Cryptocurrency Trading is extremely risky where losses can exceed deposits. Do your own research and due diligence. The basis of this trading analysis is purely technical in nature.
with that being said, let's get into It
1 Day Timeframe
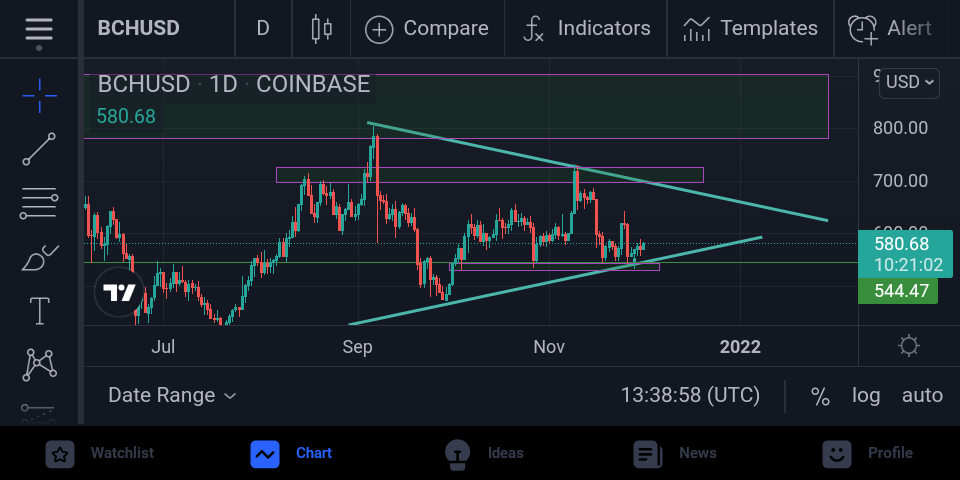
BCH on the 1 day timeframe has reached the support zone and as expected bounce of towards a positive movement. This indicates a good and bullish movement. we are currently up $580.68.
4 Hour Timeframe
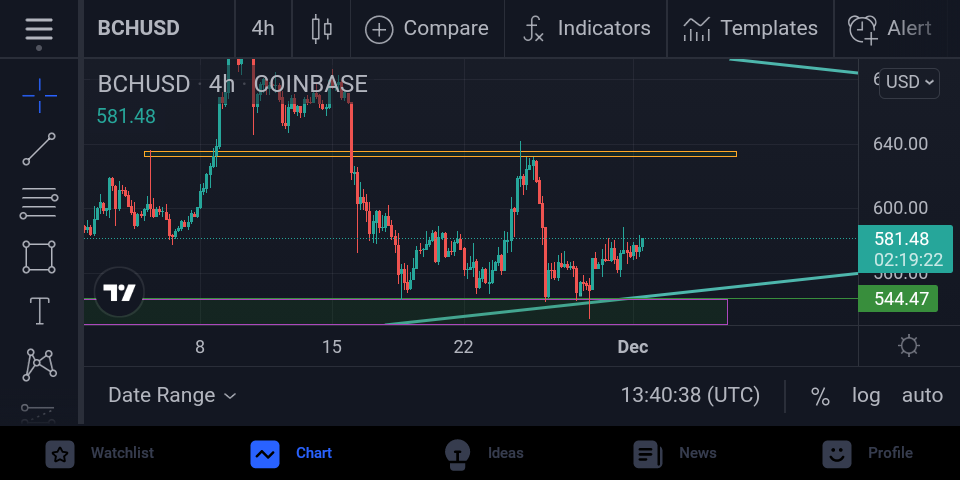
On the 4 Hour timeframe, There had also been a bounce of at the support zone But this time, There's a newly established resistance zone which the candlesticks are gradually heading towards for a profitable price movement.
1 Hour Timeframe
The 1 Hour timeframe indicates that the current candlesticks are moving in an Upward bullish ranging system Though there Is eventually going to be a resistance zone initially as it rises.
15 Minutes Timeframe
The 15 minutes timeframe show's us the candlesticks bouncing occasionally on the support line. And also, It constantly respect's the resistance zone. Though there seem to be a break out on the resistance line which could further lead to a bullish movement.
Overall Market Analysis: BULLISH 📈
Don't forget to comment on what you think about BCH price movement.
*peace*..
Update; Crypto To The Moon: Bitcoin cash,BTC,...
DISCLAIMER: I am not a financial advisor nor certified analyst. All contents discussed on this blogpost are solely my own personal views and for Trading education/entertainment purposes only.
with that being said, let's get into it:
BCH Analysis
BCH has had some crashes, just as the general cryptocurrency market crashed some months back. But that doesn't mean you should panic sell BÇH at any cost.
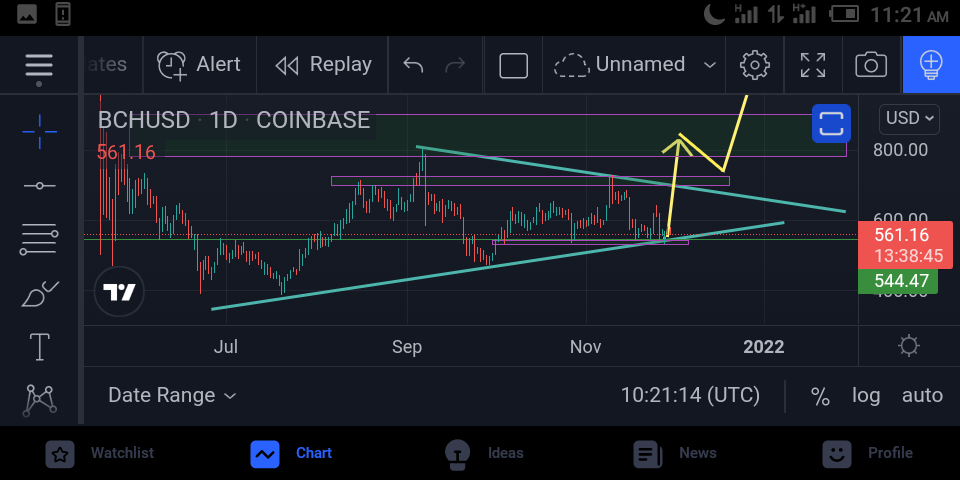
As you can see in my analysis, as of September, BCH had already reached an outstanding price of approximately $800 per BCH. But within a given time, it fell reaching the new support zone. This was after reaching it's Resistant zone respectively.
But in no time, it got back up again and this time with higher chances of reaching a new all time high of $2000 per BCH. But always remember, The patient ones are the ones to get the profits (HODL). Have Faith in BCH and Hold on tight as we Rise To The Moon.
*HODL SHOULD BE A GOOD IDEA*
BTC Analysis
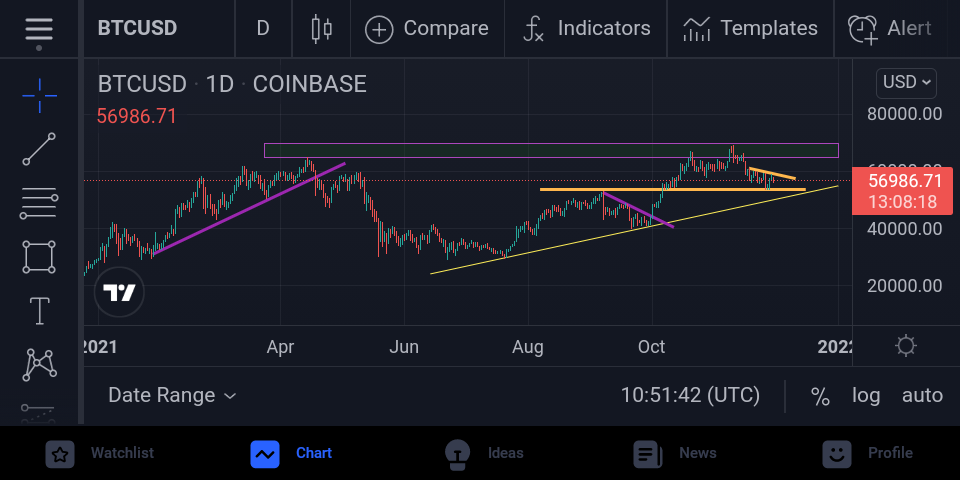
This is just a brief analysis of Bitcoin (BTC) with it experiencing it's high peak on April which drastically dropped some couple of months later, after breaking out from a support trend line it created.
But as usual, it got up back again and this time creating a new all-time-high on November which once again is it's resistance zone and it had a small decline down to $56986.71 which is it's current price as of writing this blogspot.
Feel free to comment about what you think on both BCH and BTC movements in the nearest future.
*Thanks for reading!*
 @InvestorOmar