Bitcoin Analysis; Free Trade Analysis; Crypto To The Moon #53. DISCLAIMER: I am not a financial advisor nor certified analyst. All contents discussed on this blogpost are solely my own personal views and for Trading education/entertainment purposes only . Do your own research and due diligence. Without further delay, let's get into it; BTC 4h Timeframe
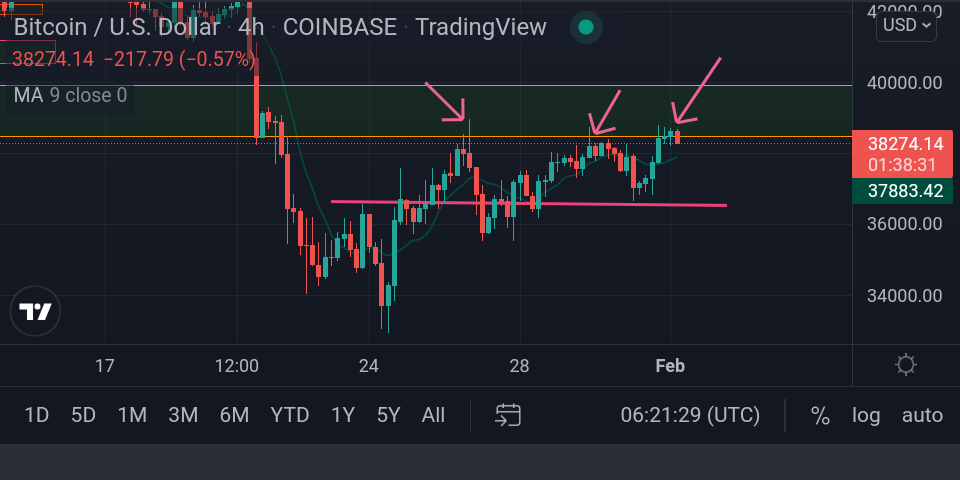
You might have all noticed, that BTC has increased in price those previous days that have went by. That nice feeling of finally seeing your portfolio increasing. Anyways, there are nevertheless still chances of the price of BTC dropping again unfortunately. After some retest on a key level, we finally got some increase in price. During this process, we have also retested a resistance zone multiple times as we experience a little drop in price each time we retested on the resistance zone. As of the time of making this analysis, we're still at the upper level after successfully reaching for the resistance zone and we already started the formation of a red or bearish candlestick. BTC 1w Timeframe

Using the 1w timeframe to get a broader look, there's definitely a bullish candlestick formed as we retest on the support zone. And after the formed bullish candlestick, we can also see a new bullish candle stick being formed, Hopefully it gets us to an even more bullish movement. But just above the formed bullish candlestick is the resistance zone. A retest can make us bearish again.

**Until Next Time, Peace.**
No comments yet