Author
Note
This is a dissertation submitted to Graduate School of Science and Technology, Computer Science and Electrical Engineering in Kumamoto University, Japan, on September 2020 in partial fulfillment of the requirements for the degree of Doctor of Philosophy but was not published thus the copyright remained with me "Fajar Purnama" the main author where I have the authority to repost anywhere and I claimed full responsibility detached from Kumamoto University. Except for contents marked with copyright (©), I hereby declare to license it as customized CC-BY-SA where you are also allowed to sell my contents but with a condition that you must mention that the free and open version is available here. In summary, the mention must contain the keyword "free" and "open" and the location such as the link to this content.
The presentation is available at Slide Share.
The source code is available at Github.
Declaration of Authorship
I, Fajar PURNAMA , declare that this thesis titled, “Development of a Lossy Online Mouse Tracking Method for Capturing User Interaction with Web Browser Content” and the work presented in it are my own. This thesis is based on few of my publications and I hereby confirmed that I have permission to reuse them:
For my journal paper titled "Implementation of real-time online mouse tracking on overseas quiz session" (Purnama et al., 2020b), the copyright was transferred to Springer Science+Business Media, LLC, part of Springer Nature but the authors and I have been granted full permission to reuse the accepted version of the journal paper.
For my journal paper titled "Using real-time online preprocessed mouse tracking for lower storage and transmission costs" (Purnama and Usagawa, 2020), is open access under creative commons (CC-BY) where anyone can reuse the whole material.
For my proceeding paper titled "Rsync and Rdiff implementation on Moodle’s backup and restore feature for course synchronization over the network" (Purnama, Usagawa, et al. 2016), the copyright was transferred to IEEE but the authors and I does not need formal permission to reuse the accepted version of the proceeding paper.
For my technical report titled "Incremental Synchronization Implementation on Survey using Hand Carry Server Raspberry Pi" (PURNAMA and USAGAWA 2017), the copyright was transferred to IEICE but the authors and I have been granted full permission to reuse the published version of the report paper (IEICE, 2015).
For my proceeding paper titled "Demonstration on Extending The Pageview Feature to Page Section Based: Towards Identifying Reading Patterns of Users" (Purnama, Fungai, and Usagawa 2016), the copyright was not transferred, thus the copyright remains with the authors.
More detailed information are available in Appendix B.
Abstract
Though people are confined inside their houses due to COVID-19, they are forced to continue their activities online. The demand for tools to monitor these activities increases for example, making sure students reads materials, and examiners does not cheat during online examinations. Unfortunately, conventional web logs cannot monitor those kinds of activities. One monitor tool is mouse tracking that tracks the actions of the mouse cursor that includes clicks, movements, and scrolls, which covers the majority of online users’ interaction to the browser contents. Though mouse tracking is promising, very few implemented this tool because (1) previous mouse tracking tools requires desktop installations which is bothersome to the users and (2) the rumors that mouse tracking generates big data such as the saying a swipe from left to right generates a megabyte of data. This thesis tackles those problem by building a mouse tracking server application that is easily installable and does not require users to install any additional applications other than the web browser. The application was implemented in an overseas quiz session between National University of Mongolia and Kumamoto University where the amount of data generated was also investigated. This thesis also contributes to a lossy online mouse tracking method that can greatly reduce the amount of data generated. Finally, some visualization of the mouse tracking data are shown and possible application such as online examination cheating prevention and force reading of term of service are discussed.
Acknowledgements
My first gratitude would be to my supervisor Prof. Tsuyoshi Usagawa for taking care of me for five years starting from my Master’s program until the end of my Doctoral program. His deeds are almost immeasurable because without him, Kumamoto University, and The Ministry of Education, Culture, Sports, Science and Technology Japan, my currently best five years of my life may not be possible. I would like to thank my reviewers Prof. Kohichi Ogata, Prof. Kenichi Sugitani, Prof. Masahiko Nishimoto, and Prof. Masayoshi Aritsugi for their time in reviewing this thesis. I greatly thank my friend Alvin Fungai as the co-founder for this topic where without him, the topic of this thesis would have been different and I may be late in finishing this thesis because I have tried doing other topics and found to be much more difficult or just does not suit me. The critical development phase of this research was thanks to the Computer Algorithm class by Prof. Masayoshi Aritsugi and all of the participating members that included Hendarmawan, Hamidullah Sokout, Alhafiz Akbar Maulana, and Sari Dewi where in those moments that I decided this topic as my Doctoral thesis. The implementation and data were thanks to Dr. Otgontsetseg Sukhbaatar, Prof. Lodoiravsal Choimaa, and the students in School of Engineering and Applied Sciences, National University of Mongolia where without them, this topic may not make it to two international journal publication and may prevent the completion of this thesis. Lastly, I would like to thank my mother Linawati, father Teddy Junianto, and Ni Nyoman Sri Indrawati for their daily support.
1 Introduction
1.1 Background
Thanks to the development of information communication technology (ICT), humanity lives in convenience. It is no longer necessary to spend much effort to seek information. Whereas in the past, people needs to travel to libraries to seek books, buy newspapers to get the latest news, gather in a community to hear the latest rumors, or even start a pilgrimage to find a master. Nowadays, most information are available in the Internet. With ownerships of portable computer devices that can connect to the Internet from anywhere becoming mainstream, anyone can search for their desired information (Dentzel, 2013).
The Internet is not only an open massive source of information where anyone can publish, but also a tool for distant activities. People can interact with each other without meeting through text, voice, or video messages regardless the time and place. More people do not go to shop but order items through online shopping. In some countries like Indonesia, they develop an application that can order variety of services online (Azzuhri et al., 2018) such as meal delivery service, calling house cleaners, calling therapist, etc.
Due to the recent COVID-19 pandemic that occurred early February 2020, most regions are in a lockdown where people are to stay away from each other (mostly asked to stay at home) to prevent the spread of infection. Even school closes, most governments around the world have temporarily closed educational institutions in an attempt to contain the spread of the COVID-19 pandemic (UNESCO, 2020). All forms of activities are recommended to be done online which includes educational activities where courses are switched from face to face to online. The basic of online course that is known today is materials provided online, online text discussion forum, a feature to submit assignments online, online quiz session, (Linawati, Wirastuti, and Sukadarmika, 2017) and the features to analyze and evaluate students' performance. For interactivity, people prefer to join live streaming videos, webinars, online game sessions, interactive online programming, etc.
Unfortunately, conventional web analytic does not measure up to how teachers examine or analyze students during face to face private tutors. Teachers normally able to examine students' attention, emotion, and motivation during studying in real-time, but conventional web analytic does not provide such features for online education. This reason is especially true for a very crucial educational activity which is examination. Security is very tight for face to face examinations to prevent dishonest behavior but this is not true for online examinations today. This is why most educational institute implements blended (Paturusi, Chisaki, and Usagawa, 2012) learning which is a mixed face to face course and online course than implementing full online course. This applies to anything online, not only with education, for example during shopping, shop owners are able to identify the interest of their customers face to face and act accordingly. The simplest example people can see whether someone is skimming or pay close attention during reading when face to face. In online reading, people normally cannot know whether the viewer is actually reading the materials or not. An example crucial demand is reading detection of agreements or terms of services. Most people scrolls down and accept the terms of services without actually reading them.
The lack of data for online analytic can actually be solved by eye tracking, mouse tracking, and all other online monitoring techniques in real-time. Although these techniques were introduced in the early 20th century, they are still rarely implemented. One of the main reasons is the huge data generated by these techniques which is too much for most administrators and analyzers to handle (Leiva and Huang, 2015). This connects to the next reason that the previous applications only suit academia and does not suit wide implementation. For eye tracking is that the hardware are intrusive where users usually have to wear googles. Though non-intrusive ones exists but they are most likely expensive. Mouse tracking are non-intrusive and no cost because in default they are available in every computer where no additional hardware is needed. However, the previous application are only suited in laboratory where they are installed offline in each computer and not online. This thesis tackles that problem.
1.2 Problem
There are almost no application to monitor crucial online activities such examinations.
Although there are rumors of huge data generated by mouse tracking, there are almost no facts and investigations.
The rumors already discourage mouse tracking application development for public development and today's most mouse tracking application are only suitable for academia and laboratories.
The huge data generated are inline to the resource required for implementation, thus methods for reducing data generation are necessary.
1.3 Objective
Create an online mouse tracking application that is easily implementable.
Investigate the data generated and resource usage of the online mouse tracking application.
Implement methods to reduce the data generated and resource usage of the online mouse tracking application.
Use mouse tracking data to capture users' interaction with the web browser content and design a monitoring tool for crucial online activities which are examinations and passage reading.
1.4 Hypothesis
This thesis proposes a new preprocessing based on demand method specifically for online mouse tracking. It is a method that allows the implementer to determine the data they need before implementation. Amongst those data, the geometrical data (x and y mouse coordinates) are the largest one generated. Most of the time, implementer do not need all the data. Therefore, the data generation along with resource usage can be reduced if they choose the region of interest beforehand. In summary, by summarizing the coordinates into areas, the data generated can be reduced which will also reduce the resource usage.
1.5 Contribution
Created an open source real-time online mouse tracking application that can be implemented on any website and browser.
Investigated the data generated and resource usage of the real-time online mouse tracking application.
A novel preprocessing based on demand method specifically for mouse tracking that reduces the data generation and resource usage.
Implemented the mouse tracking application online and obtained mouse tracking data.
Visualized the mouse tracking data and derive information which are usually underivable from conventional web logs and educational data.
Designed a possible software implementation for monitoring online reading and examination.
1.6 Benefit and Significance
Mouse tracking is one of the missing key for anything that are implemented fully online.
Anyone can benefit the open source real-time online mouse tracking application in this thesis to implement or further develop online mouse tracking.
The mouse tracking data generation and resource usage investigation can help companies and other parties to plan before implementing online mouse tracking.
The methods presented to reduce mouse tracking data generation and resource usage gives opportunity for people in limited connectivity area to utilize online mouse tracking.
1.7 Thesis Structure
Other than the introduction, this thesis contains four more chapters. The second chapter is online mouse tracking implementation and investigation where this chapter discusses the implementation of online mouse tracking in any website and browser, and the amount of data generated. The third chapter is online mouse tracking resource usage reduction methods where known methods, real-time implementation, and the novel method of preprocessing based on demand is discussed. The fourth chapter is the depth levels of web logs and educational data which emphasizes mouse tracking logs as deeper level data than conventional educational data logs. The last chapter is conclusion and future work.
2 Online Mouse Tracking Implementation and Investigation
2.1 System Overview
2.1.1 Mouse Tracking in Web Development
Mouse tracking is a method to record the mouse activities of the users. Mainly, it records the clicks, movements, and scrolls location illustrated in Figure 2.1. Mouse tracking can be developed on the desktop level or the application level. On the desktop level, mouse tracking tracks every mouse activities that occur on the desktop, while on the application level, mouse tracking only tracks activities in the application and will stop tracking when the mouse cursor leaves the application. In this thesis case, the application is the web where it is related to the browsers and websites. There are many programming languages such as C to develop desktop mouse tracking while to develop web based mouse tracking, web programming language such as JavaScript (JS) is used.
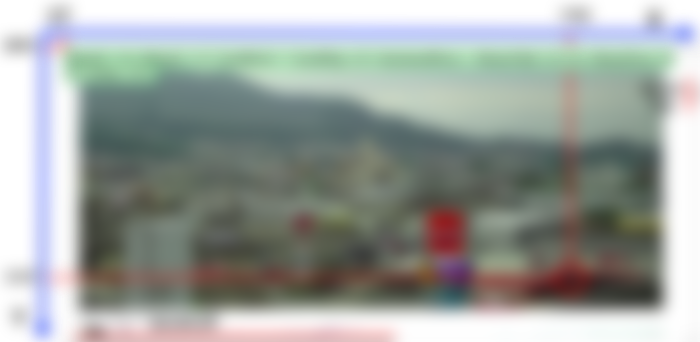
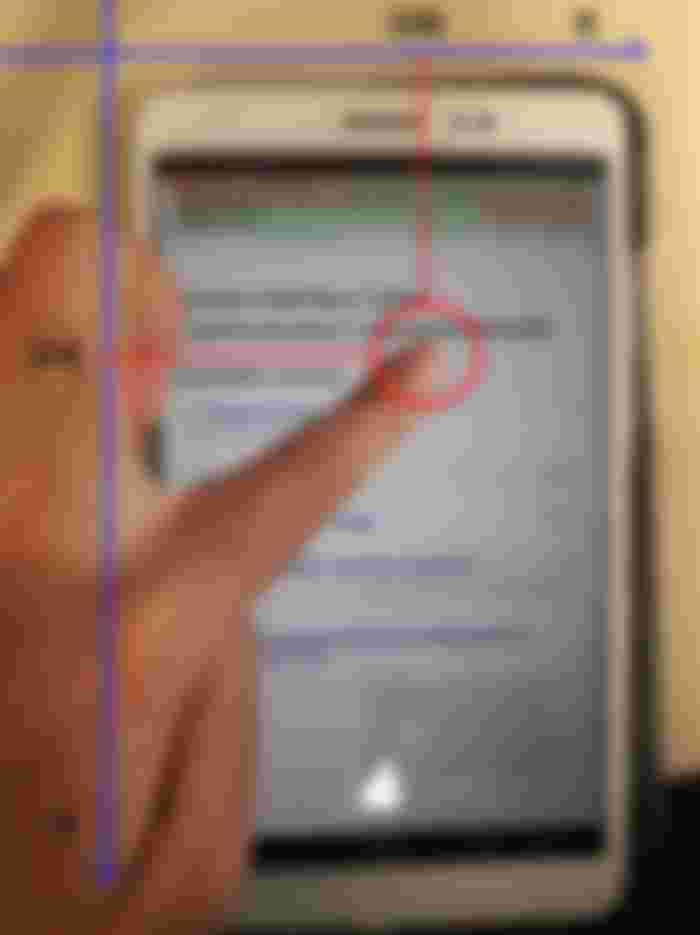

Figure 2.1 Mouse tracking illustration where the top image is from personal computer (PC) and bottom image is from smartphone tablet © (Purnama et al., 2020b). Both the image shows geometrical data (x and y coordinate) of the occurred mouse, scroll, and touch event, also which mouse button is clicked, how much percentage of zoom applied, and whether a keyboard is pressed.
The core of mouse tracking in web development is Domain Object Model (DOM) which is an Application Programming Interface (API) for Hypertext Markup Language (HTML) and Cross Markup Language (XML). It defines the logical structure of documents and the way a document is accessed and manipulated. Supposed a simple HTML page with the codes on Table 2.1, the DOM structure can be represented on Figure 2.2. With the Document Object Model, programmers can build documents, navigate their structure, and add, modify, or delete elements and content. Anything found in an HTML or XML document can be accessed, changed, deleted, or added using the Document Object Model, with a few exceptions. DOM is designed to be used with any programming language. Currently, it provides language bindings for Java and ECMAScript (an industry-standard scripting language based on JS and JScript) (Wood et al., 1998).
Table 2.1 A web page code in simple HTML that contains html, head, title, body, p, and footer tags (Purnama and Usagawa, 2020)
<html>
    <head>
        <title>Simple Webpage</title>
    </head>
    <body>
        <p>Hello World!</p>
    </body>
    <footer>
        <p>CC</p>
    </footer>
</html>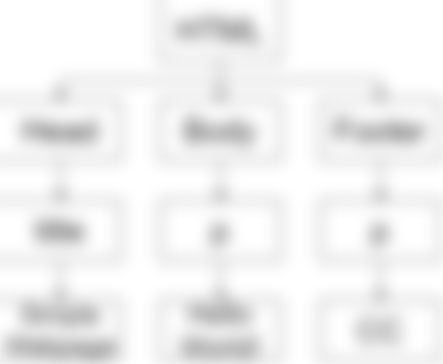
Figure 2.2 DOM representation of Table 2.1 (Purnama and Usagawa, 2020). The html tag is the parent with head, body, and footer tag as the children. Head has a child tag title, body has a child tag p, and footer has a child tag p.
The implementation of mouse tracking is based on DOM events, specifically mouse, touch, and User Interface (UI) events which are actions that occur as a result of the user's mouse actions or as a result of state change of the user interface or elements of a DOM tree (Pixley et al., 2000). In this thesis jQuery is used to access the DOM API and receive information that are related to mouse, touch, and UI events. The following list shows the mouse events utilized in this thesis:
Mousedown: when either one of the mouse buttons are pressed (usually left, middle, or right button)
Mouseup: when either pressed mouse buttons are released
Mousemove: when the mouse cursor moves
Mouseleave: when the mouse leaves an element (we only indicate when temporary leaving a webpage)
Mouseenter: when the mouse enters an element (we only indicate when temporary entering a webpage)
Scroll: when the webpage scrolls
Touchstart: when a computer device screen is touching
Touchend: when a touch from touchstart is removed
Touchmove: when a touch is moving
Touchcancel: when a touch is interrupted
Resize: when the webpage is zoomed in or out
There are many DOM events that are not implemented by the application in this thesis. However, they maybe implemented in the future if they are found to be useful. But for now, the following DOM events other than mouse events are worth considering and are implemented:
Beforeunload: when the webpage almost closes
Resize: when the webpage is zoomed in or out
keypress: when a keyboard is pressed
cut: when the user attempts to cut a content
copy: when the user attempts to copy a content
paste: when the user attempts to paste a content
dblclick: when a double click is performed
auxiliarymenu: when a right click menu is called
After implementing the DOM events, the information is processed by adding important labels. The first labels are time information such as the date of the received information and duration by calculating the difference between the current and previous received events. The second labels are the place information such as the category, page, post, course, course content, or if those information are not available then the default information is the Uniform Resource Locator (URL). More in-dept place information are the areas or sections of the page, and the deepest of them all are the coordinates of the page. The third label is the identity label if available and permitted such as the name, email address, ip address, and location of the user.
2.1.2 Online Mouse Tracking System
The author developed an online mouse tracking application implementable on any website where the code is open source on GitHub (Purnama, 2019). It is written in HTML, Cascading Style Sheets (CSS), JS, jQuery, and PHP. The mouse tracking code can either be implemented on client side shown on Figure 2.3 or server side shown on Figure 2.4. The difference is that the client side can capture anything including all the web page that the user visits while the server side can only capture the events that happen on the server's website.

Figure 2.3 Mouse Tracking Chrome extension © (Purnama et al., 2020b). The mouse tracking extension is visible on the extension bar. The user can open the configuration window by clicking the icon and configuration. the events (clicks, moves, scrolls) to record.
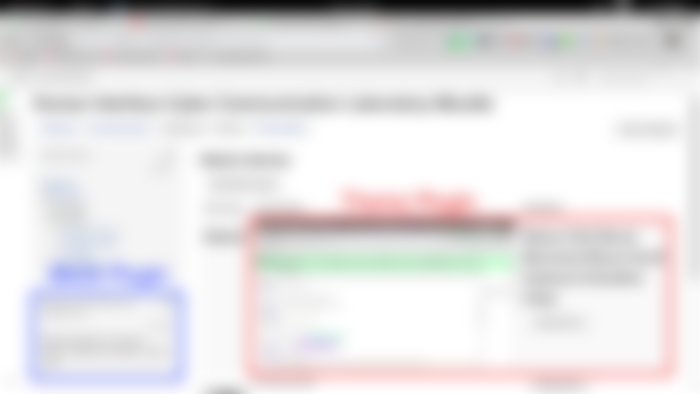
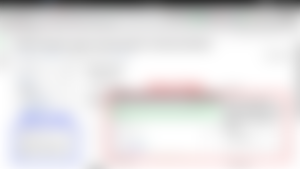
Figure 2.4 Mouse Tracking Plugin on Moodle © (Purnama et al., 2020b). The figure shows examples of mouse tracking implemented as a block plugin (in blue) and theme plugin (in red).
Figure 2.5 shows a more detailed server side implementation. The mouse, touch, and UI DOM events in the previous subsection are written in JS and jQuery and are placed on the representation side which is the website along with the HTML and CSS. The order the online mouse tracking in Figure 2.5 are:
The browser attempts to visit the website by requesting HTML, CSS, and JS. If the mouse tracking is written as a server application, then the code is in the JS section, otherwise it is directly installed on the client. The code is written in jQuery.
The HTML, CSS, and JS are sent to the client.
The browser renders the page by processing the HTML and CSS.
JS and jQuery are often categorized as client side programming language. They run on the browser's background where in this case the mouse tracking is running on the background.
What differentiates offline and online mouse tracking is the location of where the mouse tracking log is stored. Offline mouse tracking stores the logs on the client while online mouse tracking stores the logs on online server. When storing mouse tracking log online, the client side sends the log using Hypertext Transport Protocol (HTTP) post method.
The server processes the received log usually using server side programming language such as PHP.
The log can be stored as a file, in a database, or in any form of storage.
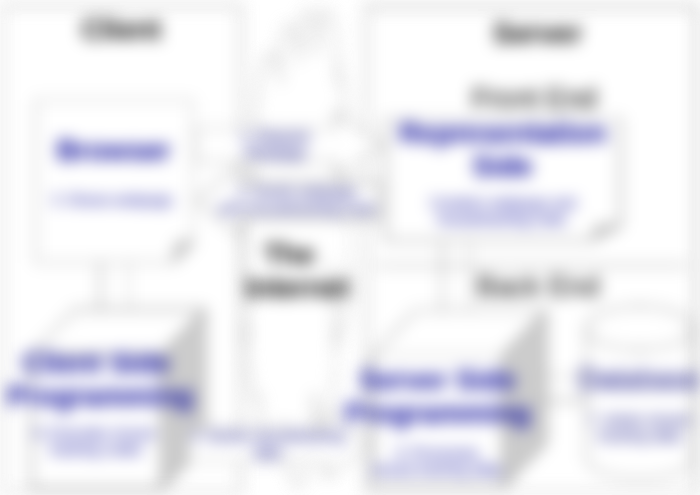

Figure 2.5 Online Mouse Tracking Framework © (Purnama et al., 2020b). The Framework is divided into two sides where one side is the client and the other side is the server. The client and the server are connected via the Internet. The server contains the front end, which is usually the representation side of the website, and back end where background processing and data storing occurs. There is a browser on the client equipped with client-side programming. The arrow presents the direction of the processes and the number presents the order of the processes.
For the client side does not require high performance hardware even Raspberry Pi works. As for the operating system, any operating system will do for as long as it has a browser that can run JavaScript. The application developed in this thesis supports both offline and online log storage and can either be in form of a file or stored in a database application. For the client application, this thesis provides a browser extension. Although that it requires installation in each client, all browser activities including visiting other websites are tracked. The author bundled the mouse tracking browser extension codes to make the installation easier where the client only needed to download and install.
For the server application, the advantage is that client does not need to install additional application, just browse the website and mouse tracking runs automatically but the disadvantage is that it cannot track outside of the website however it can still tell whether users' are leaving the page or not. For the server hardware depends on the amount of users that the administrators want to handle and as for the hardware specification used in this thesis is discussed on the next section. For the software, a standard web server is enough such as a server equipped with Apache2, PHP, and MySQL. For the installation, the author made it easy that all that are needed are to download the codes and install. In this thesis, the mouse tracking server application was implemented on an Learning Management System (LMS) called Moodle which is used to handle online courses. The mouse tracking codes are rearranged as a Moodle plugin where the author made a block and theme plugin for the Moodle shown on Figure 2.4. For usage, online choose one form of the plugin, either block or theme. The installation is also easy shown on Figure 2.6 where the process are only download, upload the plugin to Moodle, and install.


Figure 2.6 Screenshot and illustration of installing mouse tracking Moodle plugin. The page shows Moodle plugin installation page and the .zip image symbol represents the mouse tracking Moodle plugin in .zip format.
2.1.3 Privacy Policies
Privacy policies should be disclosed to the users during any form of data gathering. In the European Union (EU) is more strict that cookie policies should be separated from the privacy policies. By disclosing privacy policies, not only being in compliance with the laws and regulations, but build trusts with the users as well (PrivacyPolicies.com, 2020).
Based on how mouse tracking is executed which more details are illustrated in Figure 2.5, users actually have full control over the mouse tracking process and they can stop the process anytime but they are usually unaware because the mouse tracking runs in the background. They would have to thoroughly inspect the background area to see the running mouse tracking and most users do not attempt to perform this task because they do not feel bothered by the process. This is the reason why mouse tracking is considered non-intrusive.
Another reason why most users do not attempt to inspect the background area to see the running mouse tracking is because this requires technical skills that most users do not possess. Therefore, they are usually not aware that their data regarding to mouse, touch, and UI activities are recorded. To be in compliance with the privacy policy in general public websites, mouse tracking data gathered should be disclosed. The method is to pop up a mouse tracking configuration menu and before that, a notification menu asking permission to the user whether they allow the recording or not illustrated on Figure 2.7. If they allow then the options on the configuration menu should be marked and if they do not allow then the the options should be unmarked and no mouse tracking runs. In the educational sector depends on the academy/college/school/university and the lecturer/professor/teacher. Most of the time, the students are forced into compliance in having their activities recorded because of the demand to handle crucial educational activities such as preventing dishonest behaviors during exams.

Figure 2.7 The left image shows public privacy policy compliance illustration and the right image shows an agreement example between student and teacher about the recording of mouse tracking data for crucial educational activities.
2.2 Network Data Transmitted by One Click
Leiva and Huang, 2015 stated that a mouse swipe from left to right can generate hundreds of cursor coordinates and a mouse activity over a minute can generate 1 MB (megabyte) of data. Huang, White, and Dumais, 2011 conducted a massive scale mouse tracking on Microsoft’s Bing search engine but in the middle of the experiment, they have to reduce the sampling rate because the data size was simply too much. Those two references are the only scientific record found that complains about the problem of huge data generated by mouse tracking. This shows that data generated and the resource usage are not officially investigated. Therefore, an implementation followed by investigation were conducted by Purnama et al., 2020b.
2.2.1 Peer to Peer Experiment
The one click Peer-to-Peer (P2P) experiment is an experiment that measures the amount of data transmitted from the client to server when the user performs one click shown on Figure 2.8. This experiment greatly helps the investigation because the result can be used to predict the data cost mathematically. However, the result is dependent on the application, as time passes people may find ways to reduce the data.
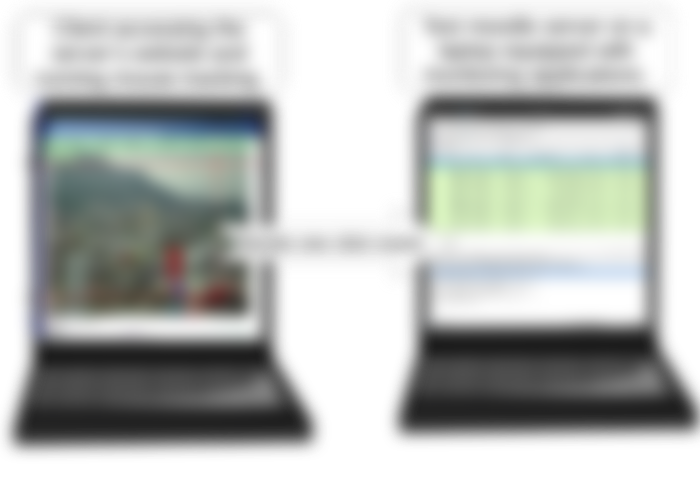

Figure 2.8 P2P real-time mouse tracking experiment © (Purnama et al., 2020b). The right laptop has a Moodle server installed with mouse tracking codes, while the left laptop has Ubuntu Desktop OS installed. The role of the latter is to access the Moodle server on the right laptop using a browser and perform one click. The right laptop received the click event and stored it on the database while measuring the network cost of the click event.
The online mouse tracking application was installed on the author’s Moodle server. The resource costs were then measured. The data rate of the network was measured using a tool called Wireshark. The server is an Ubuntu 18.04 Long Term Service (LTS) server equipped with an Intel(R) Core(TM) i7-6800K Central Processing Unit (CPU) @ 3.40 Giga Hertz (GHz) (with SSE4.2) CPU, 32 Giga Byte (GB) of DDR4 Random Access Memory (RAM), 10 Tera Byte (TB) of hard drive, and an allocated 2 Mega Byte per second (MBps) network.
2.2.2 Data Generation Estimation for Implementation Plan
The result on Table 2.2 showed that one click generates around 3-4 kilo Byte (kB) of transmission data. In other words, the mouse tracking application generates around 3-4 kB when one event occurs. The size depends on the metadata where in this case the size greatly increases when date and URL are included because they contain many characters.
Table 2.2 The data generated of one click posted to the server © (Purnama et al., 2020b). The rows before the last row are the types of information, and the last row shows the data rate of the submitted post (Purnama et al., 2020a).

If the administrator can estimate the amount of users and the average amount of events generated by users, then the administrator can estimate the amount of data to be generated. Rheem, Verma, and Becker, 2018 states that a very high activity is around 70 events per second. Based on Figure 2.9, expect a worst case scenario that a user generates a data rate of 210-280 kilo Byte per second (kBps).
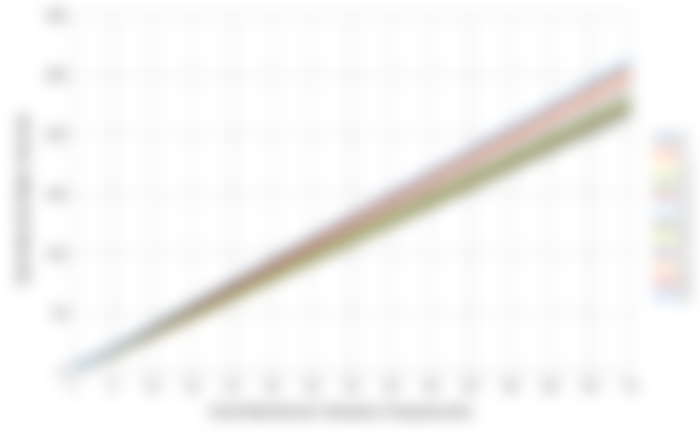

Figure 2.9 A plot of data rate generated by a user based on the events generated per second © (Purnama et al., 2020b). The horizontal axis represents the events per second or frequency in Hertz (Hz) and the vertical axis represents the data rate in kilobytes per second. The different colored lines represent the number of variables included (refer to Table 2.2).
2.3 Overseas Online Mouse Tracking Implementation
2.3.1 Quiz Details
An online quiz session was conducted on the 3rd of January 2019 between approximately 12:00 and 14:30 Japan standard time. There were 2 sessions, with each session lasting approximately an hour and including 20 and 21 students (41 total students participating) from the School of Engineering and Applied Sciences, National University of Mongolia accessing the Moodle server at the Human Interface and Cyber Communication Laboratory, Kumamoto University. The map illustration is shown on Figure 2.10.
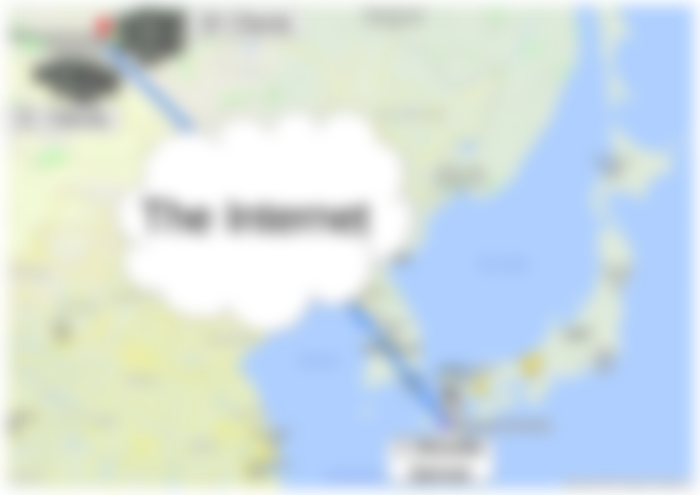

Figure 2.10 Overseas real-time online mouse tracking implementation © (Purnama et al., 2020b). Forty-one clients from the National University of Mongolia, separated into two groups, accessed the Moodle server at Kumamoto University in turns through the Internet and participated in a ten-question quiz session while mouse and keyboard activities were recorded. The Moodle server also measured the resource costs.
The quiz is a part of a mid-term exam of Microprocessor and Interfacing Techniques course for sophomore and junior year students in Department of Electronics and Communication Engineering, National University of Mongolia. The quiz is on https://md.hicc.cs.kumamoto-u.ac.jp. Figure 2.11 shows a screenshot of the Moodle log file and Figure 2.12 shows a screenshot of students grade of the quiz session. The detailed anonymous log files are published in Mendeley Data (Purnama et al., 2020a). The internet protocol (IP) address of the students for example “119.40.99.53” can be tracked by geo-location that it originates from Mongolia and “https://md.hicc.cs.kumamoto-u.ac.jp” which can be nslookup as “133.95.104.1” originates from Japan.
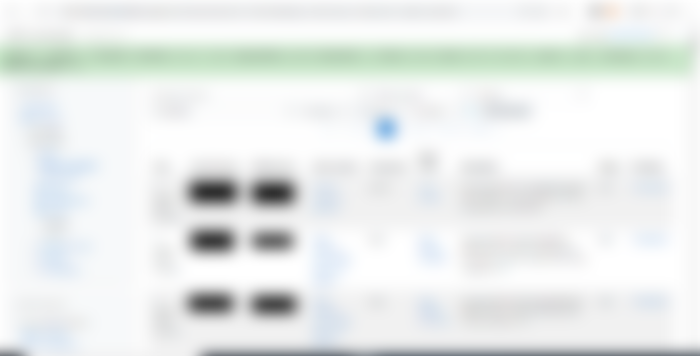

Figure 2.11 Screenshot of moodle log of students from National University of Mongolia who attempted a quiz session on a Moodle server at Kumamoto University © (Purnama et al., 2020b).
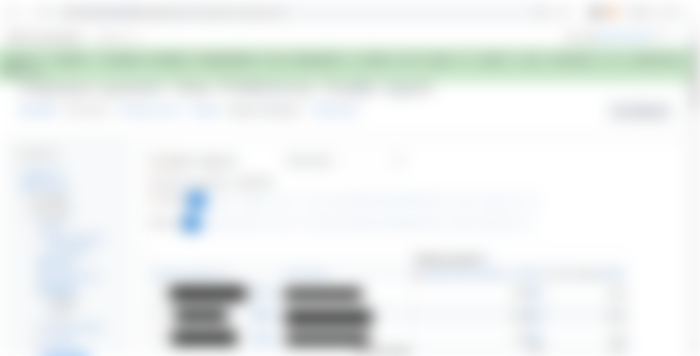

Figure 2.12 Screenshot of moodle grade of students from National University of Mongolia who attempted a quiz session on a Moodle server at Kumamoto University © (Purnama et al., 2020b).
2.3.2 Amount of Data Generated
The screenshot of mouse tracking log can be seen in Figure 2.13. Based on the data shared in Mendeley (Purnama et al., 2020a), the majority of the events are mouse movements and scrolls. That is because each change that occurred in either on the mouse cursor or scroll positions are captured. Rapid mouse movements or scrolls will generate large amount of data and how much depends on the capabilities of the computer. Theoretically, if the mouse cursor travels a distance of 1000 pixels than the number of mouse movement events generated are 1000, and if the scroll distance from top to bottom is 1000 pixels than the number of scroll events generated are 1000. In short, the capturing of geometrical data which is the x and y coordinates of the mouse cursor and scroll is the cause of the huge data generation. Also, the affect is multiplied to the amount of labels attached such as the user's identity that did the events, the place, and the time of the event occurrences. Just removing the URL label can save a lot of data space.


Figure 2.13 Screenshot of mouse tracking data of students from National University of Mongolia who attempted a quiz session on a Moodle server at Kumamoto University © (Purnama et al., 2020b).
During the quiz session, Figure 2.14 shows that a student is capable of generating a total over 20000 events which is over 80 Mega Byte (MB) transmission data. This means that student had to upload 80 MB of data at the end of the student's mouse tracking session in each page. According to Ookla, 2020 the global average network speed is 9.3 MBps downlink and 3.9 MBps uplink. This means there exist countries with the average network speed below that. Although nowadays are common for university size institutions to have network speed over 100 MBps, those resources are usually already allocated for many things. For example, the author's laboratory was only given 2 MBps network speed, meaning the mouse tracking session can flood the network. This explains why administrators are reluctant in implementing online mouse tracking. Imagine how much data can be generated if online mouse tracking is implemented by the whole university daily and full time.
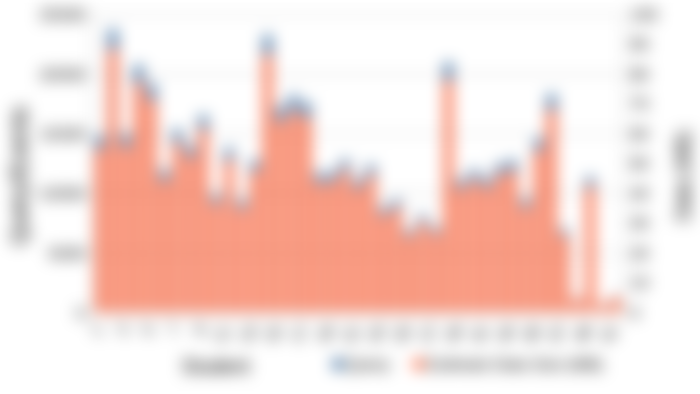
Figure 2.14 Total query/rows/events generated by each students during mouse tracking implementation between National University of Mongolia and Kumamoto University and its estimated total data transmission size © (Purnama et al., 2020b). The horizontal axis represents individual students, primary vertical axis is the query/rows/events, and secondary vertical axis is the estimated data transmission size.
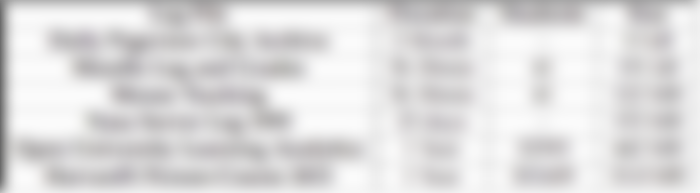
The amount of mouse tracking data compared to page view and other conventional web analytic were almost incomparable. Table 2.3 shows that the moodle log and grade of the quiz session were only a few kilobytes while mouse tracking log is already over a hundred megabytes. In that table is also shown other logs that required long duration and many users to reach the amount of data that mouse tracking log has. While a few hard drive storage are enough to store conventional web and educational logs, many more hard drive storage are needed to store mouse tracking logs.
Table 2.3 Comparison of mouse tracking data size to daily pageview, Moodle log and grades, Nasa server log 1995, Open University learning analytics dataset, and HarvardX Person-Course 2013 © (Purnama et al., 2020b).

3 Online Mouse Tracking Resource Saving Methods
It is unfortunate that the online mouse tracking resource usages are too much for regular people to implement daily and full time except for special occasions only such as examinations. The ones who can implement online mouse tracking daily and full time are big institutions such as Amazon and Google. Therefore, on this chapter is discussed the novel method of this thesis to reduce the resource usage of online mouse tracking.
3.1 Existing Methods
Existing methods to reduce mouse tracking data transmission are common sense and popular methods where most of them were discussed by Purnama et al., 2020b. They are:
Redundant data reduction which is mostly about reducing meta data such as shorting date format, shorting URL, avoiding duplicate or repetitive data, and exclude information deemed unnecessary.
Sampling rate reduction which is adding delay to the event capturing. The default is to capture immediately such as every time the mouse cursor and scroll moves even if they are only by one pixel point while with sampling rate reduction, there are pauses in the capturing process for example every 50 milliseconds, 1 seconds, 2 seconds, etc. where the longer the interval the more the data reduction but at the cost of data resolution.
Adaptive sampling where the application does not capture if the mouse cursor and scroll are idle, unlike usual eye tracking where the eye gazes are capture every certain interval even though the gaze's position does not change.
Compression methods which were researched by Leiva and Huang, 2015 and Martín-Albo et al., 2016.
3.2 Real-Time Online Mouse Tracking
The conventional data transmission method is to transmit the data as a single package at the end of each mouse tracking session. Based on Figure 2.14, this conventional transmission method floods the 2 MBps network. The author anticipated this and implemented real-time transmission (Purnama et al., 2020b) method avoiding often 2 MBps flood which was reduced to data rate of average around 100 kBps. Although the average data rate is 100 kBps, Figure 3.1 shows many spikes where the difference between average and maximum is large which indicates that there were moments of high activities. The highest spike is around 800 kBps. The spikes are not only pointing upward but pointing downward as well which indicates that there are also moments of low activities. Overall, the standard deviation is high where there were times when activities were high and activities were low, thus precise data usage can be difficult to predict.
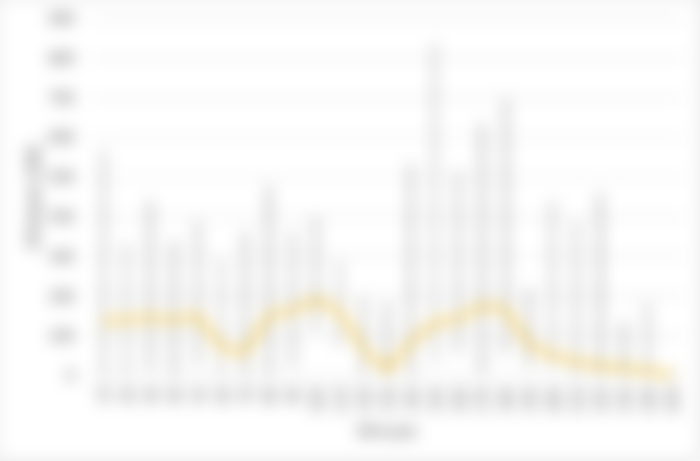

Figure 3.1 Data rate during mouse tracking implementation between National University of Mongolia and Kumamoto University. The horizontal axis represents 10 minute interval time and the vertical axis represents the data rate in kilobytes per second. The yellow horizontal line shows the average and the vertical lines shows the minimum and maximum during their respective interval © (Purnama et al., 2020b).
The difference between offline mouse tracking, online mouse tracking, and real-time online mouse tracking can be described on Figure 3.2. While offline mouse tracking stores the data in each of the users' computers, online mouse tracking transmits the data to the server. While conventional online mouse tracking stacks the data until the end of every session before transmitting as a single package, real-time online mouse tracking transmits the data immediately after an event occurs every time. Real-time online mouse tracking helps in reducing the probability of bottleneck as illustrated on Figure 3.3. This helps to balance the transmission load.


Figure 3.2 Flowchart of mouse tracking © (Purnama et al., 2020b): offline (left), online (middle), real-time and online (right).
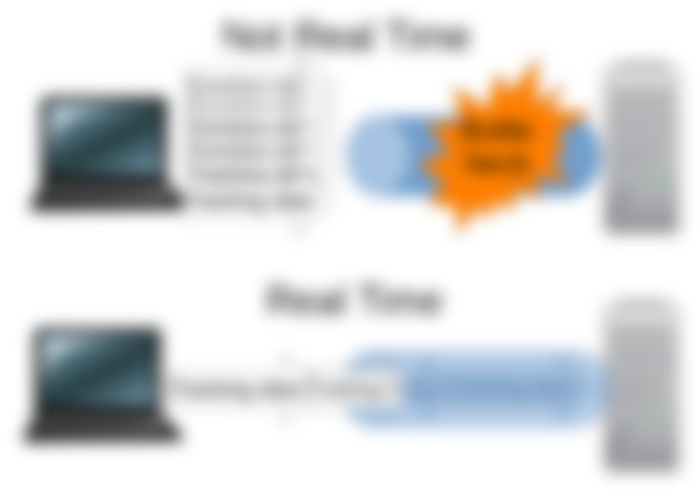
Figure 3.3 Illustration of bottleneck network in regular online mouse tracking and real-time online mouse tracking as a solution © (Purnama et al., 2020b).
3.3 Lossy Online Mouse Tracking
3.3.1 Three Mouse Tracking Preprocessing and Transmission Method
In the end of Chapter 2, it is known that the capturing of geometrical data which are the x and y coordinates of the occurred events and the time stamping of each events are the largest contribution to the data size. If the geometrical data can be reduced then the data size can be reduced as well. Based on many example mouse tracking data analysis, there are three possible cases illustrated on Figure 3.4:
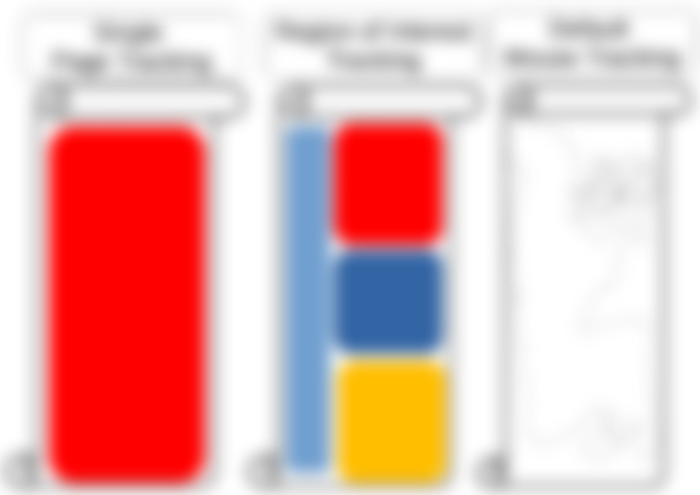

Figure 3.4 Whole page vs region of interest vs default mouse tracking illustration. The left scroll illustrates summarized event amount that summarizes the number of events occurring on the whole page; the middle scroll illustrates ROI tracking that summarizes the number of events occurring in defined areas, and the right scroll illustrates default mouse tracking that records every event and the precise point where it occurs, forming a trajectory.
Default mouse tracking which is using all of the geometrical data when and where every events that occurred at each coordinate. An example of data visualization that can be generated by default mouse tracking is mouse trajectories and if the time is recorded as well, a video replay of the mouse trajectory can be generated.
Summarized event amount which is not using any geometrical data where only the event amounts are captured not knowing when and where they occurred. Currently only the amounts of duration, mouse clicks, mouse movements, mouse scrolls, zooms, and keyboard typed of each session are captured, sacrificing the position and time information of these occurred events.
Region of interest (ROI) mouse tracking which is using only selected geometrical data where the coordinates are summarized into selected areas. In other words, the mouse tracking is no longer able to identify the coordinates but only get the activity heatmap of the area. Currently the amounts of duration, mouse clicks, mouse movements, mouse scrolls, zooms, and keyboard typed of each session are captured on header, footer, navigation menu, and each of the quiz question area, sacrificing the exact coordinate information of each events. This method is actually a continuation based on previous work by Purnama et al., 2016 and Purnama, Fungai, and Usagawa, 2016.
By knowing the geometrical data that the analysers wants, the storage and transmission cost can be reduced by applying preprocessing and modifying the transmission method based on Figure 3.5. The default one is the real-time online mouse tracking where the event information is immediately sent to the server at the moment it occurred. For the summarized event amount, only the amounts of events are recorded excluding the place and time of occurrence. It is discouraged to update the event amount in real-time because that will cost data on the network. Instead, it is best to utilize the conventional transmission method where the final event amount value is sent only once at the end of each session (refer to Figure 3.2 online mouse tracking transmission not in real-time). Unfortunately, there are still some potential problems to this conventional transmission method implementation where if the user ends the session in haste, the time may not be enough to retrieve the mouse tracking from the client to the server and potentially losing the data. For ROI mouse tracking, the amount of events are accumulated when the mouse cursor is still within a specific area. When the mouse cursor moves to a new area, the event amount information of the previous area is sent to the server, and the process repeats. There is still a limit in determining and labelling web page areas. Usually, it is done manually by the analyzers but this way is very labor and time consuming. It is possible to determine and label areas automatically using offset DOM event, but not in a smart way where it depends on the layout of the web page. After the areas are determined for the ROI mouse tracking, the transmission method is a hybrid of conventional and real-time where the mouse cursor enters an area and accumulates the event amounts, then the result is transmitted after the mouse cursor leaves the area, and the process repeats upon entering a new area.
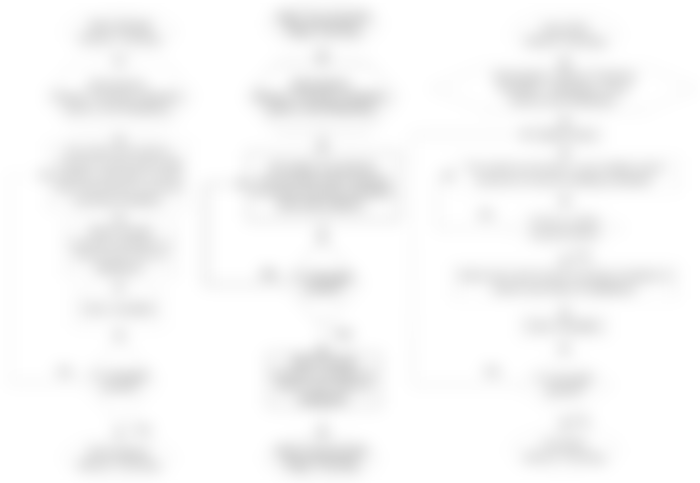

Figure 3.5 Three Types of Mouse Tracking Flowchart. The left flowchart is default mouse tracking, the middle flowchart is summarized event amount, and the right flowchart is region of interest mouse tracking (Purnama and Usagawa, 2020).
3.3.2 Three Mouse Tracking Preprocessing and Transmission Simulations
Since the author did not have another mouse tracking experiment opportunity, a simulation is conducted based on the previous mouse tracking experiment on Figure 3.6. It is possible to replay the scenario because the date of each events during the mouse tracking session was captured. However, there was a limit at that time that half of the students are using different time zone format which was difficult to simulate and half of the students are excluded leaving only 23 students.
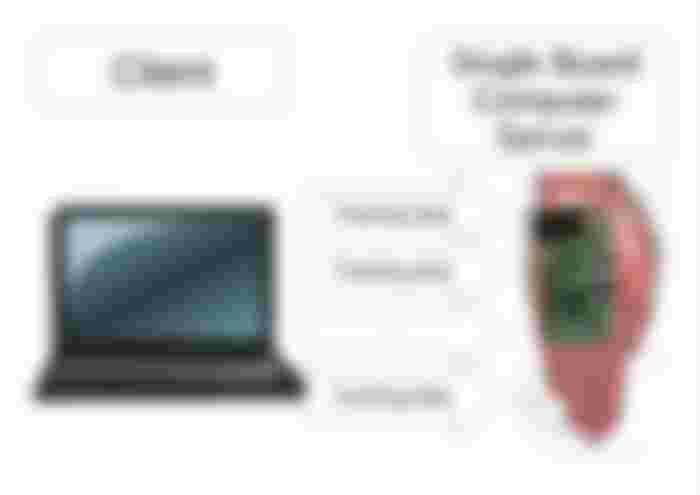
Figure 3.6 In Purnama and Usagawa, 2020 the simulation is based on Figure 2.10. In this thesis, the server is changed to single board computer Raspberry Pi 3. The reason is to support regions with limited connectivity in Figure 3.7.
Five mouse tracking simulations are performed on a quiz page with a size or dimension of 1920x1080 pixels:
Default mouse tracking simulation without changes in the original mouse tracking data.
ROI mouse tracking where the coordinates are summarized into certain areas for each users. The summarising is based on the flow of time domain where a query based on the summarized coordinates is generated every time a user leaves an area and not a total summary of each area where more information can be found on Appendix A:
ROI mouse tracking 1 where the coordinates are summarized into 50 areas which consists of header, title, quiz navigation, navigation, administration, footer, each quiz flags, each quiz questions, each quiz answers, and blank areas.
ROI mouse tracking 2 where the coordinates are summarized into 35 areas where the quiz questions and answers each are summarized or combined.
ROI mouse tracking 3 where the coordinates are summarized into 20 areas where the each quiz flags are summarized or combined to their respective quiz areas.
Summarize amount of events mouse tracking simulation where the data is transformed by summarizing the event amounts of each users into a query and sent the queries based on the end session time of each users.
3.3.3 Three Mouse Tracking Preprocessing and Transmission Results
The result is that a great reduction in data size is achieved by sacrificing some geometrical data for ROI mouse tracking and all geometrical data for summarized event amount shown on Table 3.1. Surprisingly on the user side, the script total execution time on the browser was also reduced shown on Figure 3.8. The transmission cost was also reduced shown by the reduced data rate on Figure 3.9 which is also in parallel to the server's CPU and RAM usage.
Table 3.1 Comparison of data amount generated from the three types of mouse tracking.
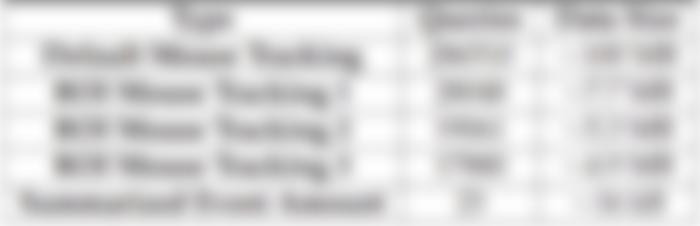

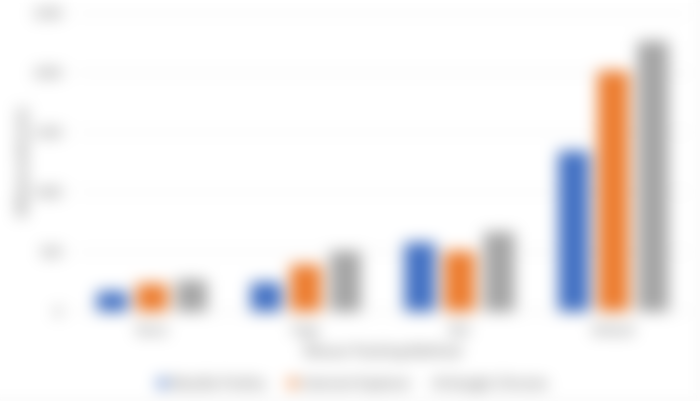
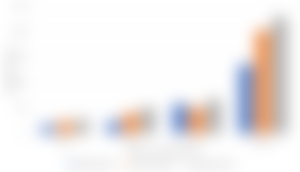
Figure 3.8 The total script running time of three mouse tracking demo session by the author. The horizontal axis is the mouse tracking method. The data in order are from Mozila Firefox, Microsoft Edge, and Google Chrome. The vertical axis is the total running time in milliseconds. Among the three browsers Mozilla Firefox performs faster than Microsoft Edge and Internet Explore performs faster than Google Chrome for this work u, 2020.
The Raspberry Pi's CPU is not strong enough to handle the default mouse tracking simulation of around 20 users where the CPU often reach 100% usage. Even the RAM usage is abnormally high over hundreds of MB. However, it is able to handle ROI mouse tracking and summarized event amount method. This shows how useful the data reduction method are.
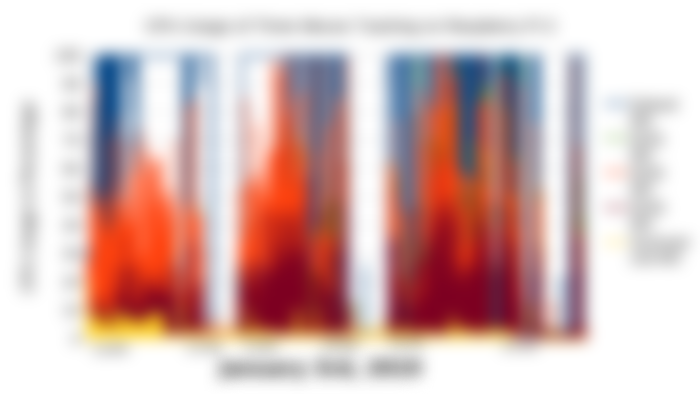
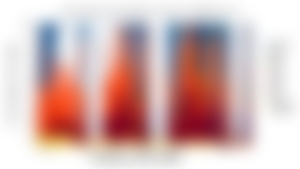
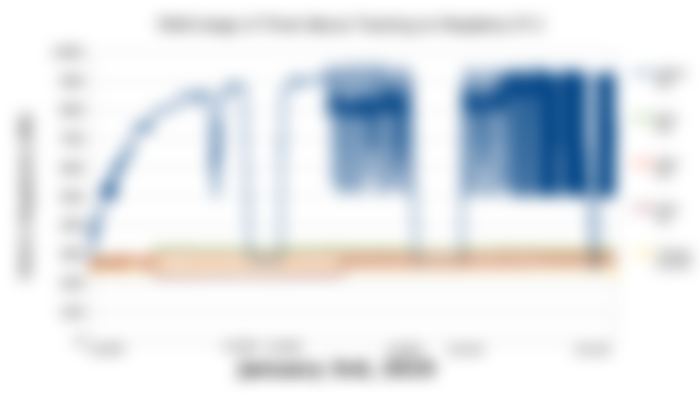

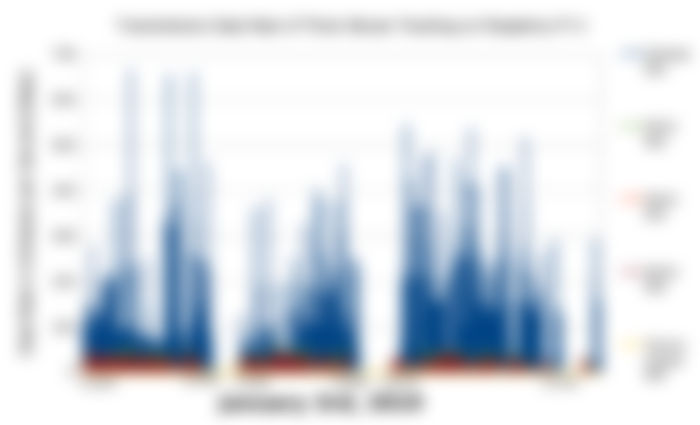
Figure 3.9 CPU and RAM usage and data rate comparison between default mouse tracking, summarized event amount, and ROI mouse tracking.
Among the three mouse tracking method, the summarized event amount method is the maximum resource reduction because all the geometrical and time data are excluded or simply only consist of one area. Theoretically, the amount of query is reduced to one per mouse tracking session. For the ROI mouse tracking, does not necessary always result in large resource reduction like the result in this thesis. Theoretically, it depends on the area division of the web page. The smaller the division, the larger the area, the larger the resource reduction, and vice versa. By performing more division, the areas become smaller, the resource usage becomes larger, and eventually the area will become as small is coordinates if areas are kept being divided which will become the same as default mouse tracking.
4 The Depth Levels of Logs
Back in Chapter 1, it was emphasized that conventional web logs and educational data have a limitation regarding to the information that they can derive. Mostly, it was about how those conventional logs could not capture the users or students behavior online. Eye and mouse tracking solves that problem by capturing how the students interact. It took some time for the author to understand and conceptualize the meaning behind those repeating statements about what conventional log data cannot tell while eye and mouse tracking log can tell. It turns out to be that the depth level of those logs are different where eye and mouse tracking logs belong to a deeper level than conventional logs.
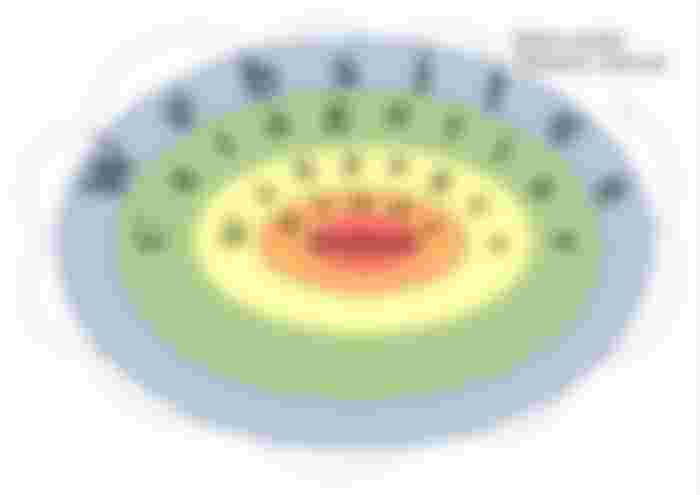
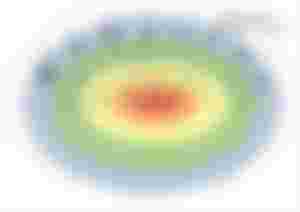
Figure 4.1 Six level of web logs in order from most shallow to deepest are Internet, websites, categories, web pages, area, and coordinates.
This thesis defines six depth level of web logs from browser content point of view shown on Figure 4.1. Most analyzers do not know that there are deeper level of logs. Most tools do not generate data in deeper level than web page level logs. The web log depth levels converted to educational data can be illustrated on Figure 4.2. Most educational tools only generate logs up to course content level which are mostly how many time the students attempts the activity and what grade they received. This chapter discussed the three deepest log levels and explained how mouse tracking belongs to the deepest log level.
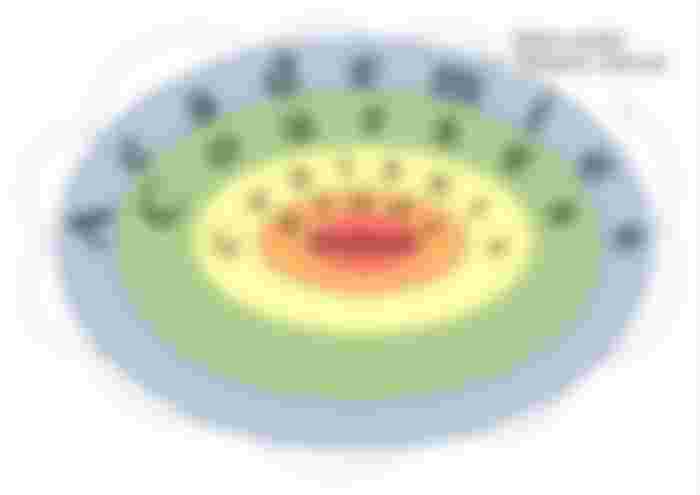
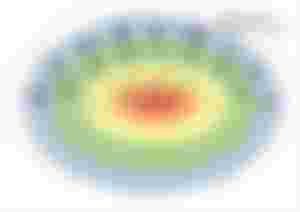
Figure 4.2 Six level of educational data in order from most shallow to deepest are Internet, academies, courses, course contents, area, and coordinates.
4.1 Web page / Course Content Level Logs
4.1.1 Conventional Web Logs and Educational Data
The conventional web logs belongs up to the web page level log. They are mainly page views which shows that a web page from a certain website and category have been viewed (Bluehost, 2016). Additional metadata can be attached to the page view:
"Who", the identity of the viewer can be identified if the viewer register to the website, provides identity on the browser and gives permission to identify, or if not then the internet protocol (IP) address of the viewer can be captured.
"Where" can be the link of the web page or the location of web server and viewer if they are identifiable.
"When" is usually the date and time of the occurred page view or any action. More specifically, the duration can be calculated.
"What" is usually the action of the viewer labeled by the analyzer. If the web page is a reading content then the viewer's action is labeled as reading. If it is an audio content then the viewer's action is labeled as listening. If it is a video content then the viewer's action is labeled as watching. If it is a forum then the viewer's action is labeled as discussing and etc.
As page view belongs up to the third deepest level log, there is a limit how much it can tell no matter how hard it is analyzed. For example, page view cannot tell how a user is reading a content such as whether the user is skimming or reading in detail. The limit is that page view cannot capture activities that occurred in specific area of the web page. In education, there are four popular logs that are used by teachers which are materials the student read, assignments submitted, topics discussed in forum, and quiz or exams grades. Unfortunately just as conventional web logs, conventional educational data can only tell what activities the students are doing and its duration but cannot tell how the students attempts those activities which can be more emphasized on Figure 4.3. In other words, it can identify a certain extent of what, when, where, and who but cannot identify deeper and how the viewer interacts with the contents (Purnama et al., 2016) (Purnama, Fungai, and Usagawa, 2016).
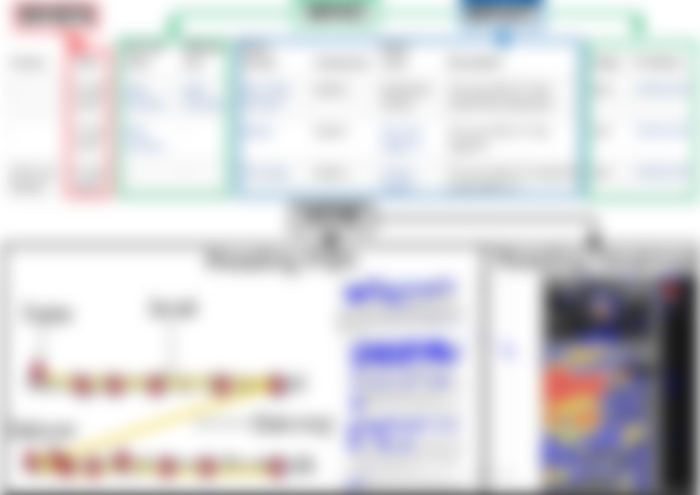

Figure 4.3 The top half of the image shows page view implemented in Moodle which is called course view. It can tell what kind of activity is attempted based on the page label within the course, when in dates, and who by the students' registered names and ip address. The bottom half of the image shows eye tracking that can tell how a user is reading the text which Moodle log cannot tell.
4.1.2 Amount of Interactions
Although the summarized event amount of mouse tracking is on the depth level of web pages or course contents, it is still not widely known by analyzers. DOM events can tell many other interactions users does on the web page. The simplest of them are knowing how much interaction the user does such as how many clicks, how many touch, how much mouse movements, how much scrolls, how much zoom in and zoom out, how many copy and paste, how many times the keyboard was pressed, and etc. Table 4.1 shows that the Mongolian students attempting the quiz session took at average 1368 seconds, performed at average 175 left clicks, 8 middle clicks, 11004 mouse movements, and 4158 scrolls.
Table 4.1 The duration and event amount generated by 41 Mongolian students during a quiz session.


Knowing the amount of DOM event occurrence on a web page may give a hint whether the web page fulfills its purpose or not. For example, a web page designed based on game theory are bound to be interactive where if there are less events such as clicks, movements, etc, may show that the users does not engage on the web page, whereas if the web page is designed for reading and there are many events, then there must be something wrong. The author expect high amount of DOM event done by the students because they are attempting a quiz where they need to perform many clicks to choose an answer, and need to perform many movements to read the questions carefully and maybe reviewing some questions. If there is no problem with the web page then there can be problems with the users. A study showed by Rodrigues et al., 2013 that high amount of events generated by a user can indicate that the user is stressed. Theoretically, there should be a common sense of how much a user should generate events within a certain amount of duration.
4.1.3 Web Page or Course Content Inactivity
Web page or course content inactivity is another DOM mouse event feature that analyzers does not know. In page view, the duration can be counted on visited web page but it cannot tell whether the users are actually in the web page the whole time because they can just open another tab and leave the previous ones open. With mouse DOM events, it is possible to distinguish the amount of active and inactive time of users within a web page. The inactivity is indicated when the mouse cursor leaves the web page for opening another tab or doing other activities and when the mouse cursor re-enters the web page, the status will show active again.
In Table 4.1, the amount of inactivity queries of each student are provided, and in Figure 4.4, the amount of inactivity in time domain are plotted. They showed that all the students does not always stay in the quiz page which opens the possibility that they are seeking information from outside source to answer the quiz better such as searching for answers in search engines and messaging friends online. The amount of inactivities could be exagerated due to system limitation reasons such as slow mouse leaves generates more inactivities query than fast mouse leaves. However, the system design still ensures that no inactivities queries will be generated if the mouse does not leaves the quiz area.
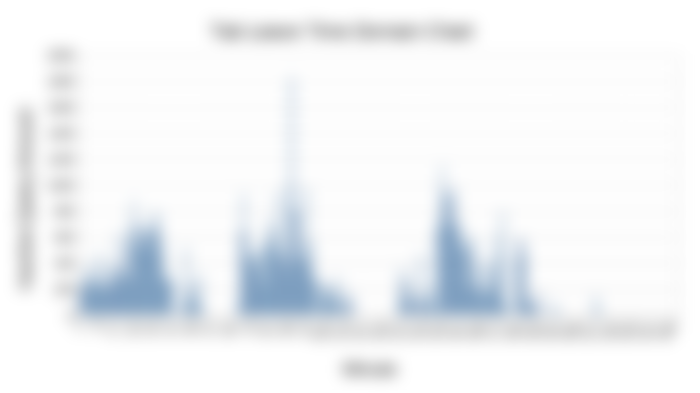
Figure 4.4 Inactive queries plotted in time domain. The horizontal axis is the time interval in minutes and the vertical axis is the amount of inactive queries.
Aside from capturing inactivities, capturing highlight, copy, cut, and paste can help in detecting dishonest behaviors. An alarm system can be developed to inform the examiners when such events occurred. For important exams such as certifications, stricter systems can be implemented such as immediately failing the test when the mouse cursor leaves the exam illustrated on Figure 4.5.
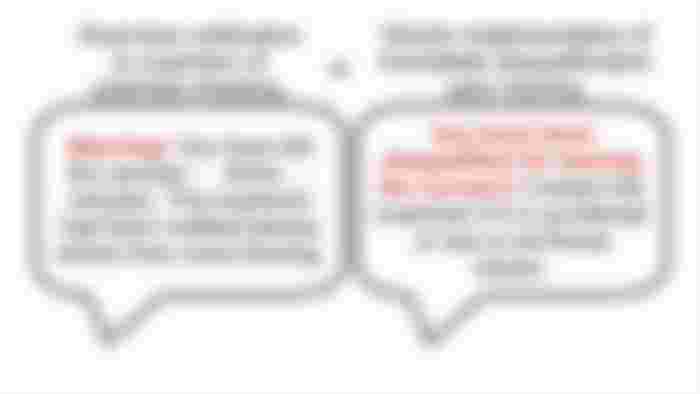
Figure 4.5 An exam detector that tracks unwanted activities of participants such as mouse leaving the exam, tab and meta button to leave the exam, and other events indicating exam leaving.
4.2 Area Level Logs
Area level logs are logs showing activities within areas of the web page or course contents. This can be done by either or combination of capturing the mouse cursor position, the touch location, the scroll bar position, or tracking the eye ball position. Then capturing the date and time of the events that occurs in those positions. The ROI mouse tracking provides these kinds of information. The amount activity in each area for this thesis is based on the total amount of events.
The most popular analysis of area level logs are heatmap visualization. There are many indications that can be derived from heat maps. For example on a high activity or duration area, may indicate that users are interested in the area. If not, then they may have trouble with the area whether trouble in understanding the content, questions that are too difficult for example on Figure 4.6 that question three receives the most attention which may indicates difficulties, or there was design problems that results in unnecessary efforts on users to capture the information. On the other hand if the area has low activity or duration may indicate that the users are not interested, the design is not well enough to capture the users' attention, or the question in the quiz is simply too easy.
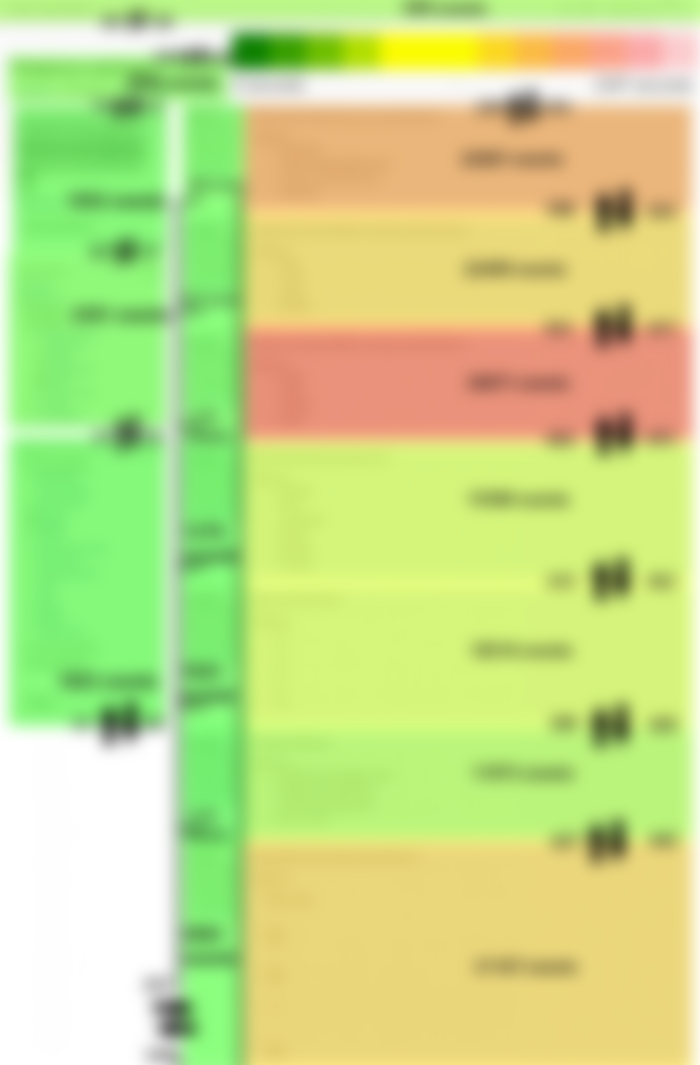
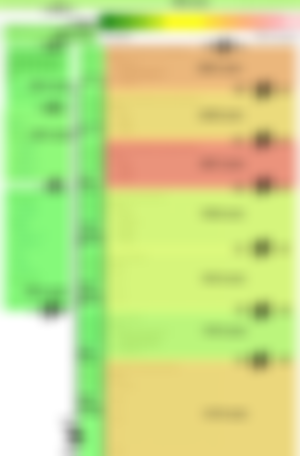
Figure 4.6 DOM and Mouse tracking of a whole class attempting a quiz session summarized into a heatmap. The color represents the duration of mouse cursors staying on an area where short to long durations are indicated from green to red. The number inside an area is the total events of clicks, movements, scrolls, etc combined. The arrows indicates the amount the mouse cursors entering or leaving an area.
Figure 4.7 shows an even more detailed heatmap where the visualization was split into 10 minute intervals. Just from a glance it can be seen that the high activity time is the 30th, 90th, and 160th minute, they took a break on the 130th minute, and they finished on the 230th minute. Another interesting information is that they did not bother much with the last question, maybe whether they are too easy or they just want finish quickly because they are too tired.
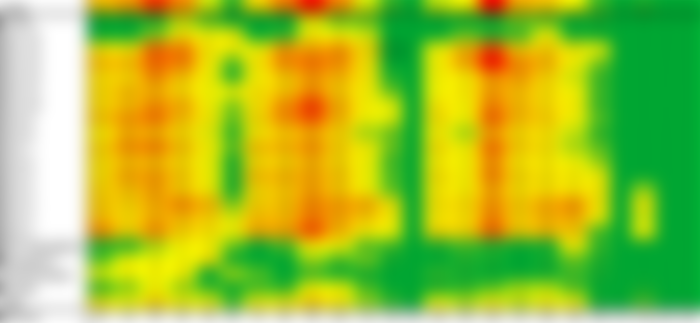
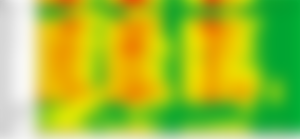
Figure 4.7 Mouse activity heatmap in quiz page locations in time series. The horizontal axis represents 10 minute interval time and vertical axis are quiz page locations. For the heatmap, green color is close to minumum activity, yellow color is close second quartile, and red is close to maximum activity.
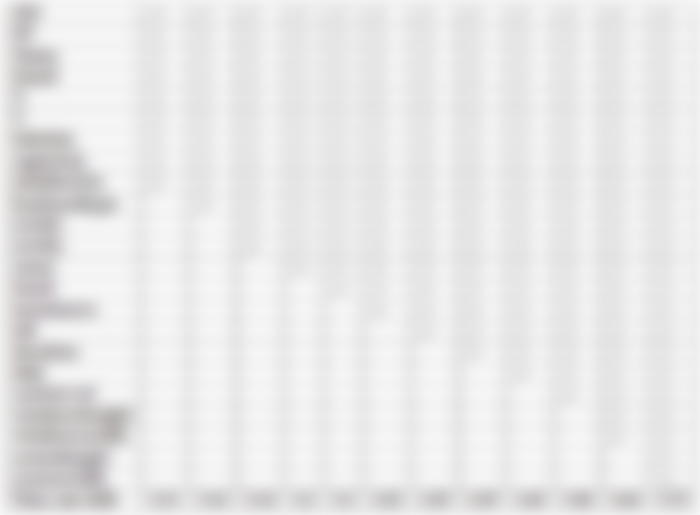
Figure 4.8 shows another detailed heatmap regarding to the amount of activities done by each students on each area. The heatmap seems to vary to not showing much similarities between each students however, there are some. There can be seen a common correlation on question 13 that there are high activities and looking at the grade/score distribution in Figure 4.9, many students got the answer wrong which maybe common evidence that the question is too difficult for them that they had to take more effort in it. An opposite case is on question 6 where there are low activities but many students got the answer wrong which can lead the analyzer to wonder whether question is a trick question. Another similar case with strong similarity found between Figure 4.8 and Figure 4.9 that students did very little activity on the last question and but most the students got the answer wrong. Unlike question 6, it may not be a trick question but a difficult question because the score allocation is high. There maybe two possibilities where the first possibility is that the students ran out of time and since it is the last question, they may answer randomly, and the second possibility is that the students are lazy and/or tired that when they reach the last question that is difficult, they answer randomly because they may just wanted to finish the quiz quickly, giving up on the last question.
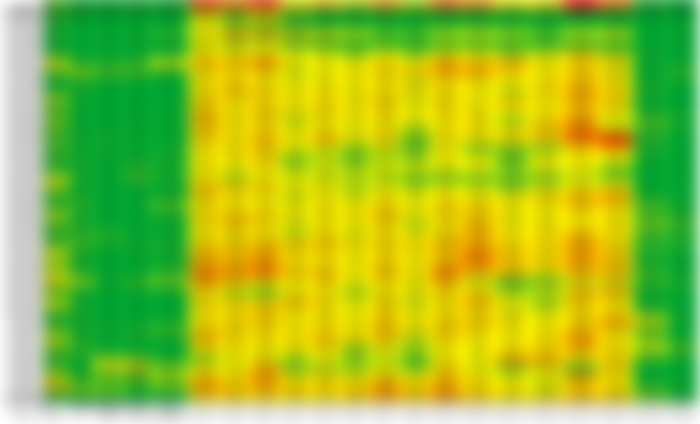
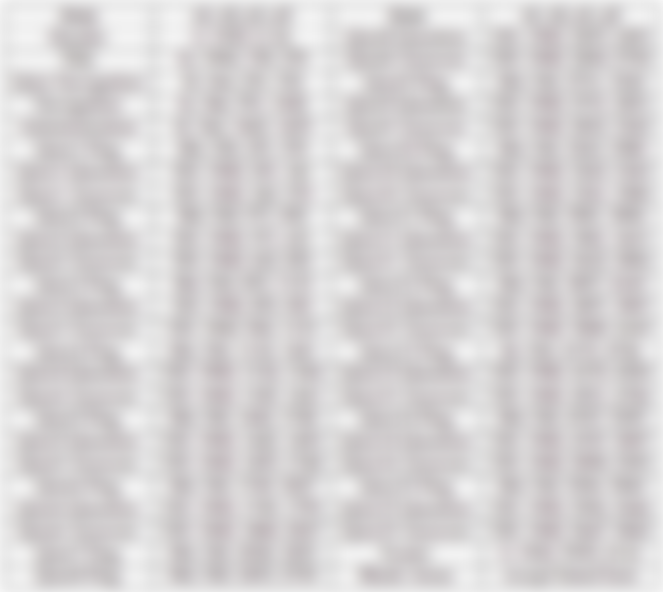
Figure 4.8 Mouse activity heatmap in quiz page locations of each students. The horizontal axis are quiz page locations and vertical axis are the students anonymized. For the heatmap, green color is close to minumum activity, yellow color is close second quartile, and red is close to maximum activity.
Those indications can be useful in many ways. For example, if the indications shows that users are not paying attention to areas which are intended to be emphasize by content creators then there needs design fixing or content revision. In education, the heat map can be useful to profile the students. It can then be followed by a guidance system that can automatically detects the students interest which the guidance system can guide the students in many ways such as linking to related resource, suggesting students their career path, grouping them with relevant community, etc. The profile can also be used in a stricter way where the teachers gives assignments to students about reading a context and the system will detect whether the students have sufficiently paid enough attention to the context or not.


Figure 4.9 Grades/marks/scores the students receives in each questions. The first row is the label of the anonymized students, average score, and the amount of mistake made in each question. The first column is the label of the question number along with the score allocated to each of them. Wrong answers are marked with 0 points and highlighted in red.
Additionally there are some analyzers that counts the amount of mouse entering and leaving the area which is known as the mouse flow. In quiz sessions, it is normal to find many mouse flows because students tends to review or revisit the questions whether to double check or because they previously skipped them. On the other hand, for a website that is meant to guide or share information, many mouse flows may indicate problems for the website such as the users maybe confused in finding the information they need thus searching tirelessly (Hsu, Chang, and Liu, 2018).
A possible application is force reading illustrated on Figure 4.10, for example making sure the students read the agreement to tracked before exam and users read the term of service. The administrator can configure the variables such as the reading duration and amount of activities and areas. Simply, if the user did not read enough the area, then the user cannot pass and must read enough of the defined passage.
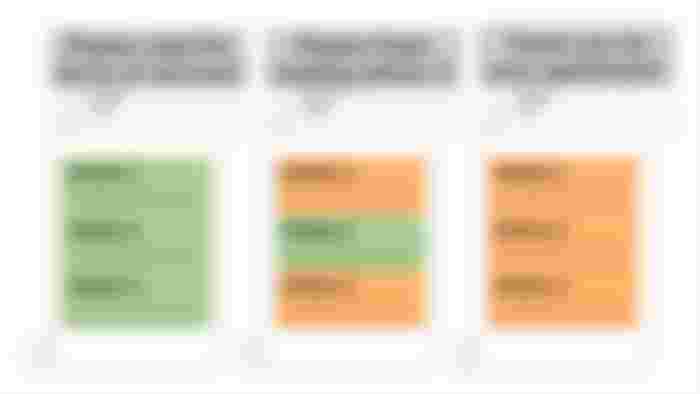
Figure 4.10 Illustration of force reading based on the duration of the mouse cursor stays in an area. The left example shows that the mouse cursor did not stay long enough in each area and tells the user to read everything, the middle example shows that the mouse cursor did not stay long enough in middle area and tells the user to complete reading middle area, and the right example shows satisfaction in user's reading.
4.3 Coordinate Level Logs
The coordinate level are the deepest level logs. The coordinate values can either be based on document, screen, or windows perspective. This is the log that the default mouse tracking generates (Purnama et al., 2020b). It is overwhelming but contains the most information where this is the log that most analyzers should want to keep. The more shallow level such as the area level log can be derived from the coordinate level log and it is unidirectional where the vice versa is not possible (Purnama and Usagawa, 2020). The most popular analysis is to draw a mouse trajectory. If the time when the mouse cursor lands on the coordinates are recorded, then it is possible to replay what the users did.
An example visualization that can be drawn from the mouse tracking data is the mouse click trajectory in Figure 4.11. It shows a user highlighting a text which can indicate that a user is paying a attention to that text or attempts to copy that text to save in the user's note or to paste in the search engine to find more information about the text. The amount of highlights the students did was also summarized on Table 4.1 and showed that either the students who highlights gets high or low grade and not average grade. The speculation is that the questions they highlight are too difficult for them and either they succeeded in finding the answers on other sites or failed. Unfortunately, the copy and paste events were not implemented at that time. In fact, it is because the author found this highlighting that motivates the author to add copy, paste, and other DOM events into the mouse tracking application.

Figure 4.11 A visualization of clicks generated using the mouse tracking log of Mongolian students attempting the online quiz session. Left clicks are indicated by triangles, middle clicks are indicated by squares, and right clicks indicated by pentagons. The two interesting parts of these visualization are shown by rapid left clicks on certain text areas that indicates highlighting and rapid middle clicks that indicates scrolling.
Although mouse tracking logs are part of the deepest level logs there is still a limit of how much the mouse cursor and scroll position can indicate because certain events does not necessary have to occur on those positions. For example, reading is based on the eye gaze and typing may occur not far from the mouse and scroll position but not necessarily exactly on those position. Each of these logs alone will not make the best logs but a combination of them. Combining conventional web logs or educational data with mouse tracking and eye tracking may provide a complete log.
5 Conclusion and Future Work
5.1 Conclusion
The author wrote an online mouse tracking application suitable for public implementation and implemented during a quiz session at the Human Interface and Cyber Communication Laboratory, Kumamoto University on the 3rd of January 2019 between approximately 12:00 and 14:30 Japan standard time. The amount of data generated by mouse tracking was investigated during the implementation and found that the cause of huge data generation is the capturing of geometrical data or coordinates of each event. Aside from existing solutions to reduce data, this thesis also implemented and discussed real-time transmission system in mouse tracking data retrieval helps distribute the network's burden across the time domain. The main novelty of this thesis is the select-able geometrical online mouse tracking method where there are possible cases that not all the geometrical data are required. The method allows summarizing of coordinates into areas or deleting the coordinates if they are not necessary. The results showed great reduction in storage and transmission costs. However, the method is lossy because the process is irreversible. Rich mouse tracking data were obtained and in this thesis a new concept of log dept level was discussed with example analysis that include click visualization and activity heatmap which help in identifying the interaction between the students' and the quiz page.
5.2 Future Work
The real-time transmission is not the best solution. A better method is to upgrade the real-time transmission method by integrating smart transmission method where the client can detect the traffic of the network and determine the optimal time for queuing and transmission. Although the select-able geometrical mouse tracking data method works perfectly, there are still problems with execution. If all of the geometrical data are excluded, the most efficient time to transmit the data is only once which is when the user leaves the page. However, the problem lies with the browser where there is currently no way to force the user to wait before the transmission process finishes, leaving potential problem of data loss. The problem for ROI tracking is that it cannot perform smart area determination and labelling. Normally, they are performed by humans. Therefore, one solution is to develop an artificial intelligence for this matter in the future. Finally, this doctoral thesis is only limited to mouse tracking with one type of activity which is examination. There are a various activities such as passage reading, e-commerce, entertainment, Geo-visualization reading, search engine, social media, etc which are open for future work.
Appendix A Data
A.1 Quiz Areas

A.2 Full Quiz Page Heatmap
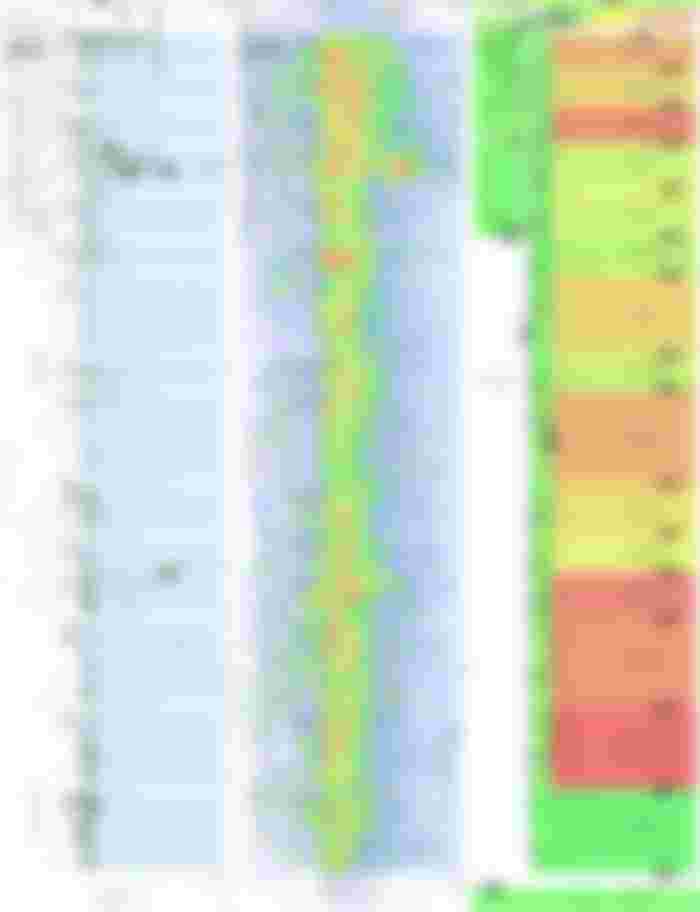

Figure A.1 Visualization of mouse tracking data. Default mouse tracking data can visualize exact points of location, the left image is click visualization and the middle image is a heatmap based on the duration the mouse cursor stays on each point, while ROI tracking can only visualize defined areas and show flows between areas shown on the right image.
Appendix B Copyrights
Below are the publications reused in this thesis that does not require copyright clearance:
Using real-time online preprocessed mouse tracking for lower storage and transmission costs" (Purnama and Usagawa, 2020).
Demonstration on Extending The Pageview Feature to Page Section Based: Towards Identifying Reading Patterns of Users (Purnama, Fungai, and Usagawa, 2016).
Below are the publications reused in this thesis that requires copyright clearance and obtained:
Rsync and Rdiff implementation on Moodle's backup and restore feature for course synchronization over the network (Purnama, Usagawa, Ijtihadie, et al., 2016).
Incremental Synchronization Implementation on Survey using Hand Carry Server Raspberry Pi (Purnama, 2017).
Implementation of real-time online mouse tracking on overseas quiz session" (Purnama et al., 2020b).
https://s100.copyright.com/CustomerAdmin/PLF.jsp?ref=d6af378c-4d45-49da-90cf-5ce0e54d2473
Material details:
Original author's name: Fajar Purnama, Tsuyoshi Usagawa
Document title: Incremental Synchronization Implementation on Survey using Hand Carry Server Raspberry Pi
Book or journal title: Technical Report, vol. 117, no. 65, ET2017-4, pp. 21-24, year 2017, month 5.
Portion: Figure 5
Permission No.: 20GB0052
IEICE hereby grant permission for the use of the material requested above on condition that their requirements are as follows:
Indication of source (e.g., author's name, document title, name of journal, volume/issue/page number, publication date, etc.)
Indication of copyright (e.g. "Copyright (c)2016 IEICE")
Reference
Azzuhri, Abdul Adhim et al. (2018). “A Creative, Innovative, and Solutive Transportation for Indonesia with Its Setbacks and How to Tackle Them: A Case Study of the Phenomenal GOJEK”. In: Review of Integrative Business and Economics Research 7, pp. 59–67. URL: http://buscompress.com/uploads/3/4/9/8/34980536/riber_7-s1_sp_h17-051_59-67.pdf
Bluehost (2016). Web Analytics for Beginners - Presented by Bluehost. Youtube. URL: https://youtu.be/PnVZ7_OA7Qo.
Dentzel, Zaryn (2013). “How the internet has changed everyday life”. In: BBVA OpenMind:" Ch@nge. URL: https://www.bbvaopenmind.com/en/articles/internet-changed-everyday-life/
Hsu, Ting-Chia, Shao-Chen Chang, and Nan-Cen Liu (2018). “Peer Assessment of Webpage Design: Behavioral Sequential Analysis Based on Eye Tracking Evidence”. In: Journal of Educational Technology & Society 21.2, pp. 305–321. URL: www.jstor.org/stable/26388409
Huang, Jeff, Ryen W White, and Susan Dumais (2011). “No clicks, no problem: using cursor movements to understand and improve search”. In: Proceedings of the SIGCHI conference on human factors in computing systems. ACM, pp. 1225–1234. DOI: 10.1145/1978942.1979125.
IEICE (2015). IEICE Provisions on Copyright. IEICE. URL: https://www.ieice.org/eng/copyright/files/copyright.pdf.
Leiva, Luis A and Jeff Huang (2015). “Building a better mousetrap: Compressing mouse cursor activity for web analytics”. In: Information Processing & Management 51.2, pp. 114–129. DOI: 10.1016/j.ipm.2014.10.005.
Linawati, Linawati, NMAE Dewi Wirastuti, and Gede Sukadarmika (2017). “Survey on LMS Moodle for Adaptive Online Learning Design”. In: Journal of Electrical, Electronics and Informatics 1.1, pp. 11–16. DOI: 10.24843/JEEI.2017.v01.i01.p03.
Martín-Albo, Daniel et al. (2016). “Strokes of insight: User intent detection and kinematic compression of mouse cursor trails”. In: Information Processing & Management 52.6, pp. 989–1003. DOI: 10.1016/j.ipm.2016.04.005.
Ookla (2020). Speedtest Global Index. Ookla, LLC. URL: https://www.speedtest.net/global-index.
Paturusi, Sary DE, Yoshifumi Chisaki, and Tsuyoshi Usagawa (2012). “Development and Evaluation of the Blended Learning Courses at Sam Ratulangi University in Indonesia.” In: International Journal of e-Education, e-Business, e-Management and e-Learning 2.3, p. 242. URL: http://www.ijeeee.org/Papers/118-CZ02027.pdf
Pixley, Tom et al. (2000). “Document object model (DOM) level 2 events specification”. In: W3C recommendation, November. URL: https://www.w3.org/TR/2000/REC-DOM-Level-2-Events-20001113/
PrivacyPolicies.com (2020). Privacy Policies are required by law. PrivacyPolicies.com. URL: https://www.privacypolicies.com.
Purnama, Fajar (2017). “Portable and Synchronized Distributed Learning Management System in Severe Networked Regions”. MA thesis. Japan: Kumamoto University. URL: https://0fajarpurnama0.github.io/masters/2020/09/05/master-thesis-fajar-purnama
Purnama, Fajar (2019). 0fajarpurnama0/Real-Time-Online-Mouse-Tracking-Animation. Github. DOI: 10.5281/zenodo.2589338. URL: https://github.com/0fajarpurnama0/RealTime-Online-Mouse-Tracking-Animation.
Purnama, Fajar, Alvin Fungai, and Tsuyoshi Usagawa (2016). “Demonstration on Extending The Pageview Feature to Page Section Based: Towards Identifying Reading Patterns of Users”. In: 7th International Conference on Science and Engineering. Yangon Technological University, pp. 304–307. URL: https://0fajarpurnama0.github.io/masters/2020/05/25/extending-the-pageview-feature-to-page-section-based
PURNAMA, Fajar and Tsuyoshi USAGAWA (2017). “Incremental Synchronization Implementation on Survey using Hand Carry Server Raspberry Pi”. In: IEICE technical report 117.65, pp. 21–24. URL: https://0fajarpurnama0.github.io/masters/2020/05/29/rsync-rdiff-moodle-backup-restore
Purnama, Fajar and Tsuyoshi Usagawa (2020). “Using real-time online preprocessed mouse tracking for lower storage and transmission costs”. In: Journal of Big Data 7, pp. 1–22. DOI: 10.1186/s40537-020-00304-x.
Purnama, Fajar, Tsuyoshi Usagawa, Royyana M Ijtihadie, et al. (2016). “Rsync and Rdiff implementation on Moodle’s backup and restore feature for course synchronization over the network”. In: 2016 IEEE Region 10 Symposium (TENSYMP). IEEE, pp. 24–29. DOI: 10.1109/TENCONSpring.2016.7519372.
Purnama, Fajar et al. (2016). “Introductory Work on Section Based Page View of Web Contents: Towards The Idea of How a Page is Viewed”. In: 11th International Student Conference on Advanced Science and Technology (ICAST). Kumamoto University, pp. 9–11. URL: https://0fajarpurnama0.github.io/masters/2020/05/24/introductory-section-based-page-view
Purnama, Fajar et al. (2017). “Hand Carry Data Collecting Through Questionnaire and Quiz Alike Using Mini-computer Raspberry Pi”. In: Proceedings of the International Mobile Learning Festival 2017: Mobile Learning, Emerging Learning Design & Learning 2.0, pp. 18–32. URL: https://0fajarpurnama0.github.io/masters/2020/05/30/hand-carry-server-survey
Purnama, Fajar et al. (2020a). Data for: Implementation of Real-Time Online Mouse Tracking Case Study in a Small Online Quiz. Mendeley Data, v3. DOI: https://doi.org/10.17632/vznyfcx9xk.4.
Purnama, Fajar et al (2020b). “Implementation of Real-Time Online Mouse Tracking on Overseas Quiz Session From Server Administrator Point of View”. In: Education and Information Technologies (forthcoming), p. 36. DOI: 10.1007/s10639-020-10141-3.
Rheem, Hansol, Vipin Verma, and D Vaughn Becker (2018). “Use of Mouse-tracking Method to Measure Cognitive Load”. In: Proceedings of the Human Factors and Ergonomics Society Annual Meeting. Vol. 62. SAGE Publications Sage CA: Los Angeles, CA, pp. 1982–1986. DOI: 10.1177/1541931218621449.
Rodrigues, Manuel et al. (2013). “Keystrokes and clicks: Measuring stress on e-learning students”. In: Management Intelligent Systems. Springer, pp. 119–126. DOI: 10.1007/978-3-319-00569-0_15.
u, u-double (2020). SPEED-BATTLE statistics and browser comparison: Windows NT 10.0. u-double-u. URL: http://www.speed-battle.com/statistics_e.php.
UNESCO (2020). COVID-19 Educational Disruption and Response. UNESCO. URL: https://en.unesco.org/covid19/educationresponse.
Wood, Lauren et al. (1998). “Document object model (dom) level 1 specification”. In: W3C recommendation 1. URL: https://www.w3.org/TR/1998/REC-DOM-Level-1-19981001/
Mirror

...and you will also help the author collect more tips.