Scalping is a trading strategy that specializes in profiting the small price changes, making a quick profit off reselling. In a day trading, scalping is a term of a strategy which prioritize making high volumes off small profits.
Traders should have a best strategy exit because in scalping it comes with higher risk that can easily wipe off those small profits.

Disclaimer: All written is based on experience, and this is not financial advise before applying the strategy make sure to back test it many times. DYOR & TAYOR.
First post shared at noise.cash
Second post shared at noise.cash
I've been back testing it live at Binance for two days in a row and the probability of the strategy is almost 95% as long you enter and exit properly. You can check my short post about this at noise.cash on the above links provided.
I used BINANCE in this because they have the indicators that I used.
STRATEGY INDICATORS;
EMA (Estimated Moving Average) - 20, 50, 100
MACD ( Moving Average Convergence Divergence)
RSI (Relative Strength Index) - 13, 50
VOLUME
TF (Time Frame) - 1m (1minute)
Leverage - 10-20x only
How to Set up the indicators
EMA (Estimated Moving Average)

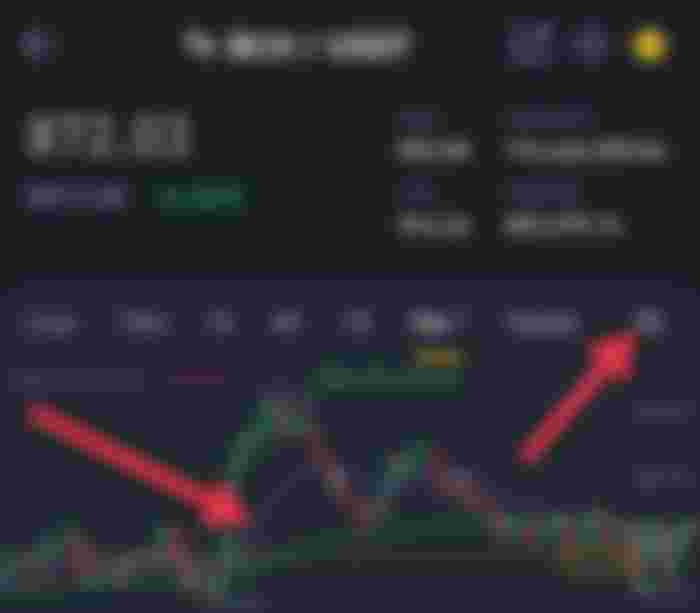
That is how EMA looks like with three line with 20, 50, and 100 value per MA (moving Average). Just Click the second arrow for setting options.

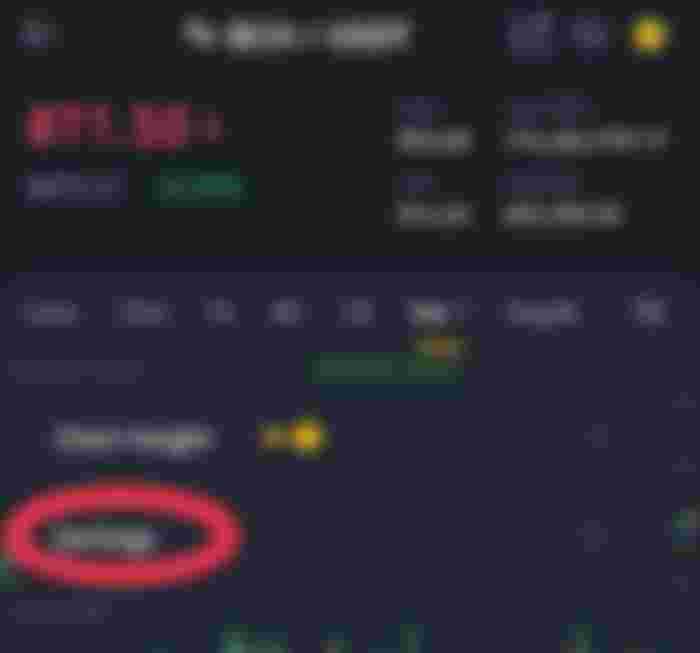
Once you click the arrow the two options will appear chart height for chart adjustment and Settings, just click settings.

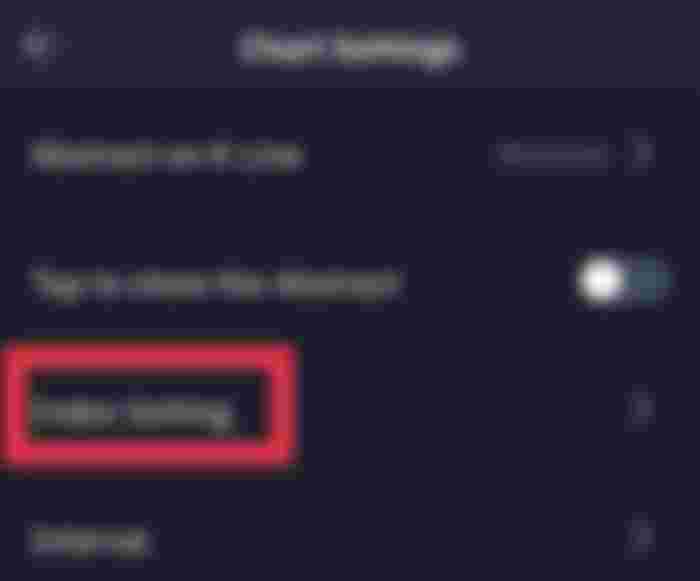
After you click settings Chart Settings will appear, choose Index Setting.

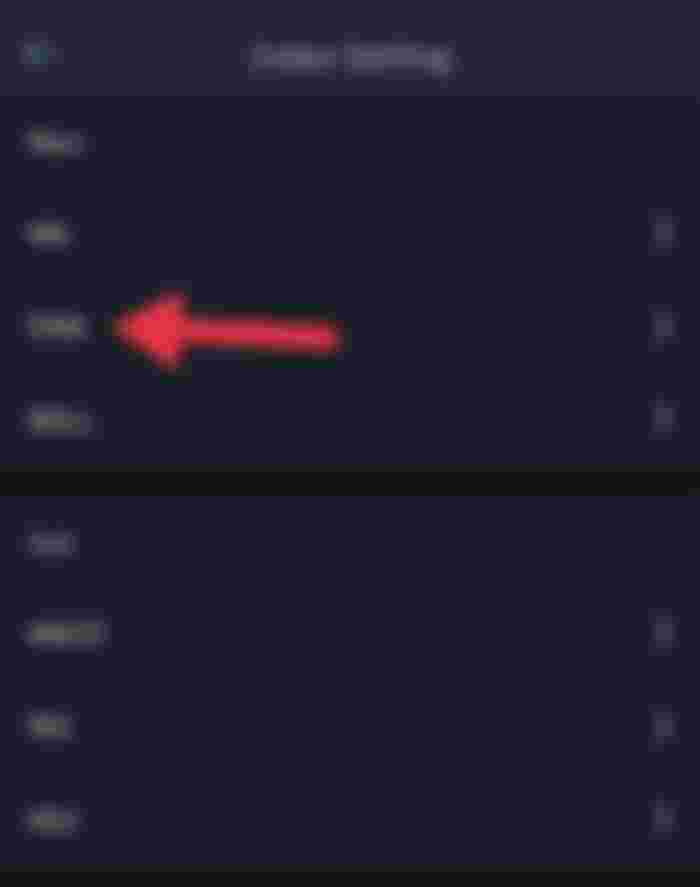
When you click Index Settings all basic indicators will appear. Choose EMA.

Set EMA1 to 20, EMA2 to 50 and EMA3 to 100. Just choose the color you prefer for them or you can copy mine. After that just click confirm. Once you confirm you can see it on the Chart.

That's how EMA looks like in the chart, you can see above the price value each one of them.
MACD (Moving Average Convergence Divergence)
To set up MACD just the same how you set up EMA. Follow the first steps then chose MACD.

After you choose MACD just set their value, DIF 12, DEM 26 and MACD 9. But I think this is already a default settings, if not on you then just change it then chose your color preference and confirm.

After you confirm the set up will show in the chart and that's how it looks like.
RSI (Relative Strength Index)
As usual do the first steps click settings then chose RSI.

In this set up I used RSI2 and 3. For RSI 2 set it to 13 and for RSI3 set it to 50. I dunno why I skipped RSI1 but I think that's what I saw in the video and RSI 13 is accurate to detect how the price action moves.

After you set RSI it will appear on the chart, showing the value and it's corresponding grade.
Volume

For volume, you don't have to set it up it's automatic just tap VOL below to let it appear on chart, the volume indicates the volume of buyers and sellers, when it's green it means buying, while the red for selling pressure. The higher the bar in volume the higher the pressure wether it's buying or selling depending on the color shown in the chart.
Applying all in one chart

That's how it looks like when it was all applied in one chart, just tap all indicators below, EMA , VOL, MACD and RSI.
Then tap MORE on TF (time frame) above and choose 1m.
You already set up the strategy I used in scalping. I did this for those who does not know yet how to set up indicators. On the next article will be, how to used this indicator of mine.

If you read my short post at noise (the link is provided above), I started the other day to back test the strategy live with a total margin of $35, upon posting it's already $74. While as of writing this article It's already $89.48, if you deduct my total margin which is $35, I already have a profit of $54.48, running 3 days in a row. Not bad earning $20 per day for a NOOB trader lol.
I will share on the next article how to apply it, but I will remind you DO NOT DO IT IF YOU ARE NOT CONFIDENT, TOO RISKY! 1 minute Time Frame is very volatile, it is the time frame that is very close to the current price. Also DO NOT USE HIGH LEVERAGE for your safety small movements of candlestick will rekt you directly if you use high leverage, I started it with 10x then when I am confident enough I adjusted it to 15-20x but I don't go higher above 20x.
Back test it many times with the previous price, and please invest on knowledge first before jumping on it.
Related Article:
Basic Trading Indicators For A Noob Trader
See you in the next article if you are interested!






Set na... Thank you sis for sharing. I am going to study this... Maybe one of this days I'm gonna risk este try trading when I am good enough. 😊