Trading cryptocurrencies can be a really complex and time-consuming task. There are many differences between traditional trading of stocks or forex and cryptocurrencies. While you can start trading cryptos with very little capital, you can also lose your investment much faster as the cryptocurrency market is far more volatile than the traditional one.
It can be really hard for beginners to start trading cryptocurrencies as they need to learn many different concepts at once and that can be overwhelming. Today we are going to discuss a few easy tips, tricks and strategies that will help you start trading cryptocurrencies.
Focus on Price Action
This first ‘strategy’ might seem counterproductive to the next few ones but it’s really important for beginners and advanced traders really, to focus on price action and not use dozens of technical indicators at once.
Technical indicators are one of the best tools for traders and they can help you confirm trends, patterns, etc, however, they can also be confusing. For instance, there are many technical indicators that are based on basically the same parameters which means that they will indicate pretty much the same thing.
You can also find plenty of technical indicators contradicting each other, for example, the RSI (Relative Strength Index) might signal to buy while the EMA (Exponential Moving Averages) might signal to sell.
Price action is basically the concept of looking at the price itself through the use of candlesticks mainly. Candlesticks alone can provide you with enough information about the current trend, future possible trends, patterns, etc. You should definitely use price action in conjunction with technical indicators but you must always prioritize price action.
Trading Volume
Trading volume is one of the best technical indicators in the cryptocurrency market, it is far more important here than on traditional stock markets. Just to showcase how important it is, take a look at a few cryptocurrency gainers today on Coinmarketcap. You will probably find cryptos going up 40-50% even more in just one day, however, their trading volume will probably be a few thousand dollars or even less.
This basically means that someone bought all open buy orders and managed to pump the price by himself. This can happen with major cryptocurrencies too. For example, recently, Bitcoin price broke above several important support levels and the $7,000 level, however, trading volume remained pretty much the same. This is an indicator that not that many people are selling, which means that selling pressure is not as high as it may seem and a bounce might be on the way. Bitcoin went on to bounce back up to $7,400 after bottoming at $6,400.
The RSI Strategy
RSI stands for Relative Strength Index and it is used to determine when an asset has been oversold or overbought. It usually ranges from 0-100 points and anything above 70 is considered overbought and below 30, oversold.
This strategy is pretty straightforward although it doesn’t always work. It can be applied to any timeframe, the daily chart, hourly, 5-minutes, etc but it works best on longer timeframes.
Bitcoin’s RSI on the weekly and monthly charts is usually pretty stable so it’s almost impossible to use it there as an indicator to buy or sell. The best time frames are the daily and 4-hour charts.

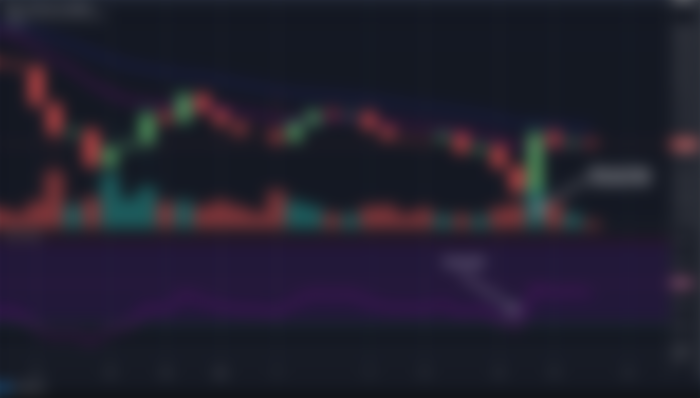
BTC/USDT Weekly Chart, RSI Pattern Example
A few days ago, Bitcoin’s RSI was in the oversold zone below 30 points which indicates that it’s a good time to buy. Only a day later, Bitcoin jumped to $7,440 from $6,435.
Equilibrium Pattern Strategy
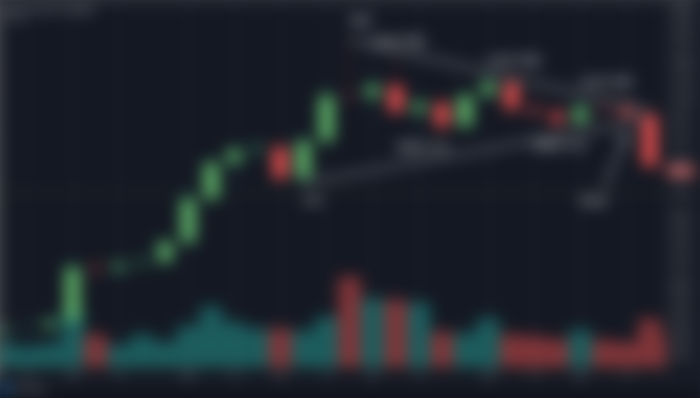
This is also a pretty forward strategy and pretty reliable although the pattern itself doesn’t form too often. An equilibrium pattern happens when an asset form a higher low followed by a lower high and can continue forming the same pattern many more times until it finally breaks.

BTC/USDT Weekly Chart, Equilibrium Pattern Example
The break of this pattern is usually followed by a violent move in that direction. A break happens when the last lower high or higher low is broken but fakeouts can still occur. This pattern is stronger when the time frame is longer, for example daily equilibrium patterns are considered reliable but you can also find weekly equilibrium patterns and even monthly equilirbiums. The longer the time frame, the more reliable the pattern is.
Conclusion
When it comes to trading cryptoccurrencies you have to remember to not be influenced by herd mentality and and avoid FOMO at all costs. To become successful trader, the top priority for you is to always follow a well-structured plan, manage your risk, diversify, and above else stay positive.
Happy Trading!
If you're looking for general information about cryptocurrency, crypto news, tips, guides, strategies, fintech, new technologies, trading space, crypto investments and many more? MyCointainer Insight is the place to go. Visit MyCointainer Platform also feel free to sign up for our Community so we can make impact together.
Follow MyCointainer on Twitter or Instagram and check out our Telegram channel.
MyCointainer community and I remain at your service if you have any questions
See you soon
Christophe WILHELM
Published with the agreement of MyCointainer
Credits photo : https://www.mycointainer.com/
Resources


