If you haven’t viewed Forex as a magical treasure chest yet, now would be a good time to treat it as such. And in heading towards the direction of this seemingly magical wealth-making portal, you need to have some kind of map to guide you.
As mentioned in the previous pages, you need to be able to view graphical charts and interpret them accordingly so you can attain the profits you greatly desire. The key to understanding the visuals that can tell us the direction of the currency market is by knowing about candlestick charts.


Popularized by an 18th-Century Japanese rice trader named Munehisa Homma, candlestick patterns are what traders deal with every day so they can take the appropriate course of action of whether to buy a certain currency or sell it. Simply stated, your knowledge in interpreting the patterns in the candlestick screens will determine how profitable you’ll be as a Forex trader.
The ability to view the kind of chart that we are about to discuss will make you absorb the idea of how any currency and the pairings that tie them together. At first glance, a candlestick chart may appear as an array of colorful lines that don’t make any sense. But if you can truly grasp what those lines represent, it will surely ignite your interest because they can actually improve your financial status in ways you never thought possible.
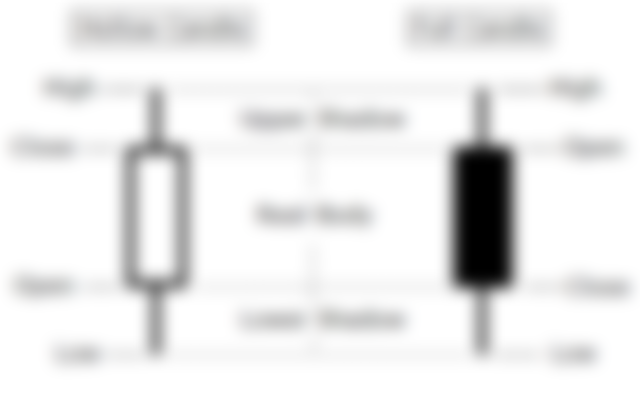
The anatomy of the candlestick chart
Basically, there are 3 main parts that comprise a candlestick: the open price, the closing price, and the shadow. A typical candlestick exactly looks like a candle or a stick of dynamite with string fuses on both ends. The main body of the candlestick could be either red or green: red meaning downward direction, and green which means upward direction.
So when a series of candlesticks appear green for a certain duration, it means that a certain currency pair is rising in value. Traders often call a green candlestick “bullish” as attribution to a raging bull. Red candlesticks on the other hand are referred to as “bearish” as they are viewed to be sluggish as a fat bear.
It is important to note though that the red or green color could also appear different depending on the settings of your on-screen chart. There will be times when the colors don’t actually matter. You just have to identify what color actually represents the upward or downward direction.
But to make it easier for you, viewing the line that connects all the candlesticks on your screen can also help you. If the line has been going down for a certain duration, all the candlesticks on it would be surely red. Conversely, if the line has been going up steadily, all of the candlesticks on it would be surely green. So when a red figure appears next to a green one, it is an indicator that the value of the currency you’re buying or selling would go down.
Viewing a set of candlesticks is done by choosing a certain timeframe. You can make your screen show a series of candlesticks per minute, per hour, per day, or per month. How you will choose such settings should be dependent on your chosen trading strategy. The good thing about candlestick screens though is that you can instantly switch from one kind of view to another in just a few clicks.
If you chose an “hour view” of a chart, you can just treat the bottom portion of the first candlestick as the first open price of that hour, while you can treat the bottom portion of the last candlestick as the closing price of that same hour. Knowing about such points in the entirety of a trading chart is very crucial since it will be your basis for when to proceed with the buying or selling move.
How to trade using candlesticks
Candlesticks have been known to behave in a certain way when prices of currencies move over the years. There have been a number of documented patterns and established behaviors that a novice trader like you can greatly take advantage of. By understanding them, you can make predictions as to how a certain scenario would get executed.
In Forex, we should be always looking for points and directions where we can be consistently profitable. We should always put our money where risks are at their lowest rate of occurrence. Using the patterns that candlesticks show will make you enter into high-probability trades and get out from obviously losing ones.
Like a highly analytical detective, you must be able to look at the entirety of clues, not just on a small portion of a chart which would often make you execute the wrong decisions. Just because you’re seeing lots of green candles on your screen doesn’t mean it will always be like that for the rest of the hours in your chosen time frame.
The reds and the greens should be understood as the best indicators to buy or to sell: green means sell while red means buy. If you are seeing the currency pair you chose as red for a certain period, it would be a good time to buy it, the longer the time the green candles appear, the higher the price of a currency will be if you choose to buy it.
In reading charts, you need to point out the reversal patterns in them. They can be easily understood as the highest point that a series of green candles can reach, or the lowest point that the red candles can go down into. The wisest traders often make a decision based on series of charts, not just on a series of a few candlesticks.

The wisest trading decisions can only be done if you can have an understanding of what happened during the previous moments either in minutes, days or weeks. Though predicting the market in laser precision is impossible, it is very possible to make near-accurate speculation about how it will probably behave for a day or a week.
Though candlestick is nothing but squares and elongated triangles, they actually tell stories. Such stories are behind the buying and selling decisions that Forex traders all over the world make every minute. Though they can’t really tell us exact information about who those buyers are, candlesticks can actually tell us the clear and direct effects of their trading acts. We can say that candlesticks tell us if there are more buyers than sellers or the other way around.
If there are more buyers for a particular currency, it means the price for it would rise. If there are more sellers, then it would follow that the price would drop. It’s just a simple law based on supply and demand. In order for you to become profitable with your trading, you need to master a skill that revolves around this.
Here's the previous part of this article series: