USDCHF Bulls Inverse Head and Shoulder Attempts
I been following USDCHF's price action for 2 weeks now. The recent overnight support break-down on 0.9780 during late US session paved way to re-test September 6 support forming 2 local double bottom clusters. This gave a short relief allowing the bulls to take over after a strong sweep off low move.
Suspecting that the bulls must re-test the 0.9810-20 range first creating an inverse Head and Shoulders pattern on the hourly chart where this range plays a vital neckline to the next price direction.
After USDCHF revealed where its weekly supply zone, I bet to short the rally attempts within the 0.9810-20 range. This is my trading plan today Thursday till Friday until I see some adjustments. For now price tries to consolidate within the double bottom clusters and any lower prices will be bought. If hits, gives me a 3.114 risk:reward score.
Original article written by me:
https://www.finlogix.com/analysis/20220908/usdcad-bulls-inverse-head-and-shoulder-attempts
The article has a wrong title, it should be USDCHF not USDCAD. Thanks!

Trading Cup 2022 Trader Spotlight – Staggering Performance of 1600% Gains
In today’s blog, we highlight a trader’s performance in our ongoing Trading Cup 2022 trading contest who amassed a staggering 1600% gains during the month of July.
We uncover how this trader achieved these stellar gains, the strategy used, the trading instruments selected and more.
My goal here is to deliver the highlighted trader of the month, his key strengths and weaknesses, and how he handled his drawdown periods.
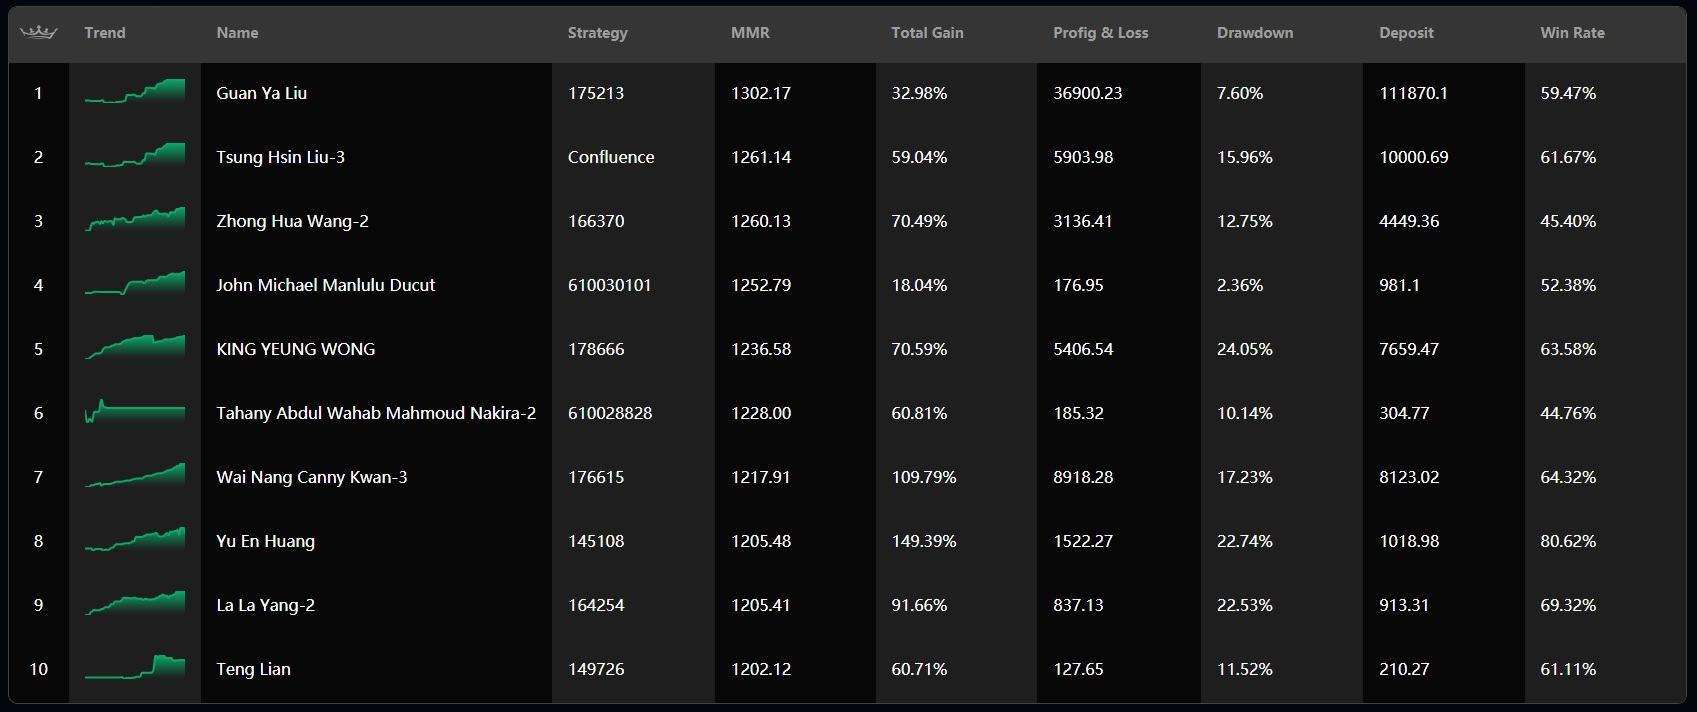
The Trading Cup leaderboard updates regularly so you can see the top 10 traders competing their results and our statistics section showcases their key trading metrics to give you insights into their strategies.
You can check out the live stats through the Trading Cup homepage **https://www.tradingcup.com/en**.
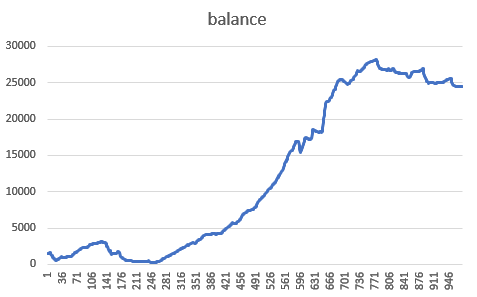
In today’s trader profile, I’ll be reviewing Peter Smith. In particular, we are looking at Peter’s ability to turn his starting balance of $1,500 to a whopping $24,000 in the month of June 2022. And yes, he achieved the 1,600% return in just one month.
He performed a total of 977 trades across different trading instruments including:
**AUDUSD** https://acy.com/en/market/audusd
**GBPUSD** https://acy.com/en/market/gbpusd
**USDJPY** https://acy.com/en/market/audjpy
**China50**
**HK50**
**JP225** https://acy.com/en/market/jp225
**NAS100** https://acy.com/en/market/nas100
**Oil** https://acy.com/en/market/wti
**Gold** https://acy.com/en/market/xauusd
Indeed, an interesting mix of instruments.
Most of his largest wins were focussed heavily on the UK Brent.
In fact, these typical large trades profited an average of $500 per trade comprising 19% of his final PnL (Profit and Losses Equity).
He held his drawdowns very well.
His biggest win was $710 while the biggest loss was $583!
In total, his average gain across all 977 trades was $23.48 including 4 break-even trades and 260 losses.
The fact that he won 713 out of these total trades is mind blowing! Such a high win ratio with an excellent drawdown control. What a trader!
Here is a break-down of his full monthly trading statistics:
**Total Trades: 977**
**Break-even trades: 4**
**Loss trades: 260**
**Won trades: 713**
**Win rate: 73%**
**Average gain on wins: $54.30**
**Average loss on losses: -$60.67**
His average loss on failed trades was slightly higher than his average gains on his wins. This is a clear example of good drawdown control of a highly skilled trader knowing his starting balance is only $1,500.
Famous trading quotes can be seen through this trader **‘keep your losers small while your winners big’**. Would you agree?
Some of the questions that sprung to mind when reviewing his statistics were:
**Does he use algorithmic trading strategy?**
**How much leverage was he using?**
To answer these questions, we extract the major trades that delivered the bulk of his success.
To find out more about algorithmic trading, you may visit this blog **https://acy.com/en/market-news/education/expert-advisors-benefits-forex**. Also, leveraged trading helps traders but can be risky, please read this article **https://acy.com/en/market-news/education/forex-leverage-explained-margin** to know more of its mechanics.
In his first 100 trades we can see small trading volumes averaging 0.25 per trade only. On a AUDUSD position, this would equate to $25,000 per trade, which is quite large relative to a balance of just $1,500.
From this data, he has a mixed results of wins and losses. He must have been testing the markets first before deciding to increase his position size.
Gaining confidence over time, he then increased his trading volume in the next trades until he finished July’s journey with an average of 1.57 lots per trade but he reduced it to 0.28 in the last 242 trade executions.
You could suggest that when he had a high conviction on a trade setup, he increased his position size, but knew when to pull back when his trading strategy was less favourable.
His smallest trading volume was 0.01 while the largest was a staggering 15 lots.
On an account of this size, it would be fair to say he is overleveraging, taking on massive risks. And fortunately for him, this led to strong gains during that period.
It is important to understand that trading at this level of leverage is beyond risky and not recommended.
Let’s go back in time and take a sneak peak in to some of his prominent trades that show his overall strengths primarily on the UK Brent.
UK Brent hourly chart via **ACY MT4** https://acy.com/en/platforms/mt4
This is his biggest win, gaining a total of $710. I can see he did not place a stop loss or take profit, which indicators he was closely monitoring the trade as the trade progressed.
Instead, he placed at a market trade, hitting the order book after he saw confidence on the immediate resistance and support areas on the hourly chart.
In light of this, you might consider him an experienced trader. This trade is perfectly orchestrated quickly within the hourly candle.
How? This trade duration only lasts for 3 minutes. Astounding!
Meanwhile, below shows his biggest blunder during the period.
UK Brent hourly chart via **ACY MT4** https://acy.com/en/platforms/mt4
This adds more support of my claim earlier that he is an experienced trader, why?
3 reasons:
He knows what is coming for the trading instrument, he speculated the nearby support would hold.
But the trade entered volatility through a support breakdown within the same hour. Totally went in the opposite direction. Then after 2 hours of holding, he decided to trade the price action as a fail of support. Then closed at 100.609 wasting no time. This trade cost him $583.20.
If you noticed closely, this chart happened first than previously. The lesson we get from here? He managed to win the next trade on the very same instrument getting a net profit of at least $126.80. Turned the tides in his favor. This can be a sort of **revenge trading** but does not happen all the time. Only experienced traders can do this. https://acy.com/en/market-news/education/my-top-5-trading-mistakes-you-must-avoid-125815
Based from these trades, I assume he made use of leverage and applied the basic skills in locating where the immediate support and resistance levels are.
Again, I say he knows what he’s doing and understands the high risks involved in using leverage. I think he traded manually without using any Expert Advisor (EAs).
Congratulations to this trader who made tremendous gains in the month of July!
If you are a trader or a fund manager, showcase your trading skills by joining the **Trading Cup 2022 competition**! https://www.tradingcup.com/en/mmr
With its latest addition of an **MMR system**, making sure every participating trader has equal chances thus promoting a fair contest. https://www.tradingcup.com/en/mmr
Stay tuned in our blog and social accounts for more trader spotlights and always remember that trading involves risk.
Original article written under my name here: https://news.tradingcup.com/en/news/trader-spotlight-staggering-1600-percent-gains
Long-term Overselling Fears Might Form GPBUSD's Next Historical Lows
*Image credits to:* *https://www.dailyfx.com/*
The Sterling might yet to find a footing against an ever more hawkish Greenback on a day to day basis!
If I were to diagnose GBPUSD's health right now, definitely, it is not feeling well based on what I'm seeing.
This analysis is more of a forecast than a signal as I'm trying to escalate what is going to happen with the Cable's price action against the unstoppable Greenback.
Although that was the intended case, any short-term trading plans can still be made based from these findings that I'm going to uncover.
Last Friday, I have witnessed one of the nastiest price volatilities in my Forex markets' observations.
The news was heavily sold in US dollar's favor. Markets reacted in a volatile fashion. USD bear pairs feasted upon Chair Powell's recent Jackson Hole's speech declaring they won't stop until the inflation is tamed!
Escalating Fed's additional 75 basis points making a total of 2.50% interest rate is a convincing stomping of feet against all USD trend reversal odds.
Greenback's rival currencies have no other way but to endure more bearish nosedives ahead.
At the time of writing this article, the DXY index printed a fresh multi-year high by intraday's upside outburst. The Greenback have entered levels that were never seen since October 2002 and already marching towards September highs of the same year.
Looks like the major rivals including the British Pound are going to extend their bear markets against the dollar respectively.
With the Euro's continued weakness, another Forex major currency needs to step up and challenge the king dollar! That could be the Aussie as it looks like it has some cards to fight back.
The Sterling's deteriorating health at the moment is clearly out of the picture to fight the dollar.
After a fresh swing low printed Tuesday last week, that could have been the long-term bearish continuation sign if short sellers paid more attention but no one have thought that might be only few.
Should GPBUSD ended its previous week's candle in green, specifically a hammer after the fresh swing low print, that could have supported the sudden upswing on Friday's trading and then we have the right to call that was the bottom.
Instead the reverse happened! Big thanks from the Fed's Chair more hawkish tone in his Jackson Speech the same day. With USD's next instance target to seek more value around September 2022 levels, the previous week high might be GBP's pinnacle and the last valuable price against the former for many weeks, months or years to come. Who knows!
On the other hand, noting Greenback's recent peak into consideration, it may commence a quick pullback or more correction time before next leg upward as August comes to a close.
Fed will continue to push higher interests at all cost putting any GBPUSD bullish bias in jeopardy.
What I'm looking for is a pattern that will potentially lead GBPUSD into its next historical third higher low based on connecting the February 1985 and March 2020 monthly bottoms.
I bet a long entry at 1.1483 as it intersects well inside the third HL buy zone, this can take a lot of time to be hit but can be worth the wait. A continued surging US dollar and a strong market volatility would support this scenario!
Just in case this long plan be triggered, I give a 300-pip take profit to 100-pip stop loss risk management. A 3:1 RR score.

Oil Bulls Facing Some Challenge On The 23.60% Fib Level
*Image credits:* *https://www.tradingview.com/*
I have been reading a lot of news including rumors that Oil may resume its uptrend soon. I have some reliable sources but I will not share it here. Instead, I focus my attention on the charts and technicals like I normally do. I have to make my own ways of investigation through technical analysis.
I’m proud to say that I made a huge long call for Oil last year noting a potential price surge back to 3 digits, a hundred dollars, and it is realized the following year by February 2022. You may read that call through the link below.
https://read.cash/@rafaelken1989/wti-oil-long-can-the-345-week-old-long-term-resistance-turn-into-a-support-6e985c18
Of course, we cannot be right all the time with our TAs but it does not matter, speculations are free and can be endless. Although, I’m vocally sharing my thoughts regarding Oil through my social accounts, I must write a new one for formality’s sake.
So here I am again back to the Oil after 9 months. Consider this article as an update to where I left but this time I look at the Oil’s price in mid-term view only.
In the last 7 weeks, Oil has been strongly exchanging hands in the lower Bollinger band’s territory. Just a small recap, yesterday’s dips were heavily bought by strong picking up of volumes across the faster timeframes. I want to add also that Oil printed a new weekly swing low and extended the weekly falling wedge pattern from Oil’s peak last March this year. That’s our reference point for this pattern and over time, the price may bound to create lowering highs and lowering lows as validation.
As much as possible, I try to keep this analysis simple and straight-forward. Like I mentioned earlier, I’m looking for a mid-term trade setup.
What caught my attention is Oil’s two fib retracement levels that are perfectly coincides the probable extension of the falling wedge. The two retracement levels are 23.60% and 38.20% respectively. I highly assess that if Oil’s going to consolidate, these levels will act as short-term range boundaries.
Without further ado, my mid-term trade plan for Oil will be a short to the obvious entry at the 23.60% fib. This time around, I will be short for Oil. Should price rejects, my take entry level at the 38.20% fib plays out. However, if price accepts, the bulls will push price back to the 3 digit levels and near the weekly middle band. That’s my stop loss over there and an overall risk:reward score of 2.286.

Bitcoin Weekly Bear Flag's Next Short-term Sell-off Trigger
*Image source:* *https://www.dailyfx.com/bitcoin*
The purpose of writing this latest analysis is to share my technical thoughts when another bearish price action prevails for the cryptocurrency leader Bitcoin.
This week, I’m looking for a potential short-term selling setup for Bitcoin but the question is, where’s the trigger?
To find that, it is important that we still consider the ongoing weekly and monthly downtrends to gather confluences for this trade.
One of the leading factors that halted Bitcoin’s rally is the hawkish Greenback. Bitcoin ended last week’s trading in red and the chance for this trade plan will be verified by a double weekly candle bottom manifestation with oversold indicators from the quicker/smaller time stamps. Should this scenario plays out, next immediate resistance awaits at the $23,150 level. That’s my short entry over there.
Keep in mind that volatility can strike anytime this week through Bitcoin’s faster time frames. Watching for further development on BTCUSD’s recent flag formation that has been formed by its huge June bear month serving as the pole.
At the time of writing, price have already back tested both the bottom range of Bitcoin’s bear flag as well as last week’s low. The higher high and low ranges are still intact. At least price are locked in the hidden range bounds, still part of the bear flag formation though. With flat highs and lows shown in the last 5 weeks or so.
Also, I find it interesting that both pivotal levels of this hidden ranges and the weekly bear flag itself are near to each other supporting my short entry mentioned earlier.
A clear price break above these pivotal levels will open the upper territory and might entice the bulls. This move will make the recent shorts on Bitcoin lows last week cover their positions so I’m thinking to put the stop loss in the $24,200 mark. However if price gets rejected from these pivotal levels, my take profit mark will be $21,550. I want emphasise that this will be a quick shorting trade focusing the weekly bear flag development. A risk to reward score of 1.524 only.
For the worst case scenario, the June low area remains unclear! The weekly bear flag pattern has been strengthening so far and very resilient.

XRP Returned To Its Main Event Channels
*Image source:* *https://www.finlogix.com/analysis/20220820/xrp-returned-to-its-main-event-channels*
With the cryptocurrency markets’ recent sell-offs led by Bitcoin as always, I’m eyeing the XRP price trajectory once again.
Technically, to assess with the latest dips, the cross-border token just lost its pivotal range that have opened long interest for traders.
XRPUSD in support mode. Speculating for a new lower consolidation range starting from $0.32-0.36 where this can be our projected swing high and low for the next two weeks left in August.
The hidden falling wedge pattern has mutated into an imperfect symmetrical triangle from the connections last July 26 and overnight’s low. The possibilities for new swing lows can be accepted as long as the prices stayed within the main event range scopes.
Bullish thesis towards re-testing the Fib 23.60% retracement levels can still be valid once there is a convincing bounce-off support short-term.
The said retracement level was formed from the double tops last February and March 2022.
In case the imperfect symmetrical triangle formation breaks down, bears will attack the stop loss liquidity near the main support channel. I speculate this is where the best condition for a long position for traders who have waited since XRP’s price peak last August 2.
For this to happen, oversold metrics must be hit. From then on, a price reversal to the upside will be probable.
Mid-term view, the June demand this year is still a viable threat by the bears. On the long-term side, once a fresh swing low for 2022 below June comes in, may trigger a negative Fib extension levels targeting 161.80% where $0.21-0.23 range resides. The 161.80% Fib extension level is derived by connecting the June lows and July highs.
This latest trade plan for XRPUSD will have a strict stop loss placed just a little bit above from the June lows. This is where my previous XRP analysis comes in.
You may read the separate long plan with the aim of back-testing June monthly support through the link below.
https://read.cash/@rafaelken1989/xrp-4-hour-wave-e-ending-assumption-for-a-double-back-test-on-055-support-9d1c790a
The long entry kicks in near the main support channel suspecting a new round of price sideways.
An overall risk:reward score of 4.

EURUSD Suffers an Ugly Week - Bears Getting Ready for the Parity Rechallenge
*Image source:* *https://www.finlogix.com/analysis/20220819/eurusd-bears-getting-ready-for-the-parity-rechallenge*
Who could have thought that the EURUSD's parity party last month of July was over?
With mixed fundamental and technical analyses over the Forex world suggesting the Euro just had its bottom against the ever hawkish Greenback while others saying US dollar's mission to upheaval the financial markets is far from over.
And exactly just like that, the infamous dollar measured by its DXY index frustrated its bears this week! After printing a twin tower of supports last 10th and 11th of August, then the Greenback marched a 5-day rally.
The USDDXY's current weekly candle closing may have an obvious bullish outcome.
Going back to the EURUSD, when was the last time that the parity party was enjoyed? It is way back December of 2002 where the US dollar index hit its top before a bearish long-term reversal at least for that period.
This was also the time when Euro finally broken it's 3 year supply against the Greenback. The next 67 months was a total entertainment for the shared currency before it officially started its bear market against the Greenback.
The rest is history and indeed such a wonderful peat!
What I am focussing right now is EURUSD's continued bear market trajectory with the ever-hawkish world's reserve currency adding more insult to the former's injury.
Euro's August monthly candle has still some few weeks left up its sleeves for some relief streaks but I doubt it. I suppose the current month's remainder will continue to find a lower wick tail to satisfy the angry bears!
I want to capitalise EURUSD's monthly Elliot wave falling wedge structure through putting some long position around its 3-year supply region which I mentioned earlier. It is acting clearly a demand for now at least least.
At the time of writing this analysis, EURUSD is losing precious pips! Every crucial pip that is lost inspire the bears even more to rechallenge the parity!
My trading plan includes a hope for a not-so-big bearish spinning body August month candle that will help maintain the validity of the EURUSD's long-term falling wedge pattern. Technically saying, the said pattern has counter-trend attempts to reverse the situation.
From this scenario, I apply my short-term trade plan that includes putting a stop loss near the July lows but a bit lower for a fresh swing low this month can pave more ugly downward tractions, totally invalidating the long-term falling wedge!
The long entry is placed a little higher from last month's low. I also want to see a beautiful July and August double bottom candles!
For the take profit, I am looking for a 190-200 pips move once EURUSD's price volatility kicks in to the upside. The TP level is also near the newly depleted weekly support turning resistance.
The plan's risk:reward has an ambitious score of 5.406.

Get Free Bitcoin (Guaranteed in 120 days) and convert to XRP or any crypto of your choice!
**Image credits to:* *imiblockchain.com*
Hello all. First of all, the purpose of this article is to lead those people that are interested to get free small amounts of Bitcoin without putting in or investing in real money to the platform that I am going to marketize.
I do not intend to create misleading information but to aware my readers that there are still quite a few legitimate apps that offer free Bitcoins amidst the rising numbers of scams online.
Almost everyone loves free money but not everybody is willed enough to execute the steps needed. It will be just like waiting for the apple to fall into your mouth. Even free apps do exist, at the end of the day, it will be in the hands of the users' decision whether to take action or not.
All I know is that I have been using this app since 2020 and have enjoying my free share of small Bitcoins converted to XRP as my top choice.
So without further ado, here's the simple mechanics.
Please watch my 2 videos below:
This is the part 1 video showing the mobile phone process.
https://youtu.be/BVkuYhAdHKI
And this is the part 2 video showing the desktop process.
https://youtu.be/hiDCSEDLXUQ
Full details are on the videos. So I repeat, I have been using this platform since 2020 and so far it has given me free Bitcoins throughout this period.
I plan to continue using it until the platform stops giving away free BTCs. Hope it won't! ;-)
Thanks a lot for reading this short article. I hope you find it helpful. I am just trying to share my experience and that's all.
For any comments, please let me know by commenting through this article on the section below.
Have a wonderful day and God bless!

After Gold lost a critical support, will its counter-trend moves keep up?
DISCLAIMER: I am not a financial advisor nor certified analyst, and definitely not a pro trader. All contents discussed on this article are solely my own views and for trading education/entertainment purposes only. Trading and investing in Precious Metals/Commodities especially in form of CFDs are extremely risky where losses can exceed deposits. Enter with discretion. Do your own utmost researches and due diligences. The basis of this article is pure technical analysis speculation.
Image credits to https://www.dailyfx.com/
The title of my Finlogix article today is questioning the good old Gold of where it might be heading. Join me as I share my latest technical analysis on the Yellow metal. I try to get some answers on questions like is Gold’s current price action for short-term only? Or are we heading for a long-term down trend?
Gold is undeniably one of the investors’ go-to safe haven assets. A traditional choice especially in times of uncertainty like war and bigger global economic turmoil. The on-going Russian Ukraine war sounds familiar?
Personally, Gold charts can really be tough and tricky like any trading instruments. If we try to look its historic price levels, the precious metal is still clearly in a bullish market cycle! I think its current price action are just mere pullbacks given the fact that in a normal bullish market, they are healthy occurrences.
It will be foolish to say too that Gold’s rival is Bitcoin! As the latter is the digital version of the former by many market speculators. It cannot be compared! It is like comparing Crypto to the Forex markets! Of course, both are hedges against inflation and face the same rival, the US dollar which is having a slow down week and too early to tell that its uptrend rally is over. The Greenback is still having a bullish July. However, the Gold is down in 4 months after achieving a new yearly-high.
After the Gold daily chart printed a fresh 247 bars on July 21 (yesterday only), zooming out back to monthly view, I can confidently say that it is hovering near the lower boundary as support! There is a picture perfect range bounds on the XAUUSD monthly chart where August 2020’s peak as our resistance base and we saw Gold tried to re-test its all-time-high this year on March and got rejected again in similar fashion. Fractals do occur in technical analyses and although cannot exactly have the same degree, what we have witnessed recently with Gold’s July lowest is connected the drops on August 2021, March 2021 and if we include the June 2020 lows prior to its July 2020 breakout that lead to its ATH, all makes sense to me that the metal just had another long-term support back-tested by the bears.
So far it is found to be wanting and buyers were found reactive.
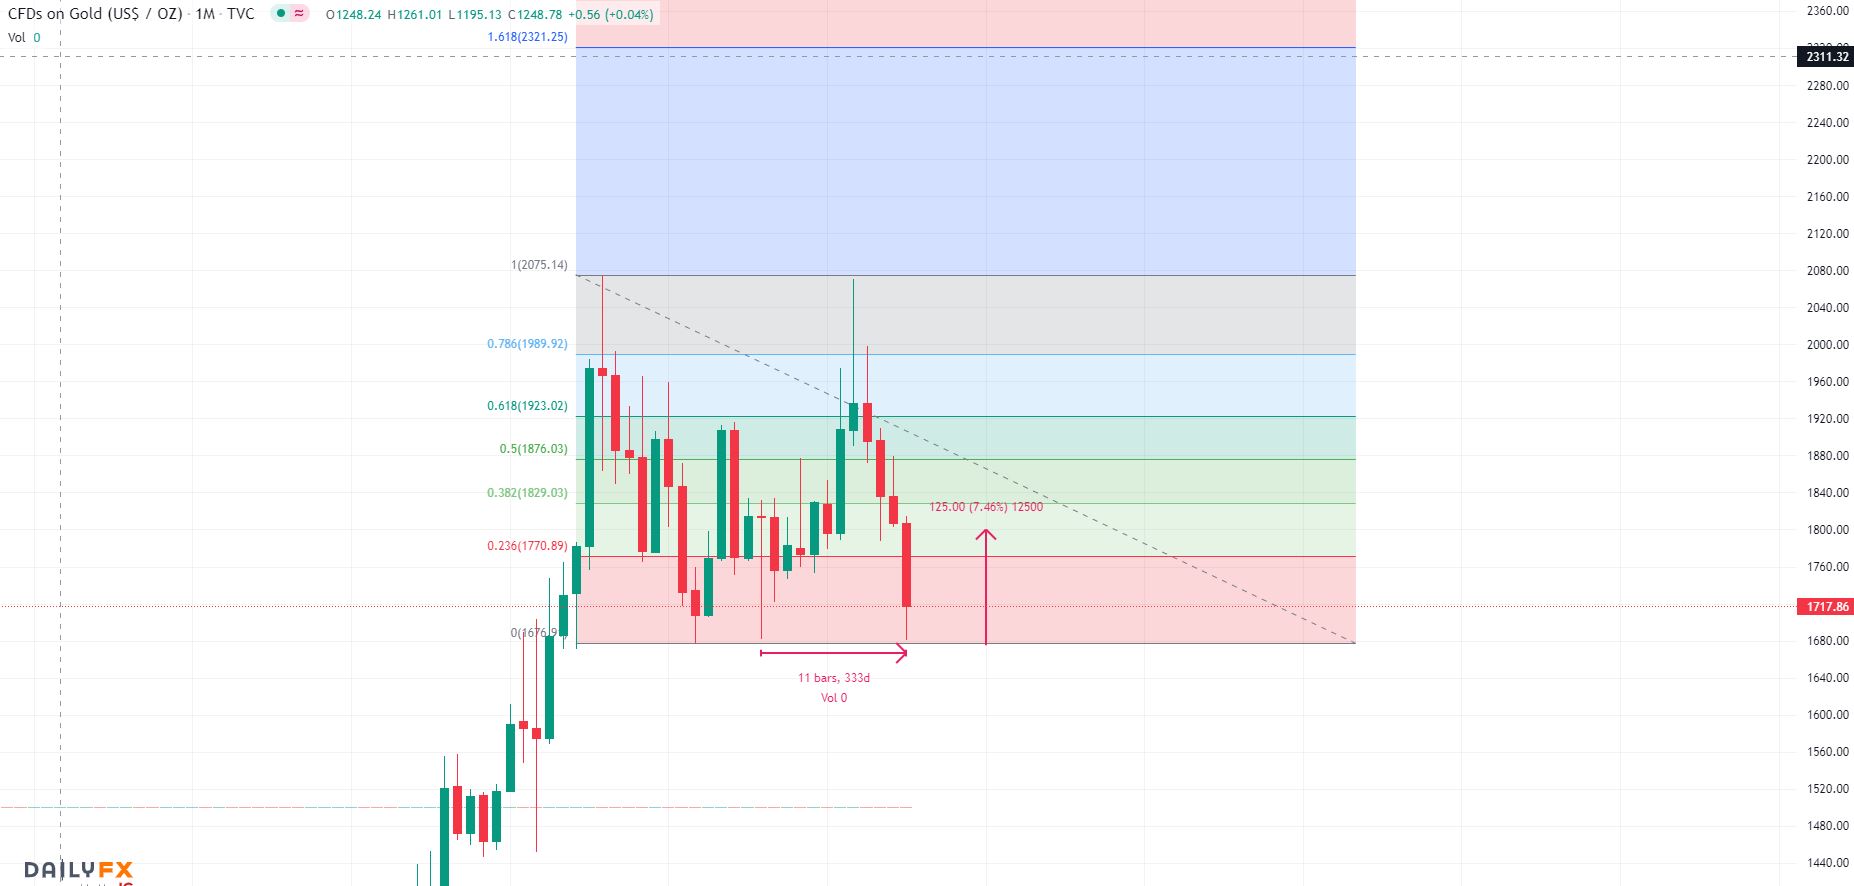
Back to the daily charts, after the critical long-term 23.60% fib support $1,770-75 levels got assassinated on July 5, strong descending parallel channels are formed creating both lowering highs and lows. Price traded in range for more than 24 hour after the fall but sellers proved to be too strong resulting for more droppings forming the said channels.
Since bearish pressures in current control now, I am anticipating a back-test on the Gold’s lower support boundaries then we consolidate. As long as we hold above these long-term supports, counter-trend attempts will have probable success.
I will put a long order at $1,675 mark and risking at $1,600 as my close stop loss. I speculate a price free fall once $1,650 is obtained and by then, the August month candle fails to make a double bottom candle structure and more southward directions! This stop loss level can be worth a try. My take profit point is at the long-term 38.20% fib level adjusted to $1,830 should Gold make a comeback. An overall risk:reward score of 2.06-7.
Original article source:
https://www.finlogix.com/analysis/20220722/will-golds-its-counter-trend-moves-keep-up
Read my previous analysis:
https://read.cash/@rafaelken1989/tesla-might-be-trapped-in-a-choppy-weekly-range-bound-trading-47b3de8c
Tesla Might Be Trapped in a Choppy Weekly Range Bound Trading?
DISCLAIMER: I am not a financial advisor nor certified analyst, and definitely not a pro trader. All contents discussed on this article are solely my own views and for trading education/entertainment purposes only. Trading and investing in stocks especially in form of CFDs are extremely risky where losses can exceed deposits. Enter with discretion. Do your own utmost researches and due diligences. The basis of this article is pure technical analysis speculation.
*Image credit to* *https://www.finlogix.com/* https://www.finlogix.com/analysis/20220719/tesla-might-be-trapped-in-a-choppy-weekly-range-bound-trading
Hello once more. This will be my first ever Finlogix technical analysis covering stocks. Today, I decided to scout one of the most popular Nasdaq index listed stock, Tesla:TSLA, whose current value at the time of writing this article is hovering above $700 a share. Almost every traders and investors know how hot Tesla can be, maybe one of the most heavily traded stocks in the world? Backed up of course by social media sentiment king, Elon Musk. He’s one of the sole reasons that meme crypto Dogecoin mooned hard last year! Crazily through the power of his Twitter posts! Memories of that event are still fresh inside my mind! It caught the attention of the entire crypto markets and resulted chain of reactions, back and forth. I cannot forget it almost hit $0.75 which many hyped coin supporters believed it will pump to a whole dollar at least! But the following day, buying pressure slowed down dramatically correcting the meme coin’s price real hard! And that’s the end of the show. Many top buyers of the coin surely shed their tears in dismay. That was really crazy days back then!
I do hope that at least I give a short history exposing Tesla CEO and co-founder Elon Musk’s influences over the market sentiment that might affect the stock itself. In fact on-going disputes between him and Twitter. As usual, I will disregard the rumors, gossips, news, and market sentiments. Whatsoever! I really believe in this phrase here, “show me the news and I show you the charts.” I rely always on charts lately and do my own way of exploiting technicals.
The trendy US dollar index has started the week bearish. Who knows that the DXY’s uptrend has concluded already or this might be mere pullbacks before next major moves higher! After reaching back its 20-year high levels since October 2002, it slowed down Thursday last week. Financial market rivals capitalized from Greenback’s recent retreat. Other major currencies including the cryptocurrency and stock markets reacted positively from this. Can markets be correlated to each other? One way or another?
So much for my fundamentals, let us now move on with my technical analysis for Tesla. I do see that the stock is trapped in a choppy weekly range bound trading. The 29-week old demand is still a viable threat. When I see this kind of trade setup, based on my experiences, there can be highly volatile price movements creating swing highs and lows. Re-testing both the upper and lower bounds. Remember, USD DXY index is still in a bullish month! Tesla has shed more than 50% of its most value and in a strong down-ward trend for 8 consecutive months like Bitcoin! This is what I meant about correlation earlier!
I also exploited lowering high channel in its 4-hour chart. I will short the rally attempts at $740 mark. A price breakdown lower from the weekly pivot level (in blue color) may trigger more selling pressures and for sure bears re-test the lower boundary of this choppy range. It will be good for me to take profit at $650. I think it will be safe to put the stop loss on $795 near the probable fresh swing high area above the weekly resistance level I put in the chart. A total risk:reward ratio of 1.63-64. Not a bad trade plan is it?
Original article source:
https://www.finlogix.com/analysis/20220719/tesla-might-be-trapped-in-a-choppy-weekly-range-bound-trading
Read my previous analysis:
https://read.cash/@rafaelken1989/bitcoins-50-monthly-ma-strong-rejection-might-put-long-term-supports-to-the-test-86ecf519

Bitcoin’s 50-monthly MA strong rejection might put long-term supports to the test!
**DISCLAIMER: I am not a financial advisor nor certified analyst, and definitely not a pro trader. All contents discussed on this article are solely my own views and for trading education/entertainment purposes only. Trading and investing in cryptocurrencies are extremely risky where losses can exceed deposits. Enter with discretion. Do your own utmost researches and due diligences. The basis of this article is pure technical analysis speculation.**
*Image credit to* *https://www.dailyfx.com/bitcoin*
Good day to all. The cryptocurrency market leader, Bitcoin, have suffered eight brutal months of price action! After a spectacular 2021 year end finish of almost hitting $70,000 all time high, the crypto leader has entered price hibernation shedding more than 70% of its most valuable price.
Market analysts and speculators alike claim that Bitcoin is clearly in a bear market already well in fact, it is back in its own bear market period after impressive run we have witnessed during last quarter of 2020! Who could have thought that Bitcoin’s long year resistance from 2017-2020 be re-tested and broken easily? Then rest is history. I personally believe that one of the catalysts that move Bitcoin to its height of power, is the early stages of global Covid pandemic where cryptocurrencies became a hype.
So let us go back to reality. Who is the king of the trend now? Obviously, the answer is the most-ever hawkish US dollar! Sending a clear message to entire global financial markets including crypto that it is the boss at the moment at least. Haters just simply say, Bitcoin is nothing but a speculation!
If we try to look back on history, data shows Bitcoin is currently sitting in a long-term resistance turned support! But there might be further sell-offs as Bitcoin does not have bottom of bottoms right now! No one can say that Bitcoin’s already had its bottom. Well, we saw that in the monthly charts. A series of monthly dead cat bounces been rejecting Bitcoin bulls’ attempts to bring back higher prices. Over and over.
First thought $32-34K levels were the bottom, no. Then came sub-$20K price levels! What? Big no again! Until Bitcoin came back to visit its late year 2020 support. The question now can BTCUSD hold that support which connected last month June’s low?
Only time will tell as recently only, Bitcoin got strongly rejected by its 50-monthly moving average! If Bitcoin at least made a convincing weekly close above the minimal yet crucial $21,400 price level, then there could have been some higher hopes to say bottom was in. Instead, bid orders ahead mid July were instantly evaporated (filled) to the brim suggesting profit takers focus on the short-term!
Anyways, let me move on with my technical trade plan. I will be careful and weighing the current situation, I will be Bitcoin bearish for now. For the meantime, I fear a re-test may come any moment soon towards December 2020 and June 2022 lows, the fear index is simply way too overwhelming right now. I feel that most traders and investors alike, these days, can afford the short-term trades more and will simply act the quick volatility.
My short entry will be at $17,500 mark as the start of more possible new sweep of lows. Any lower lows can trigger heavy monthly selling! Will take profit at the $11-13K as Bitcoin bears next target. This area is near the Bitcoin’s 100-monthly MA and can be an obvious next long targets. That levels being said, Bitcoin is already so damn cheap and many will trigger buys! Why not? More than -80% from its ATH. If ever this short plan would not go according to plan, strict stop loss at $20K. Overall, the risk:reward ratio will be 2.20.
Bon voyage Bitcoin! Thanks for reading my analysis. All have a great day ahead!
Original article source:
https://www.finlogix.com/analysis/20220713/bitcoins-50-monthly-ma-got-strongly-rejected
Read my previous Bitcoin analysis:
https://read.cash/@rafaelken1989/btcusd-short-previous-all-time-high-record-is-open-for-business-fc0f4ecd

Shorting the XLMUSD’s 50% Retracement level!
***DISCLAIMER: I am not a financial advisor nor certified analyst, and definitely not a pro trader. All contents discussed on this blogpost are solely my own views and for trading education/entertainment purposes only. Trading and investing in cryptocurrencies are extremely risky where losses can exceed deposits. Enter with discretion. Do your own research and due diligence. The basis of this technical analysis is pure speculation.***
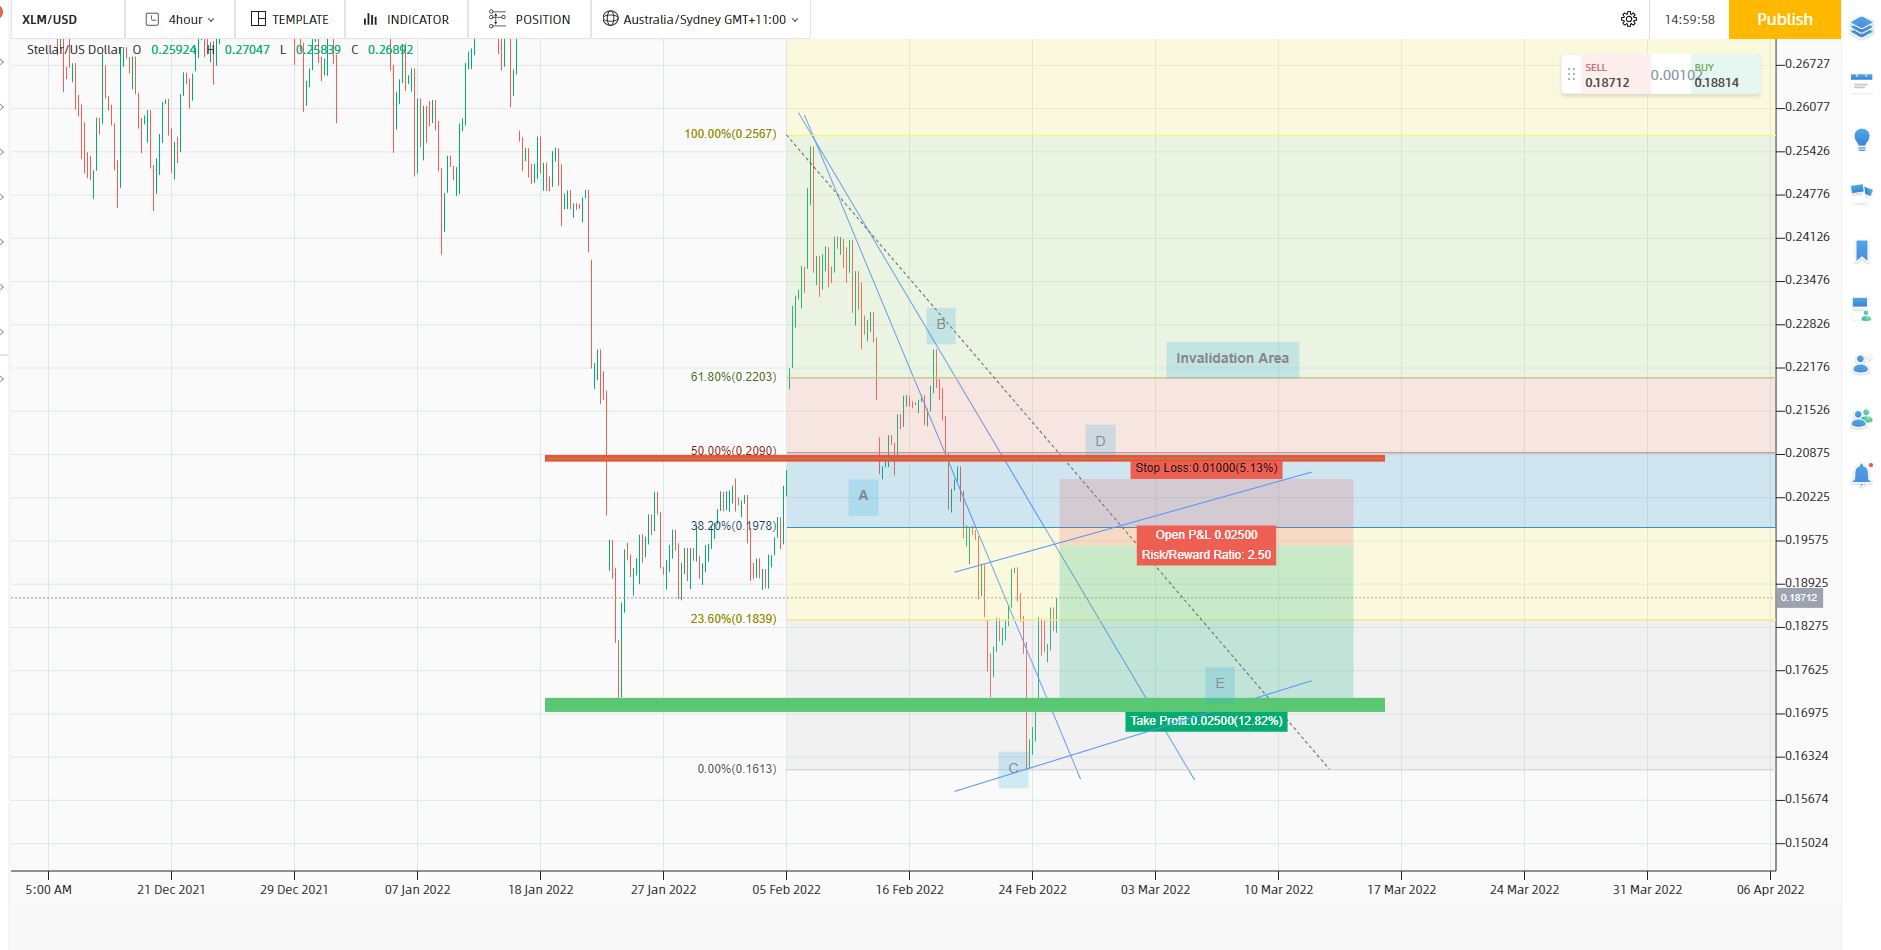
Happy Sunday to all. Just like in my previous technical analysis for Ripple’s XRP, I am seeing the same price movement for Stellar Lumens network’s native cryptocurrency, XLM. The said crypto is currently in position for a 4-hour wave D direction. Take note that the overall structure or reference point I am basing unto is XLM’s February high at 0.25600+ level. This should be the retracement basis for my Elliot corrective waves counting.
*Courtesy of* *https://www.finlogix.com/* https://www.finlogix.com/chart?symbol=XLM%2FUSD
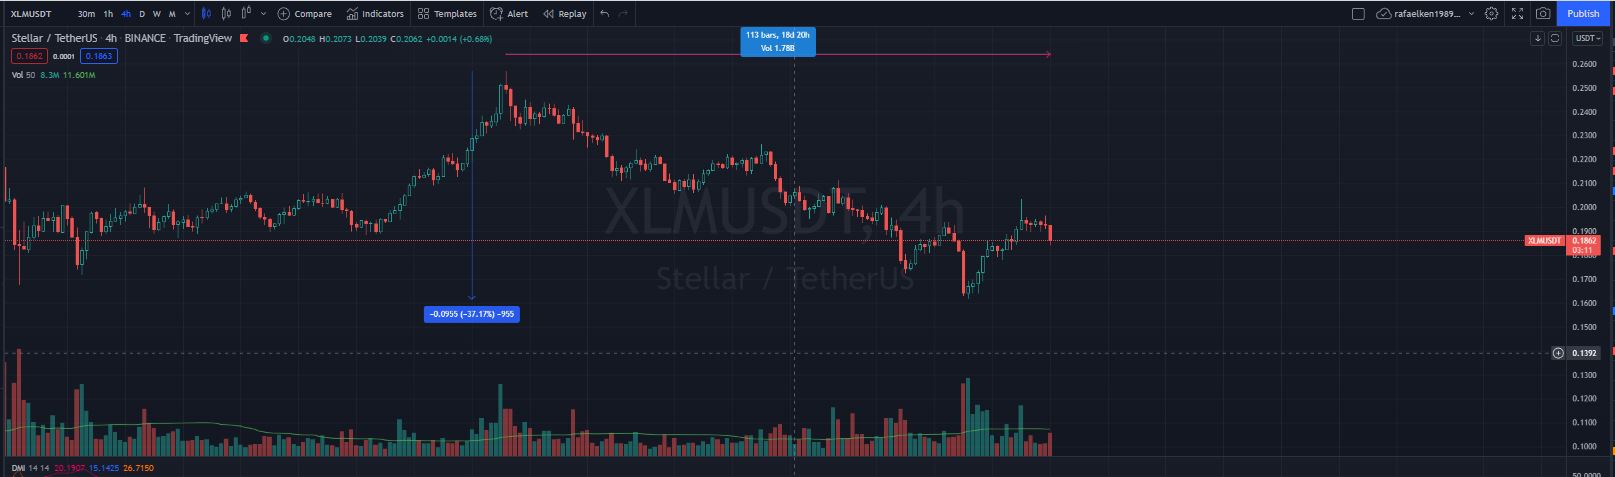
The XLM has given up more than 37% price correction already and been consolidating for more than 18 days at the time of writing this article.
Courtesy of *https://www.tradingview.com/* https://www.tradingview.com/chart/QjlnrdEy/
I am trying to get a shorting opportunity after assessing XLM’s possible price action based on these gatherings but I will be very careful on the invalidation area near the 50% and 61.80% retracement level ranges! I am speculating that XLM bulls might rally the price towards the wave D’s end around the crypto’s 1-month old resistance zone that has been tested few times as strong area of rejection though the XLM managed to flipped it into a quick support that lasted from February 14-15. A 4-hour double top candles last February 18 is a convincing rejection! I will put my XLMUSD short trading plan’s stop loss near this area around 0.20500.
Currently, XLM’s price has found support near the 23.60% fib retracement and buyers are gathering momentum to re-test towards the 38.20% level. My short entry price will be 0.19500 and can have a decent chance for the wave D ending.
I have also spotted a hidden ascending channels performing higher lows and highs. These can be our current range bounds and taking profit at the possible higher low price at 0.17000 is a good reward to take.
Overall, the risk:reward score of my latest crypto trade plan for XLMUSD is 2.50.
Fundamentally, the general sentiment in cryptocurrency markets is in fear metrics. So for me, accumulating phase is the name of the game at least for this current trend.
Hope you may find my latest TA helpful and wishing everyone a happy trading week ahead!
Thanks and stay safe all!
XRP 4-Hour Wave E Ending Assumption for a double back-test on $0.55 support!
DISCLAIMER: I am not a financial advisor nor certified analyst, and definitely not a ***pro trader. All contents discussed on this blogpost are solely my own views and for trading education/entertainment purposes only. Trading and investing in cryptocurrencies are extremely risky where losses can exceed deposits. Enter with discretion. Do your own research and due diligence. The basis of this technical analysis is pure speculation.***
*Courtesy of* *https://www.tradingview.com/*
Good day to all. I have chosen the cryptocurrency, XRP, as the basis of my latest technical analysis where it outperformed against rival coins with the likes of Bitcoin, Ethereum, BNB, Cardano (ADA) and Solana (SOL) just this month of February.
I will set aside the news revolving around the cross-border token and focus my attention to the 4-hour timeframe, my own counting of the Elliot correction waves that XRP belongs to, and simple location of the trendlines. Very, very technical indeed so stay with me until the end of this article.
To start, let us assess what happened over the weekend first. Bitcoin, as usual, led the crypto markets’ recent dips.
In XRP’s case, in my own understanding, we saw that the major support $0.76 was dead again during the crypto leader’s dip down the roads. At least, XRP found acceptance to the previous phase’s range resistance at $0.66-0.67 range which flipped into a support for now.
If we try to look at XRP’s 4-hour trend carefully by counting the Elliot corrective waves, the latest drop was the end of wave C, so price recovering slowly back up but I assume that $0.76 up to $0.82 will be heavy lines of resistance. A strong rejection from this price range will trigger my assumption for a wave E nasty correction where bears, sellers, and grizzlies altogether unite to send price down to the previous January 2021 demand!
XRP has no other way but to perform a double back-testing of these 2021 monthly demand, picture perfect for a double bottom pattern ready to change gear up.
Take note that this TA will be a bearish scenario only and not necessarily to happen!
Lastly, let us head over to my trade plan for XRP when this bearish bias in play. I am aiming a handsome estimated risk:reward score of 7.86 on the $0.55 double back-test, and taking profit on the $1.10 weekly resistance level. I put a strict stop loss near the weekly 200 SMA as support found at $0.48 because I also assume that a massive bloodbath shall takes place on this region. Hope not!
That is all for now, thanks a lot for reading my latest TA for XRP.
You may like to watch my latest technical analysis video here:
https://www.youtube.com/watch?v=g01GzXOF6rY
Stay safe and God bless!

rafaelken1989’s view on the XRP
***DISCLAIMER: I am not a financial advisor nor certified analyst, and definitely not a pro trader. All contents discussed on this blogpost are solely my own views and for Trading education/entertainment purposes only. Crypto Trading/Investing are extremely risky where losses can exceed deposits. Enter with discretion. Do your own research and due diligence. The basis of this featured article is purely educational in nature.***
Hello to anyone that reads this article! Let me introduce myself, my name is Ken but I prefer to be called by my brand name rafaelken1989. I am an XRP investor since September 2019 as well as a try hard crypto day trader and an amateur trading analyst.
As everyone knows me, I am one of the XRP watchmen. I spam my social accounts especially my Twitter https://twitter.com/rafaelken1989 with endless updates for XRP, Bitcoin and more!
I read the charts my own way after setting up the trading system that works for me after 3rd year of brutal experience with the markets. I look upon XRP both in the short and long term perspectives. Thus by saying that, I am proud to say that I am aiming to be an accurate/precise trader and analyst.
Let me share you some of the major details that I have used in my trading system, as much as I read the news and research the fundamentals, I rely heavily on the technical aspects, market sentiment and structure. I check the candle structures, volumes, assess the timeframes I found helpful in getting trading confluence, indicators, layout chartings and trend lines. My latest additions are Elliot waves and Wyckoff theories and I open a lot of charts (more than 5 at times) to help me.
No one is right nor wrong in doing TA or speculations. The goal of doing these things is to get probabilities for the right entry and exit targets for potential profits. Of course, this article does not aim to give any form of financial advice but rather educational in nature. So please do not take action and just learn from me.
I like what famous crypto trader and investor, @jaydee_757 with what he said in his Twitter bio: https://twitter.com/jaydee_757
***"Show me the charts and I'll tell you the news."***
Indeed a very, very self explanatory!
When I say trading, it means for short term busy only because the crypto markets are very brutal, emotionless and ruthless. As much as it can please anyone especially newly attracted participants in the markets, it can also swallow anyone alive as well in the short span of time! A lot of things I cannot discuss in details about my experiences in crypto. All I know that in my 3rd year with XRP, I have learned a lot like Bitcoin dominance, black holes in the crypto markets, manipulation, FUD, FOMO, etc. I cannot tell them all for it will make this article very long!
So my advice is always apply risk management in short term trading plans or else you will resort to long term holding or infamously termed as “hodling” in the cryptocurrency space. A lot of people are emotional once they are attached or married to a coin. I have truly experienced this. Lastly, XRP’s price or any other crypto IS EXTREMELY VOLATILE in nature. Cryptocurrencies are one of the riskiest or can be the riskiest asset type of the world! https://www.investopedia.com/terms/h/hodl.asp#:~:text=HODL%20is%20a%20term%20derived,post%20to%20the%20Bitcointalk%20forum.
So let me proceed with my own version of what is XRP applying everything that I have experienced.
XRP is the native cryptocurrency of the XRPL or XRP network. Like many other cryptocurrencies existed, XRP has its own version of a public ledger. Peer to peer, fast, scalable, green and efficient crypto.
Ripple company is behind XRP’s creation. In fact, XRP is mistakenly called Ripple because of that connection. Let me be clear here, XRP is not Ripple in any way! Sadly, the Ripple company and its executives are filed with a lawsuit by the US SEC last December of 2020 claiming that the former are selling unregistered securities which hammered XRP’s price on spot.
Regardless of XRP’s price very unstable against the major fiats it is pegged against, majorly the US dollar, it has a finite supply and cannot be created anymore.
It has an original total pre-mined supply of 100 Billion XRPs which uses proof of burn protocol thus every XRP is destroyed per successful XRPL transaction. But worry not, because it would still require a very long time for entire XRPs to run dry.
XRP’s supply also is especial in a away that its former CTO or co-creator, Jed McCaleb, is selling handsome amount of XRPs on a regular basis, making him one of the richest man alive!
To know more about him, please read my other article:
https://read.cash/@rafaelken1989/jed-mccaleb-ex-xrp-superstar-4f2263f5
XRP also is different against the crypto leader Bitcoin. XRP is built for payments while the latter is for value storage but I supposed already that the legendary Bitcoin creator, Satoshi Nakamoto intended Bitcoin to be a means of currency to be used, what do you think? https://en.wikipedia.org/wiki/Satoshi_Nakamoto
Check article below to know the major differences between the 2 currencies:
https://read.cash/@rafaelken1989/xrp-vs-bitcoin-which-is-the-best-cryptocurrency-d58afc8b
If Bitcoin is the value, then XRP is the vehicle of that value. Making XRP the vehicle of value.
*Courtesy of* *https://coinmarketcap.com/*
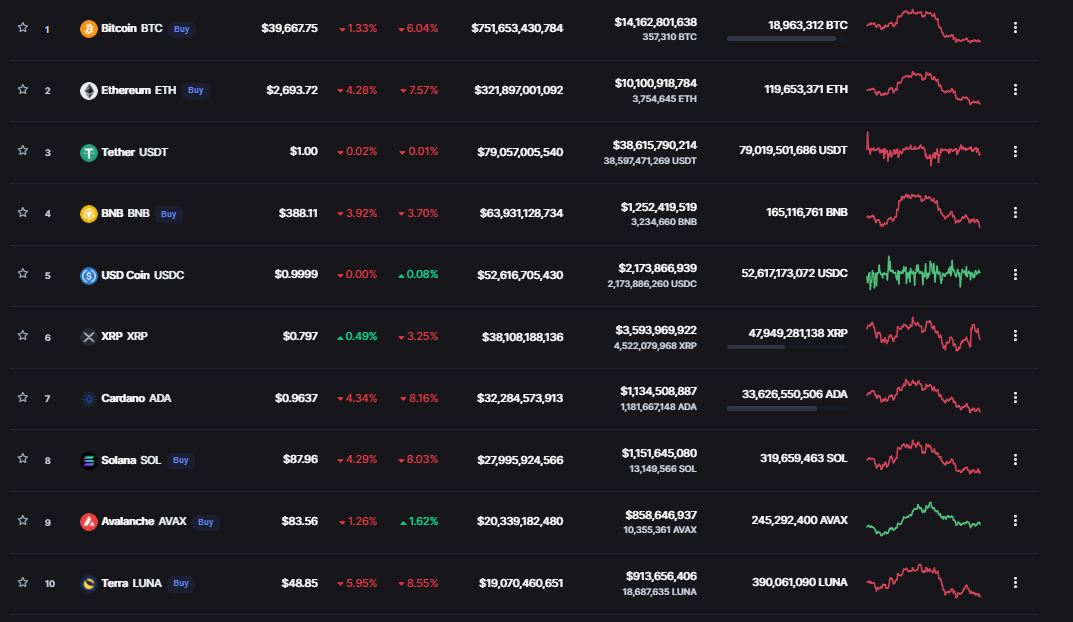
XRP is sitting pretty at the top sweet 6th spot according to market cap ranks. Heading above the likes of Cardano (ADA) and Solana (SOL). I am not saying that I am biased for XRP as I just want to layout facts here but if that is the case, then I am.
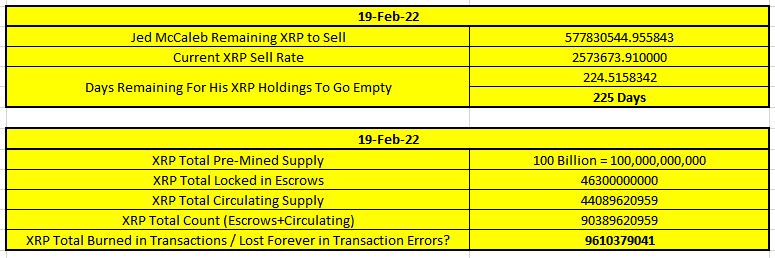
At the time of writing this article, I am doing some basic math for XRP’s supply to assess where the cross-border token at.
Take note that the following figures are based on my own research and unreliable! It MAY STRONGLY under corrections.
Based from the figures above, we can assume at current sell rate, it takes approximately 225 days for Jed McCaleb to stop dumping XRPs!
2nd table also suggests that there are over 9 billion XRPs burned on transactions and forever lost in limbo?
By analyzing the data, anyone (fan or not) can say that XRP is both a decentralized and centralized type of currency because of the Escrowed contracts.
So XRP has 3 major woes that hinder further development:
1. Undergoing Ripple and SEC lawsuit.
2. Escrow contracts to end by December 2025 to January 2026.
3. Jed XRP dumping ducks.
On the good side of things, these major woes can be also the puzzles for XRP’s not just mooning but marsing process. Who knows right? Out of these woes, the one that really worries me a lot is the lawsuit, if XRP is deemed to be a security then that is the end of everything for me with XRP. I just SELL all my trade positions and bags for good.
Remember to check my long term chart image below where I carefully put on the timestamps with XRP’s Wyckoff theories.
*Courtesy of* *https://www.dailyfx.com/*
Thanks for staying to the end! Hope you find this article informative.
God bless us all!
Imminent AUS200 Index Bear Cross – Are Sellers Ready To Plummet Price Lower?
**DISCLAIMER: I am not a financial advisor nor certified analyst and definitely not a pro trader. All contents discussed on this blogpost are solely my own views and for Trading education/entertainment purposes only. Indices and CFD Trading are extremely risky where losses can exceed deposits. Enter with discretion. Do your own research and due diligence. The basis of this trading analysis is purely technical in nature.**
*Image courtesy of* *Finlogix.com* https://www.finlogix.com/analysis/20220118/imminent-aus200-index-bear-cross
Are the bears ready for more selling onslaught? We will soon find out. By writing my first ever Finlogix analysis for this year 2022, I have decided to start scouting the Australian stock market. Price action suggested that after the AUS200 index managed to pull through a stellar upward rally that started from early December up to 4th of January 2022, price was immediately went in north direction.
We can easily count the daily Elliot waves from here. It is obvious that the 5th motive wave was the top of that rally. At least it the index started the new year with a bang! One of the key fundamental news is that Energy stocks carried the index price higher altogether on fears of global supply disruption after Indonesia imposed a ban on coal exports.
But then, corrective market cycle took over quickly. The 2-day sell-offs sent the price toward January 6 low then price tried to make a dead cat bounce the following day but eventually bulls cannot figure out and eventually led the index in printing back to back lows by January 10 Monday market close. All happened quickly in just a span of 6 days. For now that day would be our fresh monthly low record in the making but not too long. I presume that we are heading towards an ABCDE correction which supports my claim for a bear cross to occur very soon.
From the back of a sudden and pesky rising Covid cases in the start of the year (big thanks to the Omicron variant!), the Australian stock markets have started to free fall. I can see this as a selling opportunity. Only time will tell when the angrier and madder bears together with the grizzlies will continue their mission. XJO’s daily RSI indicator failed to hold above the neutral yet crucial 50 mark while its MACD continues to print for a bearish divergence.
I will definitely sell the rally attempts! My short trade entry will be on the re-testing on the 100 moving average. Technically, both the 50 and 100 MAs failed to sustain the price! In fact, at the time of writing this up, we had a big bad bearish daily candle close in 18th! Support was found momentarily and the buyers will try to push it up towards my entry.
I will put a stop loss at 7,500 and take profit mark at the September 2021 low as hard support. I speculate it as the end of wave E. A roughly 2.33 risk:reward ratio to take on. Good luck!

WTI Oil Long – Can the 345-week old long term Resistance turn into a Support?
**DISCLAIMER: I am not a financial advisor nor certified analyst and definitely not a pro trader. All contents discussed on this blogpost are solely my own personal views and for Trading education/entertainment purposes only. Commodities Trading is extremely risky where losses can exceed deposits. Enter with discretion. Do your own research and due diligence. The basis of this trading analysis is purely technical in nature.**
*Image courtesy of* *Tradingview.com* https://www.tradingview.com/
I am not going to lie with what I am currently seeing in the Oil weekly chart right now, I am bullish bias once Oil’s price will either hold current price next week’s open or once bears try to attack a certain demand zone. In few moments, I will explain the technicals in-depth.
If I were to be asked, I will definitely have a full gas tank right now while I can. Or perhaps waiting a quick nose dive dip for Oil in the coming weeks. No need to explain further.
The current news revolving around the Black Gold (Oil) is bearish and I really like to point out a strong buy for WTI Oil now rather than sell the news from the norm. Just make sure to set the stop loss when the dip scenario comes in. These news will try to say increase in supply but I believe that in a post-pandemic world we are living now, it is time to move on. The global economy must push forward rather than to sit back waiting for magic to happen which will not come. The economy should recover and a must! I can sense that the Oil will enter a new upper range bounds bringing back the good old days in the year 2009 for Oil’s price at least above $80 per barrel.
Technically, I see a convincing immediate turning of 345-week resistance trendline into a short term support. The charts are obvious. I located three major resistance levels for the Oil dating back first to where the break-in support turned resistance occurred on November 24, 2014 then followed by the October 2018 peak and lastly on July just recently within this year 2021. The prices of these dates are all pointing to the $75-$77 range which Oil is currently exchanging at the time of writing this article and is acting as short term support. So a close above it next week will trigger a bullish push while Oil’s current weekly RSI is still above 50+ neutral zone. As a note, if bears are ready to push price down, $70 at least will be reactive demand and will be my entry. Failure to hold this price will test Oil’s 50-weekly SMA found near $65-67 levels.
At worst case scenario may come yet again, $50 dollar will be a fine stop loss mark. My long target exit is of course a 3-digit Oil price at least $100. A notably 1.50 risk:reward score for this trade plan.
All the best of luck!

BTCUSD SHORT – Previous all-time-high record is open for business!
**DISCLAIMER: I am not a financial advisor nor certified analyst and definitely not a pro trader. All contents discussed on this blogpost are solely my own personal views and for Trading education/entertainment purposes only. Crypto/Cryptocurrency Trading is extremely risky where losses can exceed deposits. Enter with discretion. Do your own research and due diligence. The basis of this trading analysis is purely technical in nature.**
*Image courtesy of* ***Finlogix.com*** https://www.finlogix.com/
Hello once again. This is my second Finlogix article for today, October 25, 2021.
I feel like I want to get back to the crypto leader Bitcoin because my previous BTCUSD trade plan resulted for a stop loss. You can check the full details on my Finlogix profile. I will appreciate it a lot if you do. https://www.finlogix.com/profile/rafaelken1989/
In creating technical analysis, just take it easy. It does not matter whether we are correct or wrong. What matters most is we keep on learning, progressing to become better traders. I keep hearing that long term holding or famously called HODL is the best thing to do when dealing one of the riskiest asset classes in the world which is right but the crypto markets can also offer the best short term trading setups. We just need to remember that when dealing cryptocurrencies, we play the best risk:reward management. Again read my disclaimer above.
Let us continue for the Bitcoin now. I never saw it so bullish after my last call! I honestly have not seen it coming. Well, welcome to the crypto markets where anything can happen! From a deadly dip in a short time to an out of this world bullish rally as well! One’s tears is another man’s joy. No win-win situation. I rather lose to trading than fall to pyramid schemes/scams.
Like I mentioned from one of my crypto analyses, the ETFs trading privilege paved another roller coaster ride for Bitcoin. During this time the ride is upstairs after all the FUD news are finally put to an end. I even felt that a lot of BTCUSD bears sat down in front of their charts in utter dismay and frustration shouting how in the world Bitcoin survived the last September 21, 2021 dip below $40,000 level! Well, I really wish I have the answers especially crystal balls. But I am still happy that we have charts where we can analyze somehow the recent BTCUSD price action.
The way I view the Bitcoin daily charts right now, I admit first that I am still a bit traumatic with what happened last May 2021 brutal and nasty sell off led by the crypto leader. I never forget that day! Another rule in trading which I just recently learned is never get emotional especially when we are short term traders. Specifically in cryptocurrencies.
In this second BTCUSD trade plan, I will be short once again but I will just use candles. No other indicators. I just draw simple chart lines as my resistances and supports. But if you want to hear out my technical perspectives, Bitcoin is just too overbought right now and in high greedy metrics. All I can see now is BTCUSD in a strong ascending channel. So bullish as I see it!
While Bitcoin attained a fresh all time high for the record again, $65K will be my short entry as a re-test to its 2nd ATH record. I know BTCUSD has been in a bull market for a decade now and it will in time be a 100 grand ($100K) maybe at the end of this current cycle. Who knows. Bitcoin has a 4-year cycle halving period as a matter of fact. But short term drawbacks are necessary for continued bull market cycle.
My take profit will be the $53K to be tested as a flipped S/R turned into a strong demand zone before next leg upward.
A conservative stop loss will be fine around the $70K mark where new price discoveries and upper retracement levels awaits Bitcoin and of course FOMO!
This risk/return score is 2.40.
Good luck! Hope at least I even my score with the BTCUSD.
Thanks a lot.

BCHUSD LONG – A Minor Correction Before Targeting 38.20% Upper Retracement
**DISCLAIMER: I am not a financial advisor nor certified analyst and definitely not a pro trader. All contents discussed on this blogpost are solely my own personal views and for Trading education/entertainment purposes only. Crypto/Cryptocurrency Trading is extremely risky where losses can exceed deposits. Enter with discretion. Do your own research and due diligence. The basis of this trading analysis is purely technical in nature.**
*Image courtesy of* *Finlogix.com* https://www.finlogix.com/
Happy Monday everyone!
Tonight, I will be writing a fresh short term technical analysis for the fifth cryptocurrency within the Finlogix platform, the Bitcoin’s hard fork Bitcoin Cash or simple called BCH against the US dollar.
To begin with, let me give you BCHUSD’s quick price action summary. Like the Ripple XRP, BCHUSD’s long term trend is also in its 4th year bear market from its all time high record last December 2017. BCH also achieved a fresh multi-year last May 2021 while XRP’s fresh multi-year was on April 2021 but still we can see that both cryptocurrencies share the same fate. The question now is, can they both reclaim their former all time high records? BCH is still down more than 80% from its ATH at least for its October 2021 high and still long way to go. A lot of upper retracing works to be done!
Let us head now to my short term trading plan for the BCHUSD crypto pair. The main trendline resistance I am seeing is the BCH’s 38.20% Fib retracement from its fresh May 2021 multi-year high followed by the next resistance level on the 23.60%. We have witnessed a very beautiful June and July monthly lows as twin strong supports which created a bullish reversal achieving a new September 2021 local high. In fact most of the alts shared this move.
So far BCH found a good support on 471-473$ September lows then retested back the said mid month’s high 655-657$ but rejected.
At the of writing this article, BCHUSD is consolidating and just holding above the $600 crucial price level.
If I assume that BCHUSD’s daily MACD indicator will proceed for a bearish divergence followed by a breakdown from its daily RSI below 50 as well, then we can see sellers try to push the price lower up to September 29, 2021 intraday low. To prepare for another quick price correction, I am speculating that the $550 mark will act as an immediate support. This will be my BCHUSD entry for a long position and my target eyes the re-test on 38.20% retracement, that’s approximately $860.
I will set a strict stop loss at the September low but I will adjust to $450.
The overall risk:reward score for this trading plan is 3.10. All good.
Wishing again best of luck for my first ever BCHUSD Finlogix analysis.
Thanks a lot. Hope you find my article informative.
Do not forget to read my disclaimer once again. Cheers.

XRPUSD LONG – 38.20% Fib Re-test
**DISCLAIMER: I am not a financial advisor nor certified analyst and definitely not a pro trader. All contents discussed on this blogpost are solely my own personal views and for Trading education/entertainment purposes only. Crypto/Cryptocurrency Trading is extremely risky where losses can exceed deposits. Enter with discretion. Do your own research and due diligence. The basis of this trading analysis is purely technical in nature.**
Happy Friday everyone.
The Ripple XRP has been one of my heavily favored cryptocurrencies and I have written quite few technical analyses already. You can check my other TAs, please head over my profile.
We all know that the cryptocurrency markets can offer the best risk:reward scenario given the fact how crazy the volatility is. Now that Bitcoin’s has made another all-time-high record, one of the key factors is it is finally listed to ETFs trading, I can assume that the crypto leader can greedily head towards $70K-$75K price levels first before a correction. Price correction is normal and is part of a healthy crypto bull market cycle.
The question now is how the alts going to react when it happens? When comparing to Bitcoin, XRP’s price action has lesser volume trading thus stagnating price action after achieving a fresh 4-month high on September 2021 since May 2021 brutal sell off.
I understand that I still have a pending XRPUSD analysis discussed on my previous article but I want to give a fresh technical outlook for today.
I am seeing that the cross border settlement token will have to re-test first the 38.20% Fibonacci retracement as immediate support before next flight towards at least the May 19, 2021 high.
There is a trendline support forming from July 21 and September 22 local lows where the said 38.20% Fib can potentially residing as the 3rd local lows. These 3 local bottoms can technically create an ascending supportive channel of higher lows and we surely do not miss it as a long position opportunity.
As long as the XRPUSD’s daily RSI indicator remains above 50 to pave way for a bullish momentum anytime then my latest long plan will play out.
The Fibonacci retracements I am using is based from XRP’s fresh multi-year high last April 2021 as our top range and the bottom range will be the June 2021 monthly low.
Sellers will try to slice the price down towards $1.06 which will be our entry since the token’s price were rejected multiple times since September high forming a descending lower high channel. It seems too strong now and the XRP has no choice but to find an immediate support.
We will place a strict stop loss on the 100 day SMA which can give way for the 23.60% Fib price. We set it at $0.93.
The take profit exit will be my virtual 3rd higher high in connection to the ascending higher highs from June to September. That is $1.60.
Overall the risk:reward score for this plan will be 4.154. A good deal indeed.
Wishing best of luck!
Thanks a lot for reading my latest technical analysis for the XRPUSD.
Enjoy the rest of Friday and have a wonderful weekend ahead!

USDJPY SHORT – A first re-test on the 5 year high!
***DISCLAIMER: I am not a financial advisor nor certified analyst and definitely not a pro trader. All contents discussed on this blogpost are solely my own personal views and for Trading education/entertainment purposes only. Forex/FX Trading is extremely risky where losses can exceed deposits. Enter with discretion. Do your own research and due diligence. The basis of this trading analysis is purely technical in nature.***
Hello once more. I have decided to create my second Finlogix technical analysis for the USDJPY FX pair.
Not so long ago, last January within this year 2021, I have created a long trade plan for the Greenback against the Yen with a risk:reward ratio of 2. Luckily, it was a hit and I am proud to say as one of my winners! You can review its trading plan details on my profile.
I have also mentioned in my previous Nikkei long analysis about some insights for the USDJPY citing it as one of the key movers last week.
I totally understand that quicker time frames can offer much safer risk protections but I prefer to use the USDJPY monthly chart this time to explain what I am seeing on the macro side of trading.
In fact, using the monthly time frame gives me a clearer view of the pair’s price action in the long term scenario.
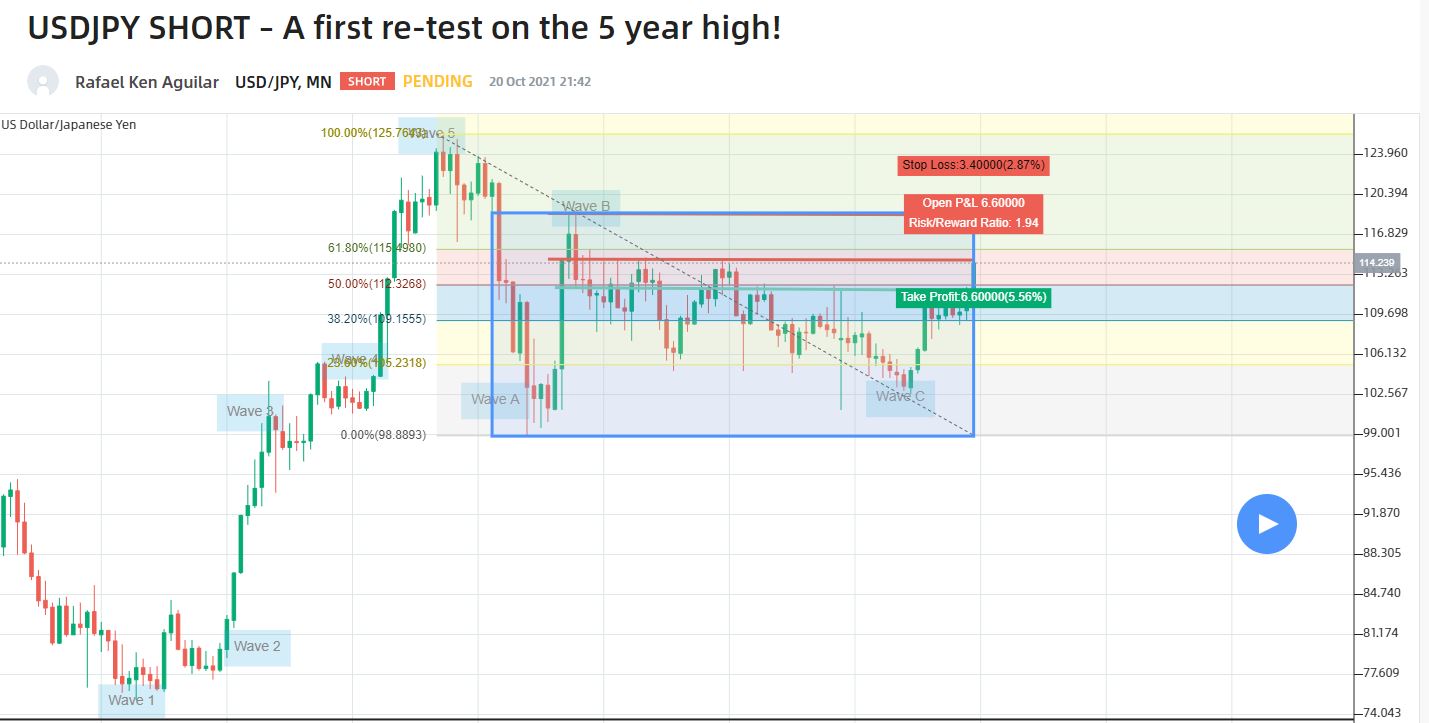
I will give credit first for the USDJPY buyers being able to push the price to a fresh 3 year high! To be more conservative, the 115 mark is a juicy sell zone already but I speculate that the buyers are still not done yet. After breaking the 2 year resistance found at the 112 mark (50% Fib retracement), the USDJPY is still bullish on the monthly chart based on its monthly RSI!
Once the weekly correction is through, I am convinced that 112 now is a flipped S/R and next target will be the 115.50 (61.80% Fib retracement) which we can have a bullish extension possibility towards the USDJPY’s 5 year high!
I have also layout my monthly Elliot waves theory and looks like ABC correction is done last December 2020 to January 2021 double monthly candles followed by a fresh motive phase. From my Wyckoff’s perspective, we are still consolidating which I highlighted the range bounds in blue rectangle and might trigger for a re-accumulation mode.
If my analysis is correct, the monthly RSI can also re-test upward levels to support confluence from what I am seeing.
My USDJPY short entry will be the said 5 year high (double top monthly candles) set at the 118.60 mark. Take profit will be at the anticipated flipped 112 S/R which will become a very strong demand zone. The stop loss will be strictly observed at the 122 mark in case of an overbought scenario.
Overall the risk:reward score for my second USDJPY trading plan will be 1.941.
I hope this one makes another winner for me.
Good luck! Thanks a lot for reading my latest Finlogix analysis. I do hope you find my insights informative. Cheers!
NIKKEI LONG – Weekly Higher Low Bounce Can Be Bullish
**DISCLAIMER: I am not a financial advisor nor certified analyst and definitely not a pro trader. All contents discussed on this blogpost are solely my own personal views and for Trading education/entertainment purposes only. Trading the Indices is extremely risky where losses can exceed deposits. Enter with discretion. Do your own research and due diligence. The basis of this trading analysis is purely technical in nature.**
Happy Sunday to all.
The global markets will be open again tomorrow and as I have reviewed the top performers from last week which included the WTI and USDJPY, I picked the Japanese Nikkei (JP225) index for some potential correlative moves for the upcoming week.
Just recently on Friday, the USDJPY managed to re-test its 3-year high above the 114 mark which in fact created a slightly third lower high which can be unnoticed at first glance when viewing the said Forex pair’s monthly chart.
From this move, I will speculate that there can be a bullish correlation on the Nikkei knowing that the US Dollar might set for a decline against one of the safe haven assets that is the Japanese Yen after hitting a weekly RSI above 75 and can be in overbought territory already.
I believe that the 115 mark is a strong sell/short signal for the USDJPY and traders/investors will have to take profit past 114 as prior defense. However, anything can happen and the Greenback might extend its consecutive bullish move against the Yen. We will find out soon enough.
Sticking with our trade plan for the Nikkei, like I said earlier I will be bullish bias which I will explain the technicals from this point.
We will use a Fibonacci extension level from the index’s March 2020 low up to its 2021 high 4-5 weeks ago just last September. That should set our trading range bounds.
There was a clear trendline breakout to the upside on February 2020 high reference from the first week of August 2020. This breakout paved way for the index’s fresh 2021 high by September before the weekly bearish reversal had occurred.
The first week in October had resulted for a test of the previous key resistance into a support and indeed buyers were able to stop the more slippage chances. Although the weekly Ichimoku clouds were touched twice but eventually the index performed two double weekly bottoms forming a new higher low bounce from March 2020 low’s perspective creating a supportive ascending channel. I speculate this as a bullish move.
The index’s weekly MACD had just managed enough foothold to create a price capitulation while the RSI held also above 50 level and buyers will continue to push the price northbound. Once the weekly RSI breaks above 63, it can result for a more bullish momentum.
My long entry will be near the Nikkei’s Ichimoku Kijun or Base line around 28,500. I will anticipate for a minor pullback first before next rally upwards. I shall set a stop loss at the 25,500 level where can lead for more downside action heading to the 38.20% Fib level.
We might never know that the said index can even create a 3rd 2021 yearly high if we are right for this plan. The 33,000 mark will be my take profit exit.
Overall, this trade plan has an estimated risk:reward score of 1.50 only. Take note that I’m using a weekly time frame not a bad deal.
Thanks a lot for reading my latest Finlogix article and I wish you a great trading week ahead.

LTCUSD LONG – Symmetrical Triangle Pattern for a Higher Low Opportunity
***DISCLAIMER: I am not a financial advisor nor certified analyst and definitely not a pro trader. All contents discussed on this blogpost are solely my own personal views and for Trading education/entertainment purposes only. Crypto/Cryptocurrency Trading is extremely risky where losses can exceed deposits. Enter with discretion. Do your own research and due diligence. The basis of this trading analysis is purely technical in nature.***
*Image courtesy of* ***Dailyfx.com*** *powered by* ***Tradingview.com*** https://www.dailyfx.com/ https://read.cash/@rafaelken1989/eurusd-long-inverse-hs-can-play-out-f87d0d97#bad-link
Good day to all traders once again. Today I want to write a short term trading plan discussing a long opportunity for the LTCUSD pair.
The time-frame that I will be looking at is in the daily chart where I can see clearly that the Litecoin is forming a symmetrical triangle pattern which can also indicate our probable volatile trading ranges.
The top of the triangle is the LTC’s May 2021 new all time high record while the low is obviously the July 2021 dips.
The coin’s daily RSI meter is currently in neutral zone at the time of writing this article and just enough juice to hold its value. But on the safe side of the story, we will anticipate a minor correction based on the crypto leader Bitcoin’s price action which is having an enjoyable bullish mid-month run for October but any moment can turn bearish. Trading cryptocurrencies are extremely risky and we must be akin to play the best risk:reward setup as much as possible.
Unless a clear break above $200 USD shall extend LTC’s breakout towards its September 2021 high and probably re-testing 61.80% retracement level mark at $295-$300 from the said symmetrical triangle trading ranges point of view.
Suppose that the LTCUSD bears grip control over the momentum, we will then keep an eye on the coin’s daily RSI low that happened last September 28, 2021 as confluence with the long trade chance that I am speculating.
Let’s head over to the details of my long trade plan. If 23.60% Fib retracement cannot hold for a strong bearish pressure, then bulls will pull back and try to guard the $150-$160 price regions which I will also be bias for a third double bottom candles formation there connecting the endpoints of the lower supportive trendline of the said symmetrical triangle. That price will be our long entry.
I can see a good profitable exit at the 61.80% retracement. To be precise, it’s the $300. We will observe a close stop loss at the $120 mark which can pave way for a re-test on the July 2021 low.
This LTCUSD long trade plan will have a risk:reward score of 5. A very profitable setup!
Good luck. I hope you have enjoyed my latest cryptocurrency technical analysis.
Have a wonderful weekend ahead all!

EURUSD Long – Inverse H&S Can Play Out!
***DISCLAIMER: I am not a financial advisor nor certified analyst and definitely not a pro trader. All contents discussed on this blogpost are solely my own personal views and for Trading education/entertainment purposes only. Forex/FX Trading is extremely risky where losses can exceed deposits. Enter with discretion. Do your own research and due diligence. The basis of this trading analysis is purely technical in nature.***
*Image courtesy of* *Dailyfx.com* *powered by* *Tradingview.com* https://www.dailyfx.com/
Today I am going to create my latest Forex technical analysis here in the amazing trading platform, Finlogix, where we can create unlimited backtestings and forwardtestings for all our trading plans across the global markets where a lot of investment instruments to choose from. I decided to focus my mind in one of the most traded and liquid FX pair considering its daily trading volumes, no other than the EURUSD.
As a start, the EURUSD’s 2021 yearly high last January 6-7 double top candles is my trend setter and the basis of writing this technical analysis for the said Forex pair trading pair.
We can see clearly that the Euro is struggling against the Greenback in the last 5 months at least after it printed its second yearly high last May 25-26 which is our second double top.
Let us connect the two yearly highs and they will form a descending channel in the daily time frame and as well as higher lows in the process.
Back again on the EURUSD’s daily chart, I can see that the FX pair is still in the Elliot corrective phase C as part of the ABC correction. The phase C is usually the longer one to finish the corrective process.
In addition, I am also seeing a mid-long term inverse Head and Shoulders formation in the daily where the shoulder number one first formed on July 2017 breakout rally and ended somewhere in October 2018 wherein the EURUSD suffered a decisive breakdown. The neckline of the said inverse H&S is the 50% Fib extension level in reference from EURUSD’s December 2016 low to February 2018 high. The second shoulder’s start of formation can be spotted last July 2020’s beautiful break out! But so to speak it can be retested this time as support completing the neckline I mentioned earlier. Anything can happen but in my own personal speculation, in this way we can surely say that corrective phase C will end soon. Just give it more time.
Let us go ahead with my EURUSD trade plan, I have already explained the technicals, so I will lay out the details.
The neckline will be my entry for a long position which I am convicted that EURUSD will enter a new re-accumulation phase based on Elliot’s wave theory in trading. It is 1.14500 to be precise. I will put the stop loss within the inverse H&S’ range bounds. It is the 61.80% Fib extension level (please read again the details of my inverse H&S formation above for a recap) around 1.11850. I am forecasting that the Euro will create a third higher low (HL) near the 23.60% Fib extension level as a good taking profit exit at the 1.20300 mark.
The risk:reward score for this long trade plan is approximately 2.19.
Good luck! Thanks a lot for reading this analysis.

October 06, 2021 - Bitcoin and XRP Technical Analysis
***DISCLAIMER: I am not a financial advisor nor certified analyst and definitely not a pro trader. All contents discussed on this blogpost are solely my own personal views and for Trading education/entertainment purposes only. Crypto/Cryptocurrency Trading is extremely risky where losses can exceed deposits. Enter with discretion. Do your own research and due diligence. The basis of this trading analysis is purely technical in nature.***
A pleasant day to everyone that will read my latest article.
The previous TA that I have formulated last time has become invalid on a short term basis. The October month candle is very bullish right now, so we adjust our insights accordingly to the current trend I am seeing. I am doing my best.
If you still followed me on Twitter, I hope you do. Fingers crossed!
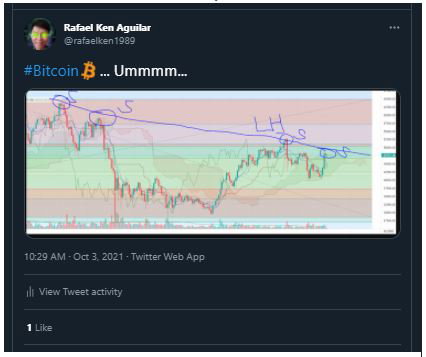
Bitcoin has broken the trendline in my tweet:
https://twitter.com/rafaelken1989/status/1444489767077380101
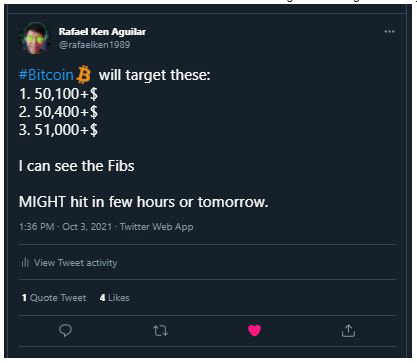
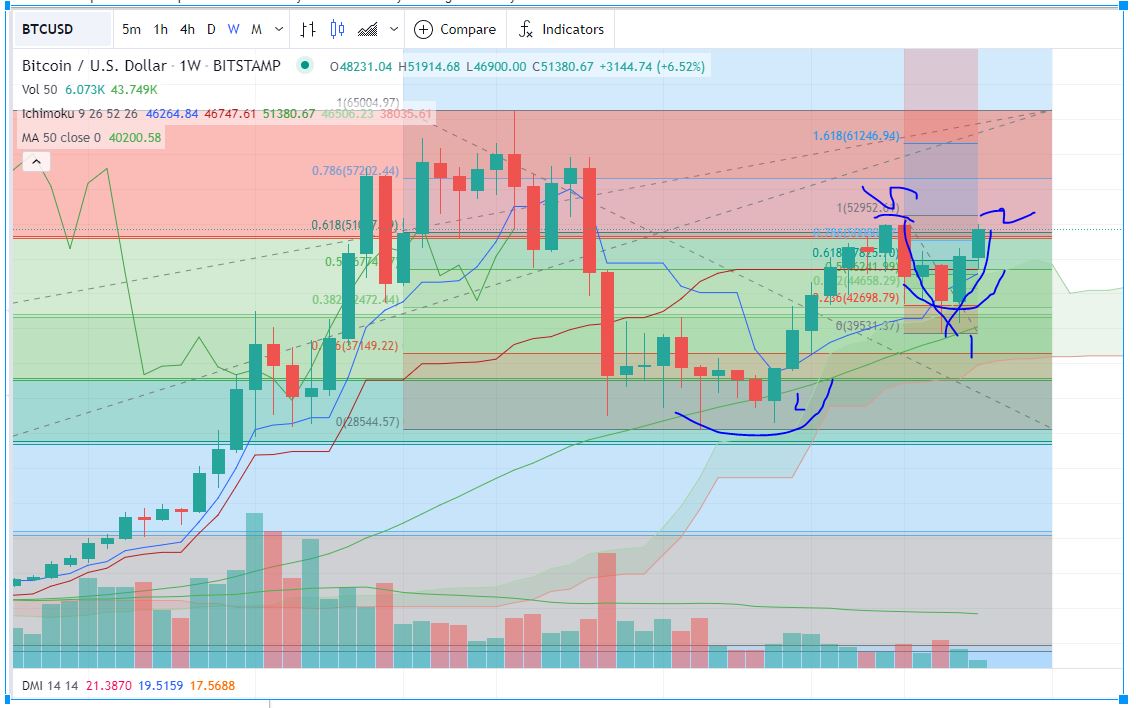
And I forecasted the $51K+ will be achieved though went longer than my time estimation but overall it was aimed.
https://twitter.com/rafaelken1989/status/1444536936396247045
Bitcoin indeed performed a capitulation when we try to look at the Wyckoff stage in weekly view.
We are back to mean reversion at least.
These my latest Bitcoin trade plan based on Fibs and Elliot impulses/waves:
Explanation:
A re-test on daily Ichimoku cloud to support one last time before gearing up back. Price correction is normal. We always accept it.
BUY ZONE: $47,800 - $48,000
SELL ZONES:
1. $50,000
2. $51,000
3. $53,000
4. $57,000
STOP LOSS ON: $45,000 where can lead to lower prices down low.
Also expect alts' explosion when Bitcorn consolidates in new range bounds of trading.
For XRP, I made a recent tweet as well, I am seeing a rounding bottom pattern for a parabolic move.
Details on the tweet:
https://twitter.com/rafaelken1989/status/1445641524935467010
We set guard on the price correction as possible dips:
Remember that XRP is still in the bigger 4th year bear market and offers the best reward setup knowing the facts of all the current situations it is facing.
BUY ZONES:
1. $0.99-$1
2. $0.87-$0.90
3. $0.80-$0.86
We will swing this one and I will keep an eye on the breakout price as a sign on where the possible top. So basically a mid to long term swing trade setup.
All I can say is XRP is in a very sexy triangle trend.
That is all for now. I hope you find this fresh update from me useful and educational.
Thanks a lot for continued patience and patronage,
Wish you best of luck as always.
Cheers and yours truly,
Ken
ETHUSD Long – Double Tops Quadruple Bottoms
***DISCLAIMER: I am not a financial advisor nor certified analyst and definitely not a pro trader. All contents discussed on this blogpost are solely my own personal views and for Trading education/entertainment purposes only. Crypto/Cryptocurrency Trading is extremely risky where losses can exceed deposits. Enter with discretion. Do your own research and due diligence. The basis of this trading analysis is purely technical in nature.***
This blogpost is now my 2nd part of the 3-part trade plans for the top cryptocurrencies including Bitcoin, Ethereum and Ripple XRP. And it is Ethereum’s turn.
We all know that Ethereum or simply ETH is the second most largest of all crypto alts for so many years now since digital assets were born. With the current Bitcoin dominance, I think it still give significance towards ETH.
However, Ethereum VS alts, ETH holds about 31% of the total alts market. So we should say a major stock holder.
My analysis for Ethereum is plainly simple! Just candles and moving averages hence I used the phrase in the title “Double Tops Quadruple Bottoms”. It is in fact literal! :-)
Do you want to know how I come up with this TA? I used the weekly timeframe.
Based on how I see the ETH chart, the first major resistance is $4,000, well of course its all time high is almost $4,400. The first double top group can be found from May 3-10, 2021 and next happened is hellish drop!
The first triple bottoms can be found like a mini ladder downwards during periods from May 17 – July 19, 2021. This is a 10-week period of consolidation.
The second double top is found from periods August 30 – September 2021 with the same enemy at the gates! The pesky $4,000 wall!
Right now at the time of writing this blogpost, ETH lost the $3,000 for good but not too long. It will recover and finding the 4th double bottom to complete my quadruple bottom play!
Technically, there is a strong buy according to the weekly supertrend indicator around $1,900+ and the weekly 50-SMA is also near, its almost a round-off to $2,000.
Anyway, my long trade plan for ETHUSD is to wait for the weekly 4th double bottom candles to appear. I will adjust an entry in $2,500 mark. Place a stop loss on the $2,000 while exiting on the third try on the said pesky $4,000 resistance.
The risk:reward setup is also 3, same with my previous BTCUSD short trade plan.
Good luck again to me.
I hope you have learned something from my second crypto TA for today. Last but not the least will be Ripple XRP.
Enjoy the rest of the day!
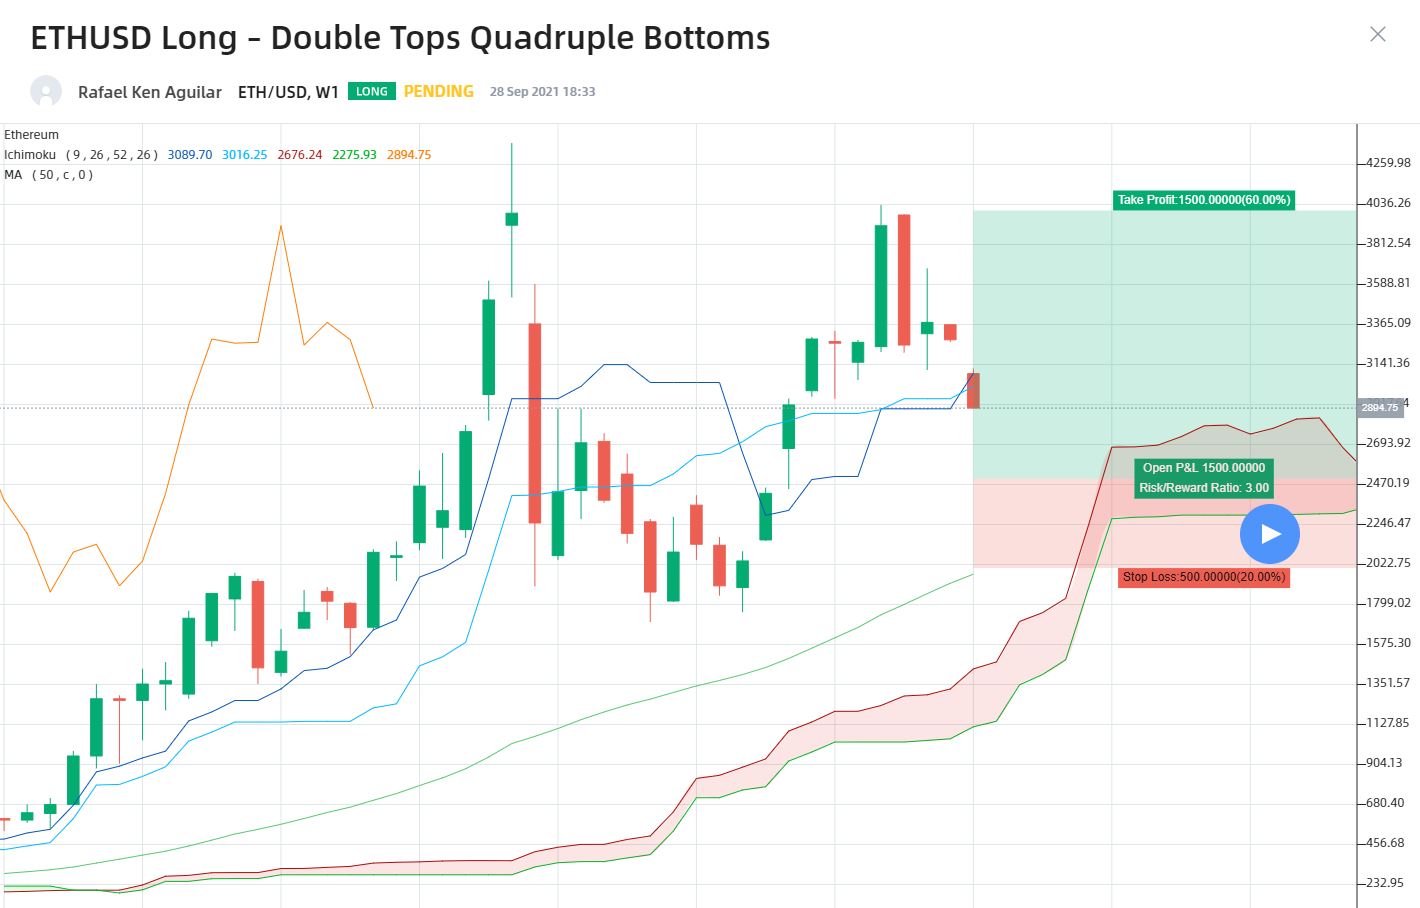
XRPUSD Long – Patience from Zhou!
***DISCLAIMER: I am not a financial advisor nor certified analyst and definitely not a pro trader. All contents discussed on this blogpost are solely my own personal views and for Trading education/entertainment purposes only. Crypto/Cryptocurrency Trading is extremely risky where losses can exceed deposits. Enter with discretion. Do your own research and due diligence. The basis of this trading analysis is purely technical in nature.***
Once again a happy Tuesday to all my kind readers!
This is the last but definitely not the least part of my 3-part crypto trade plans including Bitcoin, Ethereum and Ripple XRP.
I will now focus my attention for XRP which personally my favorite cryptocurrency of all time after I decided to enter crypto land more than 2 years ago.
When talking about the current situation or case for XRP compared to other digital assets out there, this coin is really in handicap mode at least 50% while other alts there including crypto leader Bitcoin 100%.
It is like a chess game wherein one player have fewer pieces which is so unfair!
So many controversies this crypto is in to but the biggest of them all is the still on-going lawsuit between the Ripple company against the US SEC. This case will soon turn one year this coming December 2020 and no one really knows when this comes to a close for good.
My title phrase is “Patience from Zhou” which I got from the epic DOTA 2 professional tournaments and no need to disclose details of the basis of this phrase. We are trading not playing online games. Agree? :-)
It is all about patience for Ripple XRP!
Let us head now to the technicals, XRP is closely following Bitcoin’s price action against the USD.
There is a big steep or high yet thin line/layer of the Ichimoku cloud with an estimated range of $0.47 to $1.11. Personally I can see this as the price volatility bounds. They can be the supports and resistances of course. The current weekly candle of XRPUSD and the incoming ones will just easily pass the said thin line/layer and the price is below the weekly Ichimoku cloud from that point going forward.
On the faster time frames like the 4-hour chart, we can see the 2nd bearish flag and pole formation after the recent September 6, 2021 local high at $1.41+. When comparing this quicker timeframe against the weekly, I can see the trend in bear’s grip hence selling will continue to support my call of a wider Wyckoff distribution.
If no positive news especially the on-going lawsuit, I think XRP is still subject around Bitcoin’s price action and will also share the move both downwards and upwards all depending on what the crypto leader will do.
Again patience, there is no harm in waiting for the right demand to come. Let us wait for the capitulation to happen before we go back to the mean reversion. So for this, I will place a bid order as long entry near the XRPUSD’s weekly 50 SMA but adjust a little lower to $0.69 where the weekly supertrend buy shouts.
Perhaps stop loss will be at the twin demand zones that occurred on June 22, 2021 and July 20, 2021. Nearly a month apart as convincing bullish reversal that hit that previous September 6 local top. It will be $0.51 as our prevention of further losses.
It will be a decent idea to sell/take profit at $1.40.
The risk:reward score for this trade plan is 3.94, no more no less.
Again, patience from Zhou! Like fishing waiting for the right moment and no distractions ahead.
Happy Tuesday all.
Good luck to me.
I hope you have learned something from my 3 crypto TAs dedicated for today.
Enjoy the rest of the day!
God speed!
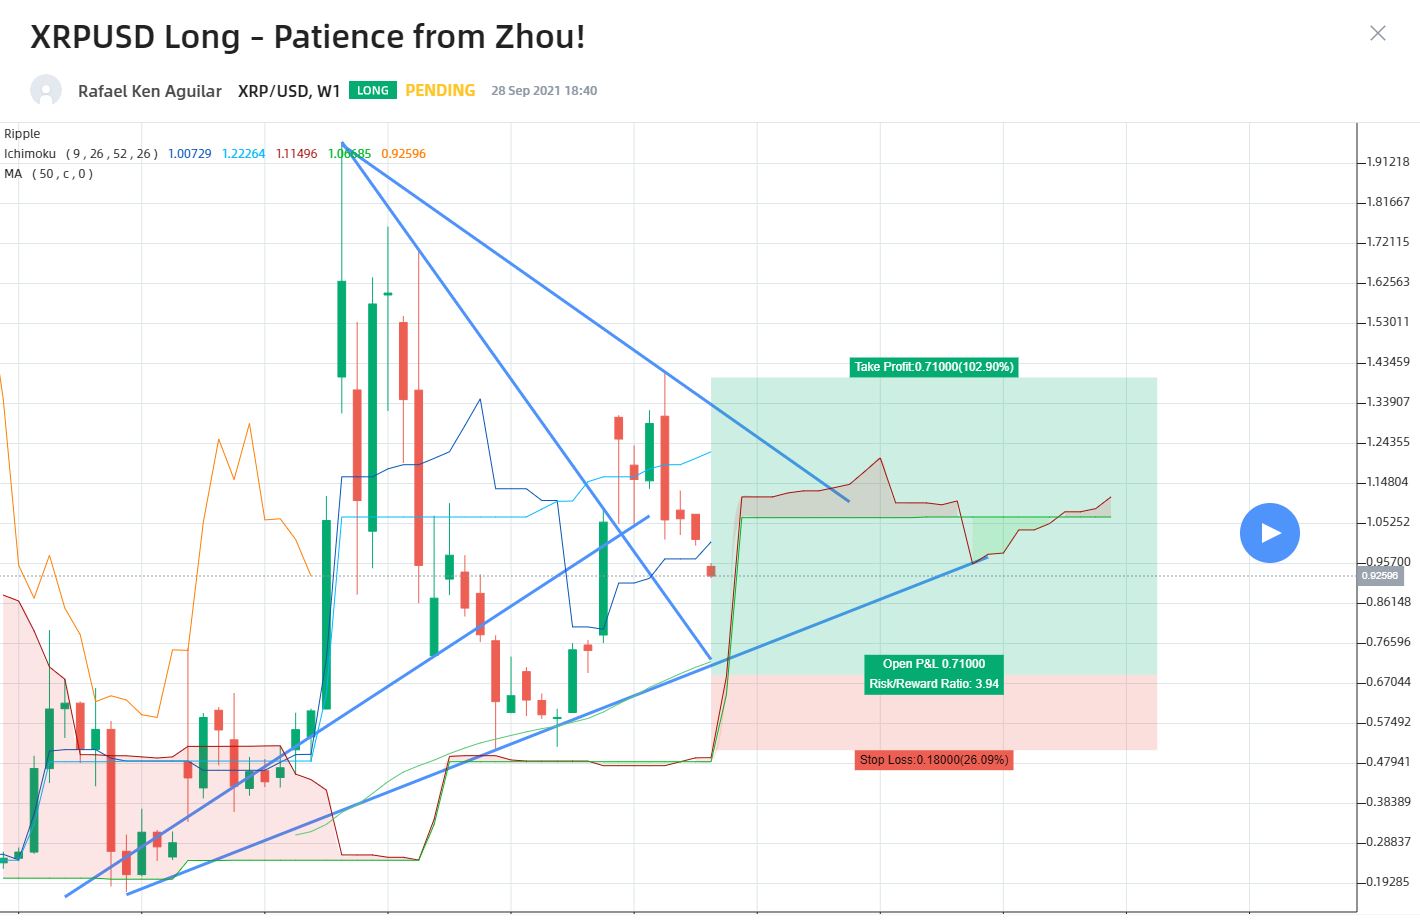
BTCUSD Short – Potential 30-35% Drop Towards Long Term 61.80% Fibonacci
***DISCLAIMER: I am not a financial advisor nor certified analyst and definitely not a pro trader. All contents discussed on this blogpost are solely my own personal views and for Trading education/entertainment purposes only. Crypto/Cryptocurrency Trading is extremely risky where losses can exceed deposits. Enter with discretion. Do your own research and due diligence. The basis of this trading analysis is purely technical in nature.***
Happy Tuesday all.
Today I decided to create a 3-part trade plans for the top cryptocurrencies including Bitcoin, Ethereum and Ripple XRP.
As a head start, let us discuss first and foremost Bitcoin as the overall crypto leader coin.
It has been a 24-week period of consolidation after BTCUSD printed its last all time high at almost $65,000.
Then we had 2021 yearly low last June at $28,600 then made a bullish run towards September hitting a fresh 4-week high.
The weekly time frame clearly shows 2 monster resistances starting with $53,000 and $57,000. These 2 are the main hurdles to bring back the crypto leader to play around its previous ATH circa.
What I worried now is this, BTCUSD’s last two weekly candles have finally touched the Ichimoku cloud signaling for more bearish momentums to come! In fact Bitcoin is still bullish in general and the last touch on the cloud occurred 85 weeks ago! So from this I can see that there would be a definite volatility in the crypto markets. Take note that Bitcoin’s current dominance index is still a threat towards alts.
Let’s continue, the weekly 50 SMA is even strategically placed right in the heart of the cloud and I speculate that $36,000-$39,000 can support and going to create dead cat bounces and when these happen, they will eventually turn the current price right now at the time of writing this article into a resistance which thankfully acting as support for now at least. That is the long term 38.20% Fibonacci in conjunction to Bitcoin’s last major dip on March 2020 at the start of global pandemic lead to financial meltdowns across all markets.
So without further ado, my trade plan for BTCUSD is to short the $41,000 price mark which I still give room for the bulls to protect this crucial 38.20% Fib. Lower timeframes especially 4-hour chart can have nasty max SFP high signal or stop loss triggers.
I will set a strict stop loss on the Ichimoku Kijun Line $45,000 which I suspect a quick profit exit for those trying to make long positions but I am still bearish bias for Bitcoin’s price action.
My short take profit exit will be near the Bitcoin’s 2021 yearly low but I adjust to $29,000 which is also strategically placed near the long term 61.80% Fib.
This trading plan has exactly risk:reward score of 3.
Good luck to me.
I hope you have learned something from my first crypto TA. Next will be Ethereum and XRP.
Enjoy the rest of the day!
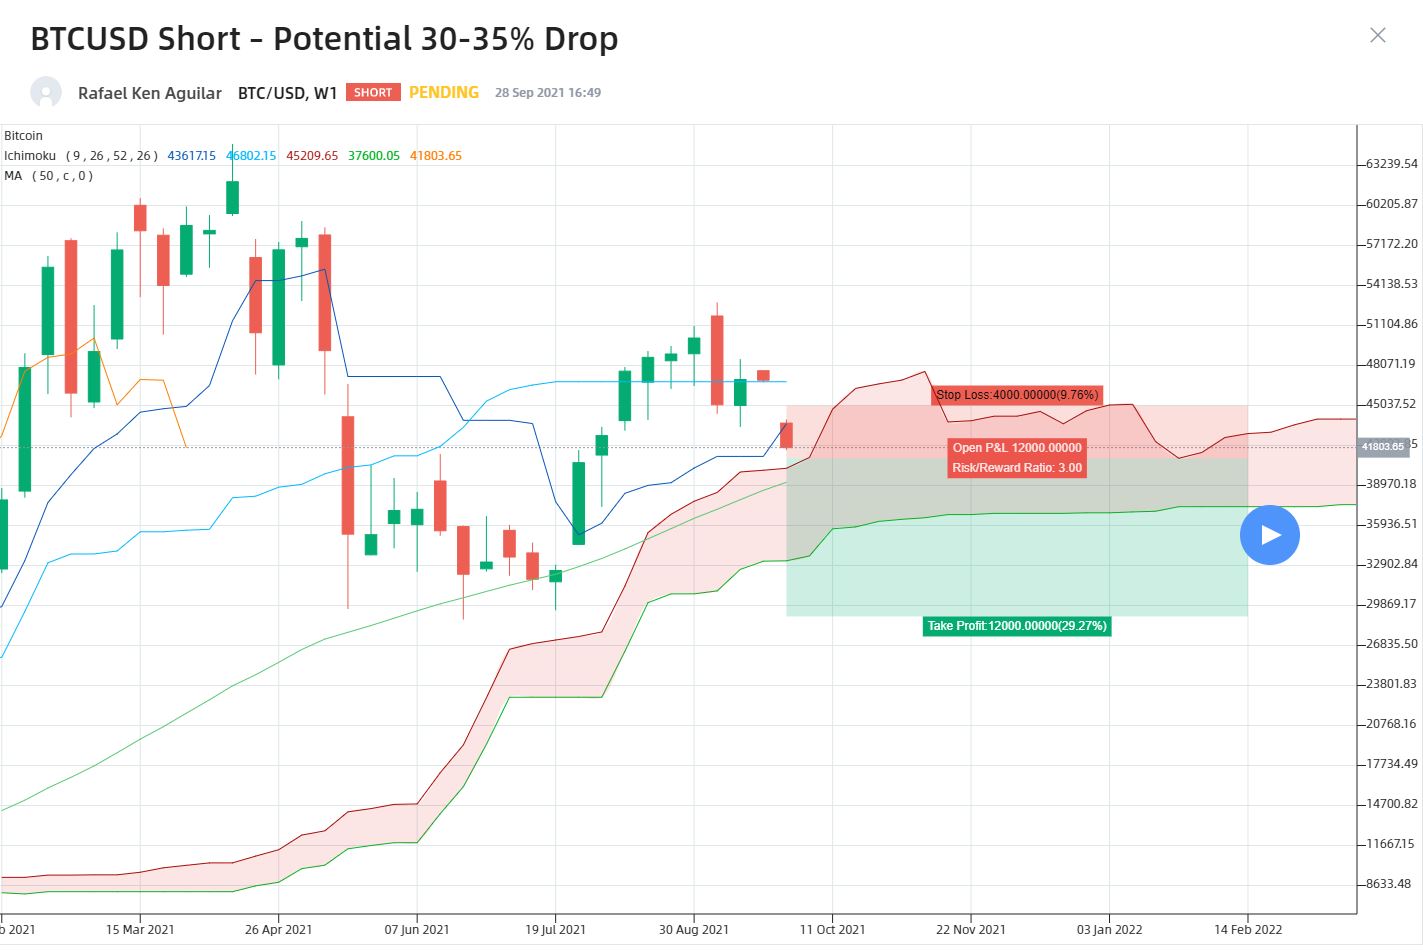
AUDJPY Long – A Bullish Weekly Railway Track might edge the Aussie
***DISCLAIMER: I am not a financial advisor nor certified analyst and definitely not a pro trader. All contents discussed on this blog are solely my own personal views and for Trading education/entertainment purposes only. Forex Exchange Trading is very risky. Losses can exceed deposits. Enter with discretion.***
https://www.finlogix.com/
*Image courtesy of* *Finlogix.com* https://www.finlogix.com/
Good day once again. As my second article for today, 30th of August 2021, I have thought carefully of which Forex pair that I am going to discuss a trading plan on. Firstly, I need to give some metrics to base analysis with and of course it will be safe to say that the US dollar can be the best reference currency. So I came up with the AUDJPY idea.
I am going to discuss in this article which currency I think will perform better against a strengthening US dollar based on how I assess the recent technicals as we go on.
Both the Aussie and Yen are down against the Greenback. The latter has been trading in a weekly range boundaries from 107.50 down low and 111.50 up above and consolidating for many weeks now. Meanwhile, the former made a latest weekly double bottom candles just enough grounds to hold a crucial 0.71 support! This latest bullish move may give room to re-test the break-in-support 0.73 which turned into resistance on the weekly view.
Let us go back to my question earlier, which among the pair can be the long side of the story by scaling down the balance. On the contrary, both the AUDUSD and AUDJPY weekly charts have similar price action by averaging approximately almost 10% correction since May 10, 2021 weekly high. So the answer can really rely on the one that perform better once Fed’s chair latest comments on USD tapering rolls out before EOY 2021.
The convincing weekly bullish railway track or double bottom candles for the AUDJPY chart on August 16-23 paved way for showing the long side will be in the base currency itself, the Aussie.
At the time of writing this analysis, the AUDJPY latest weekly candle for the week ahead August 30th is a Doji. So this can be a buy/long opportunity once the 23.60% Fibonacci retracement is re-tested, that’s 79.85 as my entry mark. Keep an eye on the daily RSI below 50 as resistance since June 23, 2021 so there is a possibility of sellers still setting the pace or control.
I will place a stop loss at the AUDJPY’s weekly 100 SMA around 77 to avoid further slide downwards. My take profit exit point will be near around the 10-week high, that’s precisely 84.
This is not much of a trading plan which only gives approximately 1.46 risk:reward ratio. Best of luck. Surely the Forex markets have become volatile lately with plenty of trade chances to take.
Thanks a lot for reading.
Have a wonderful and safe week ahead.
Big thanks to ACY and Finlogix trading platforms! https://acy.com/en/ https://www.finlogix.com/
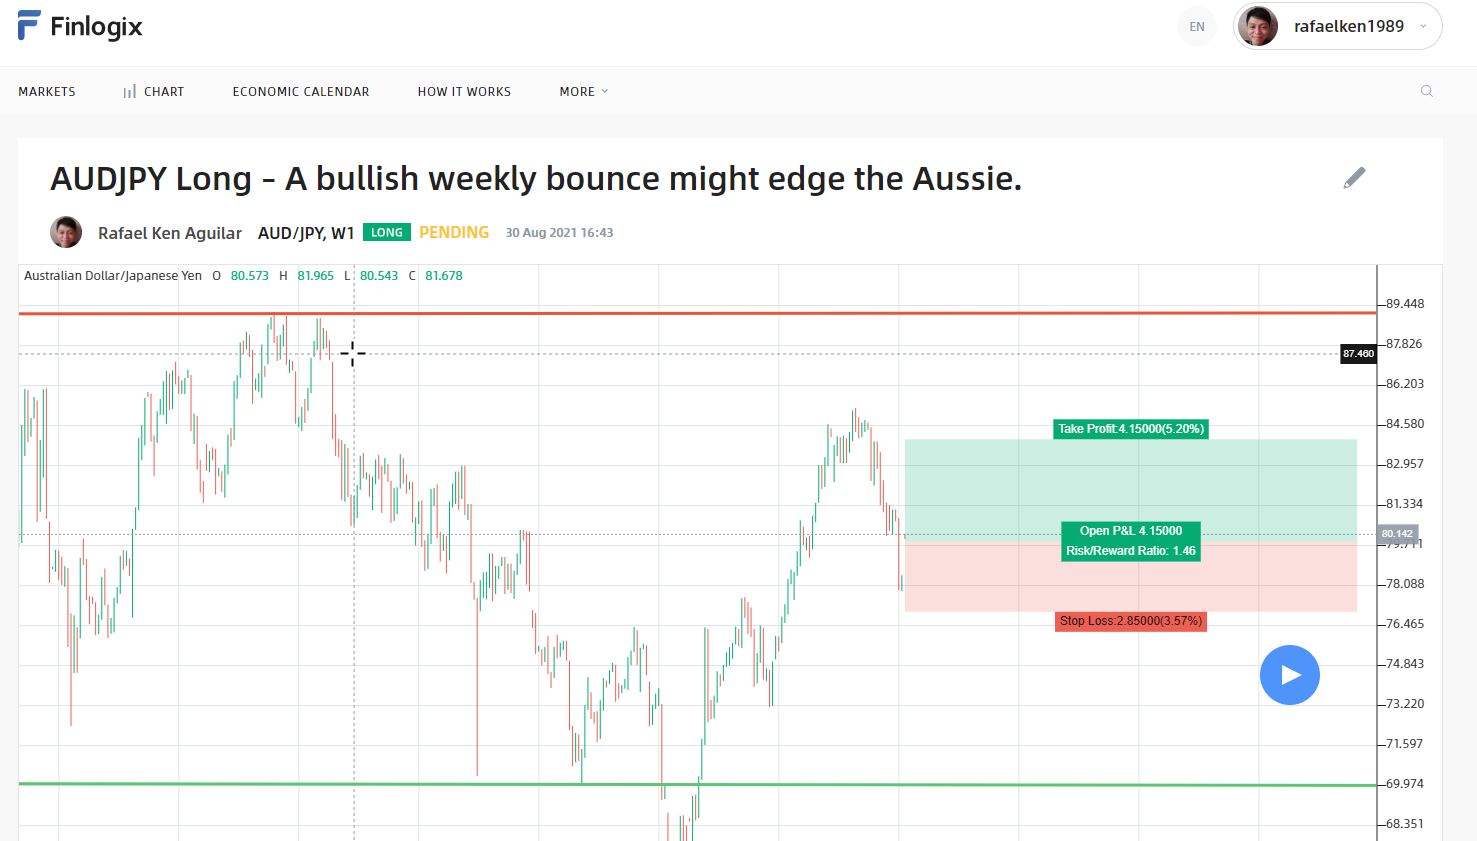
GOLD LONG Opportunity – Eyeing the Re-test on $2000 Psychological level
***DISCLAIMER: I am not a financial advisor nor certified analyst and definitely not a pro trader. All contents discussed on this blog are solely my own personal views and for Trading education/entertainment purposes only. Commodities/Precious Metals Trading is very risky especially when traded with leverage and CFDs. Losses can exceed deposits. Enter with discretion.***
https://www.finlogix.com/
*Image courtesy of* *Finlogix.com* https://www.finlogix.com/
Good day all. It has been a while since I have shared my latest technical analysis on the global markets but I thought today it will be great to send a new one especially on the Gold which captured my attention.
The XAUUSD monthly chart for August just performed a very bullish candle which has a long bottom wick which we all know telling us of a strong buying pressure knowing the fact that we are referring a high time frame.
Gold’s weekly volumes are also up in green in the last 3 weeks which suggesting fresh long entries.
The recent breakout on the important $1,800 price level might support Gold’s uptrend rally towards the psychological $2,000 mark knowing the fact that the yellow metal has always been one of the choices for a safe haven asset in the global markets’ perspective.
I am speculating traders and investors will wait for the final outcome now that Fed’s chair Powell has continue to push through for a tapering probably by the end of the year 2021. We must not forget that we are still facing on-going pandemic with its latest variant Delta in play wrecking havoc in the world’s economy. So an increase of volatility is always out there waiting.
Anyways, I will layout a trading plan for the Gold against the US dollar. Technically, a lot of resistances up above waiting starting from $1,835 which kept the yellow metal’s price at bay for seven consecutive weeks. It also happened that it is the weekly 50 SMA acting as a short term resistance. I see the weekly chart with mixed technical meters, the simple moving averages hinting for a correction while both the MACD and RSI indicators is ready for a bullish divergence.
I will make a bet and will be long for the Gold. I think $1,800 will act as support next time a small correction comes into play. Just a simple prediction since it was also one of the small resistances that halted Gold’s price higher so a bid confirmation will be good which will be a good entry, I keep an eye on $1,750 as stop loss which coincides the weekly 100 SMA. Definitely the psychological price level $2,000 is a good take profit exit.
This trading plan would roughly give us a risk:reward score of 4.00 which I like to give a shot.
Have a great trading week ahead and stay safe.
Big thanks to ACY and Finlogix trading platforms! https://acy.com/en/ https://www.finlogix.com/
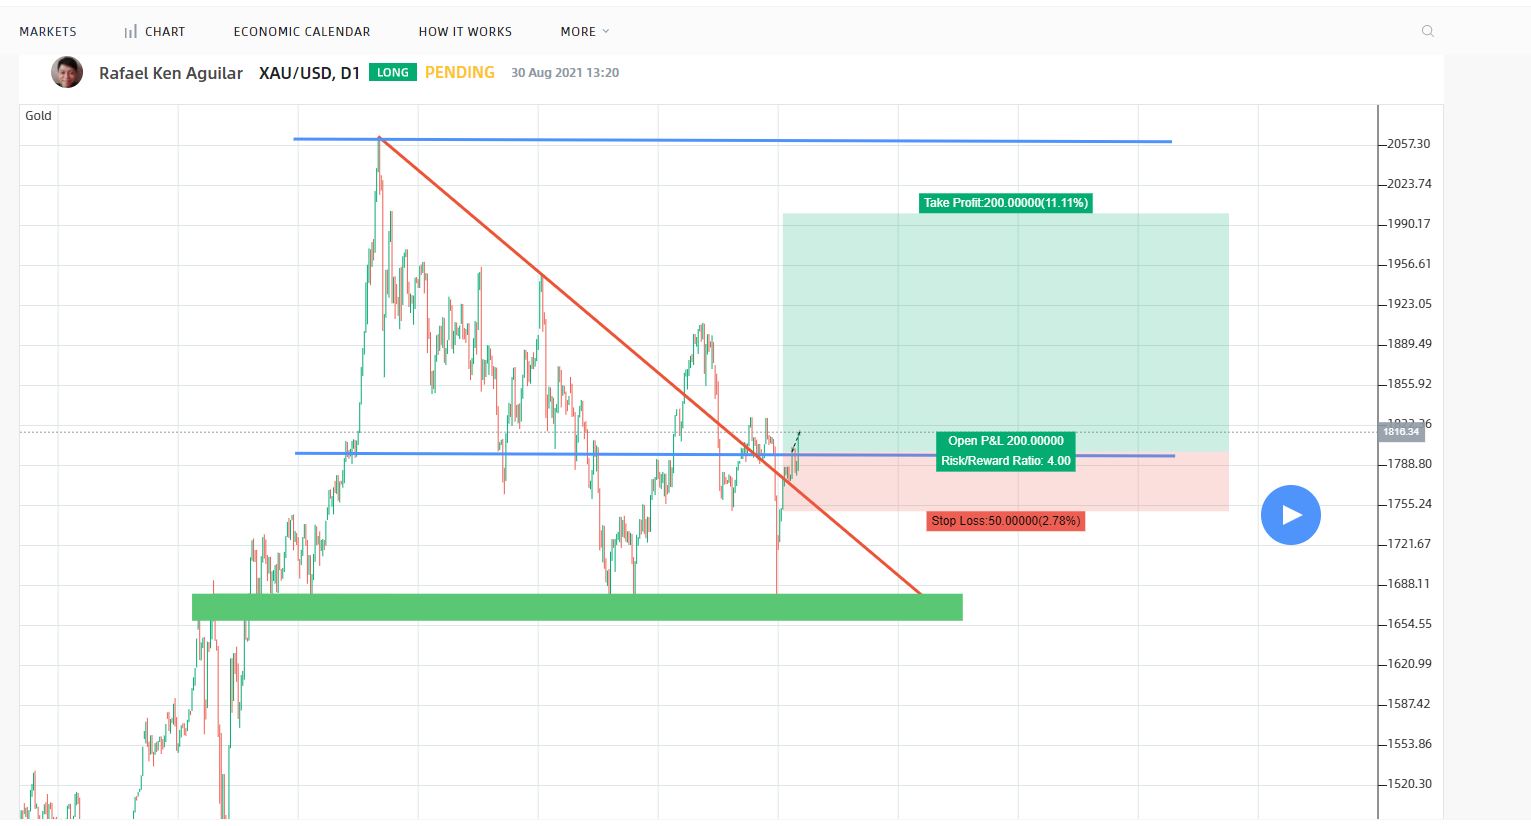
S&P500 Incoming Big Sell Offs - Technical Indicators Hinting A Bearish Reversal
**DISCLAIMER: I am not a financial advisor. All contents on this blog are solely my own personal views and for Trading education/entertainment purposes only. Trading any form of market instruments is very risky. Losses can exceed deposits. Enter with discretion.**
The recent June FOMC meeting inflation forecast for the first time signals higher interest rates in 2023 which clearly favored the US dollar rocketing higher against other major Forex trading pairs like Euro, British Pound, Aussie dollar, Swiss Franc and Japanese Yen. Greenback also managed to rallied higher against other currencies overnight against the likes of CAD and NZD. There is a recent break-out on the DXY daily chart but halted right away on its 200 daily SMA as the resistance of course.
Now my focus will be on the S&P500 SPX index which I am seeing very deadly bearish reversal according to the technical indicators that I have personally setup. So to speak everything I am going to discuss in the remainder of this article is solely based in my own honest opinion and definitely not a financial advice!
A big sell-offs incoming for the said index which will start with a bear cross (50 day SMA crossing the 100 day) which the daily Ichimoku cloud is waiting and once it is touched, more selling pressures will be expected. Although in short time basis, supports will immediately be found there but the overall scenario will all point for a death cross (50 day SMA crossing the 200) and worst, the 100 day SMA going to cross the 200 day eventually for a more convincing price correction. Currently, all leading indicators hinting for a take profit sell signal starting with a change of control into sellers' side on the daily RSI, Stochastic RSI, DMI and MACD convergence soon to bearish as buying volumes slowly taking over.
I will take profit on the early to mid (first to second quarter) 2020 price regions which the 3,000 as the best demand zone for it was the previous resistance and will act support once the big sell-offs occurring. I will put a close or near stop loss at 4,300 mark and gonna enter at 4,200 for some quick relief trade price.
Also I have this theory that Bitcoin and the S&P500 index are somehow correlated according to the price action history in the long timeframe charts with the Greenback rising which I have mentioned at the beginning of this analysis. Therefore both trading instruments will fall and going to make same timing of price corrections before a reset in bull run.
Thanks for reading my latest analysis for today.
Happy trading and God speed!

 @rafaelken1989