 @rafaelken1989
USDJPY SHORT – A first re-test on the 5 year high! ***DISCLAIMER: I am not a financial advisor nor certified analyst and definitely not a pro trader. All contents discussed on this blogpost are solely my own personal views and for Trading education/entertainment purposes only. Forex/FX Trading is extremely risky where losses can exceed deposits. Enter with discretion. Do your own research and due diligence. The basis of this trading analysis is purely technical in nature.***
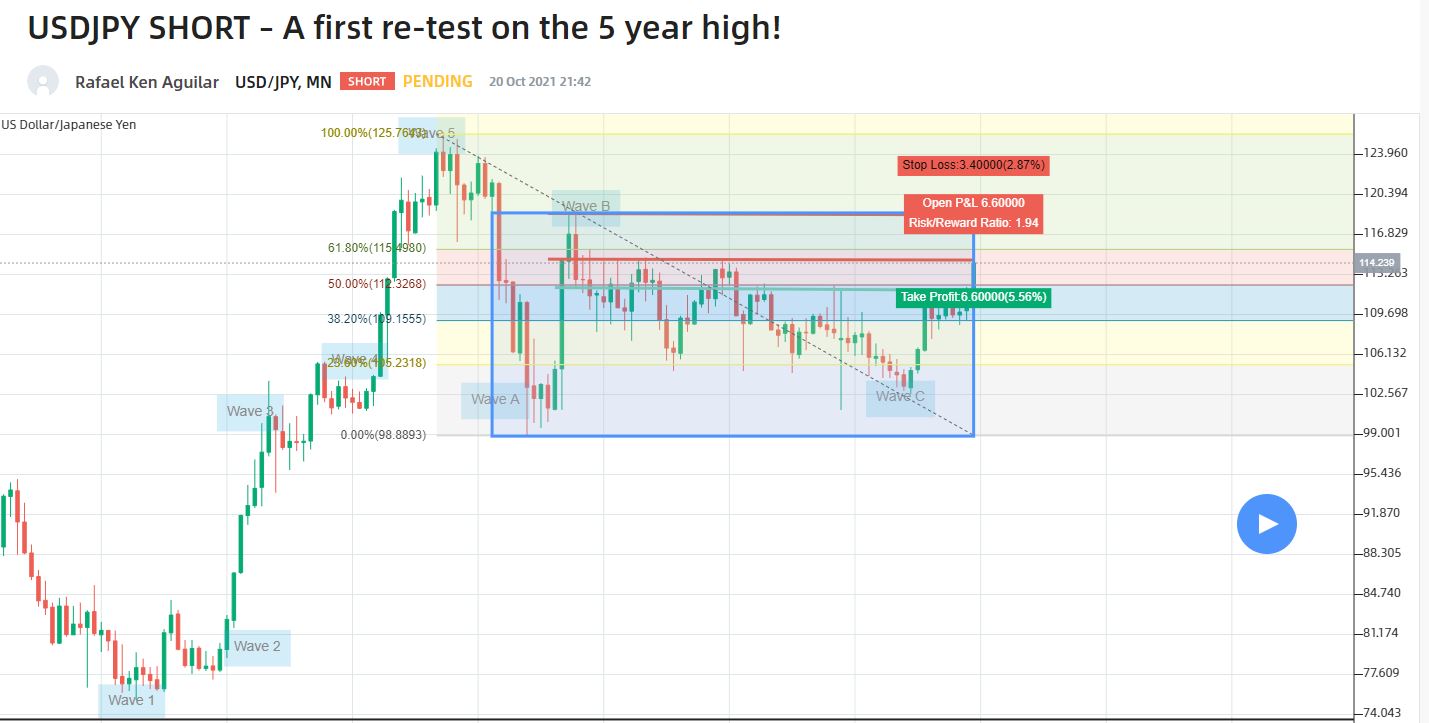
Hello once more. I have decided to create my second Finlogix technical analysis for the USDJPY FX pair. Not so long ago, last January within this year 2021, I have created a long trade plan for the Greenback against the Yen with a risk:reward ratio of 2. Luckily, it was a hit and I am proud to say as one of my winners! You can review its trading plan details on my profile. I have also mentioned in my previous Nikkei long analysis about some insights for the USDJPY citing it as one of the key movers last week. I totally understand that quicker time frames can offer much safer risk protections but I prefer to use the USDJPY monthly chart this time to explain what I am seeing on the macro side of trading. In fact, using the monthly time frame gives me a clearer view of the pair’s price action in the long term scenario. I will give credit first for the USDJPY buyers being able to push the price to a fresh 3 year high! To be more conservative, the 115 mark is a juicy sell zone already but I speculate that the buyers are still not done yet. After breaking the 2 year resistance found at the 112 mark (50% Fib retracement), the USDJPY is still bullish on the monthly chart based on its monthly RSI! Once the weekly correction is through, I am convinced that 112 now is a flipped S/R and next target will be the 115.50 (61.80% Fib retracement) which we can have a bullish extension possibility towards the USDJPY’s 5 year high! I have also layout my monthly Elliot waves theory and looks like ABC correction is done last December 2020 to January 2021 double monthly candles followed by a fresh motive phase. From my Wyckoff’s perspective, we are still consolidating which I highlighted the range bounds in blue rectangle and might trigger for a re-accumulation mode. If my analysis is correct, the monthly RSI can also re-test upward levels to support confluence from what I am seeing. My USDJPY short entry will be the said 5 year high (double top monthly candles) set at the 118.60 mark. Take profit will be at the anticipated flipped 112 S/R which will become a very strong demand zone. The stop loss will be strictly observed at the 122 mark in case of an overbought scenario. Overall the risk:reward score for my second USDJPY trading plan will be 1.941. I hope this one makes another winner for me. Good luck! Thanks a lot for reading my latest Finlogix analysis. I do hope you find my insights informative. Cheers!

7 comments
I am also trading USDJPY. I'm also catching the down wave
awesome thanks!
How long have you been in the trade? I trade about 5 years. This is my trading account https://www.myfxbook.com/portfolio/pro6677028-ctrader/6227926
im in my 3rd year boss and i continue to learn... thanks a lot! We can talk more boss I want to learn from u as much I want to give my experience.
Which sect do you trade? I am trading under ichimoku. I am also sharing my course from Japan on ichimoku.
I use a lot! Ichi is one of them. It is so hard to explain here but I setup my own trading system that works for me but not guaranteed. Do you have whats app?
I use telegram