Ichimoku Japan: 3.4 Some notes when using
When we use Three Gold Cross Signals and Three Dead Cross Signals. We have some notes.
When we are waiting for Three Gold Cross Signals to buy or waiting for Three Dead Cross Signals to sell is often too late for volatile market. Many traders want to take trades by the 1st signal, however, often times it becomes fake. So you need to decide whether to take trades early with potential fakes, or to wait for the Kumo breakout which is relatively late but with less fakes
When the market is in a range, all the lines will interact with each other. In this case, you cannot take trades depending on Sanyaku signals as they are only reliable when the market is on a trend. I will talk about range trade strategy on later chapter in this book.
Ichimoku Japan: 3.3 Three Dead Cross Signals
In the previous post we learned about "Three Gold Cross Signals". Today we continue the part "Three Dead Cross Signals" https://read.cash/@Trading6677028/ichimoku-japan-32-three-gold-cross-signals-c688c755
Three Dead Cross Signals it is a collection of 3 conditions following an downtrend.
• The Tenkan sen breaks below the Kijun sen,
• The Chiko span breaks below the candlestick,
• And the price breaks out of the Kumo,
Again, be careful that the price breaks out of the Kumo does not mean Three Dead Cross Signals. The right order should be 1. Tenkan sen breaks below the Kijun sen,
2. Chiko span breaks below the candlestick, then 3. when the price breaks out of the Kumo, it's called Three Dead Cross Signals. When the market reverse to the downside, and when price is breaking Kumo downwards, usually Tenkan sen is already breaking Kijunsen below and Chiko span is also breaking the candles. But there are times when price breaks Kumo but you don't see the Tenkan sen breaks below the Kijun sen and Chiko span breaks below the candlestick yet. And that's when you can realize the market is not in a right order for reversing movement.
So remember the right order of Three Dead Cross Signals and Three Gold Cross Signals. https://read.cash/@Trading6677028/ichimoku-japan-32-three-gold-cross-signals-c688c755
Tenkan sen and Kijun sen cross happens relatively earlier. Chiko span break is going to be the second signal. Then Kumo breakout usually becomes the last signal.
[Buy signals]
• Kouten of Kinko Hyo = early buying signal
• Kouten of Chiko span = slightly early buying signal
• Sanyaku Kouten = late buying signal
[Sell signals]
• Gyakuten of Kinko Hyo = early sell signal
• Gyakuten of Chiko span = slightly earlier sell signal
• Sanyaku Gyakuten = late selling signal
In the following article, we will learn about some notes when using: Three Dead Cross Signals and Three Gold Cross Signals. https://read.cash/@Trading6677028/ichimoku-japan-32-three-gold-cross-signals-c688c755
*If you find it useful, please like and share!*

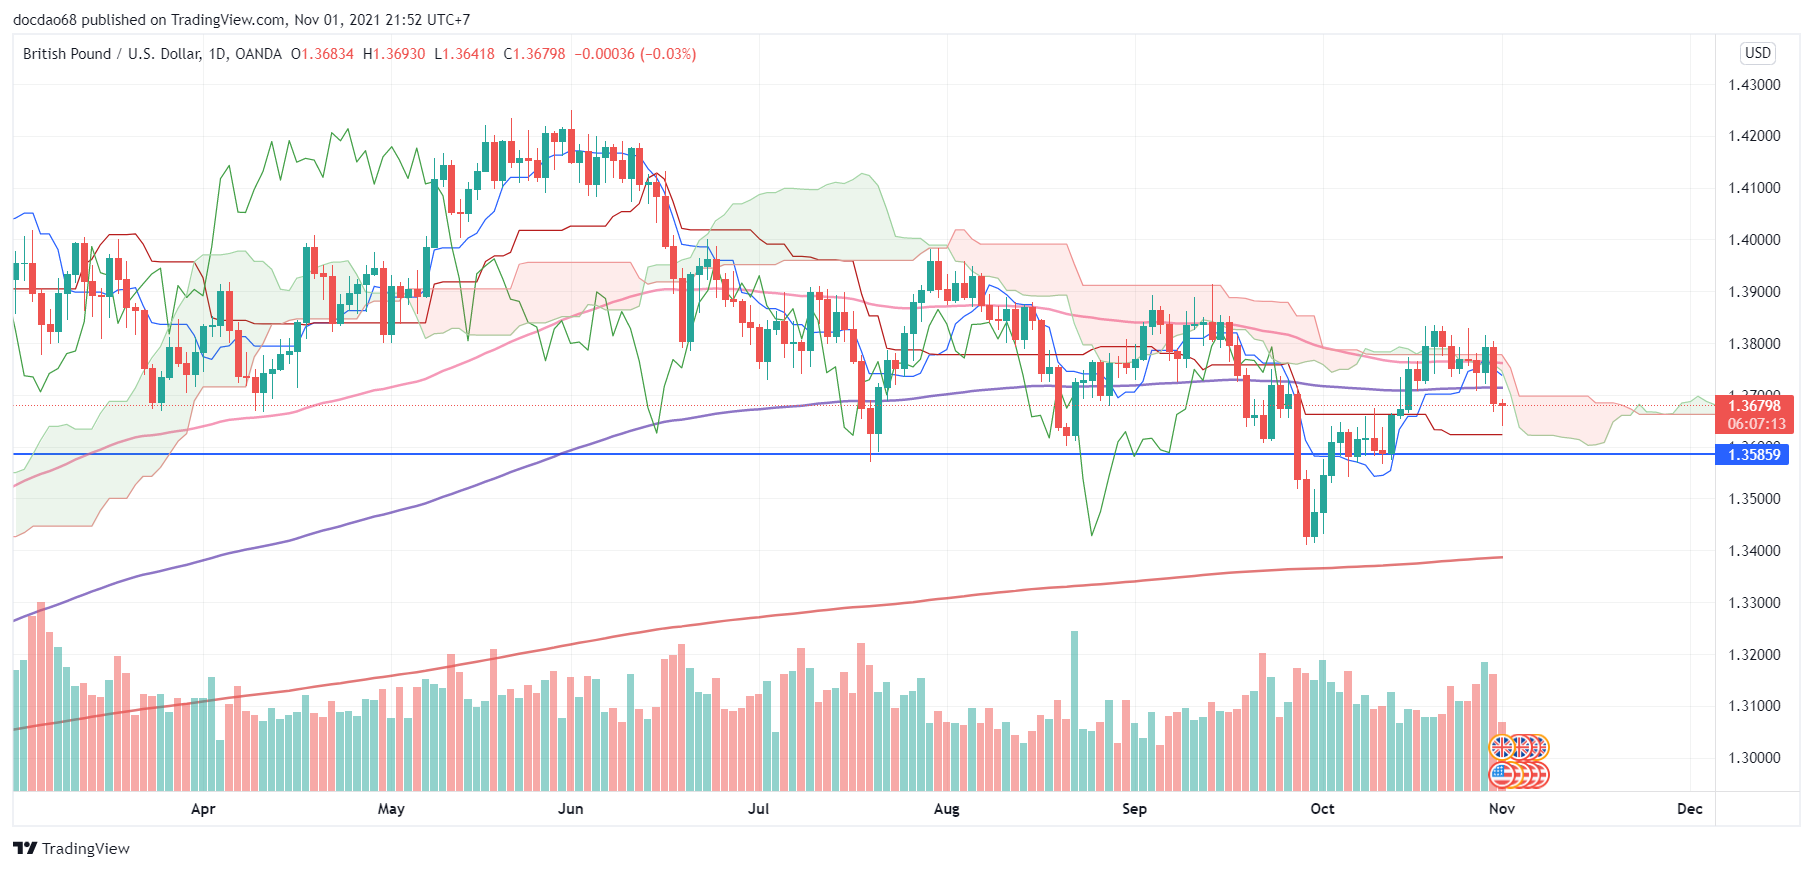
Waiting for the opportunity to sell GBPUSD
https://www.tradingview.com/x/ZWsdJAEB/
Waiting for the opportunity to sell GBPUSD
Ichimoku Japan: 3.2 Three Gold Cross Signals
In the previous post we talked briefly about Three Gold Cross Signals. So what exactly is it, today we will find out. Three Gold Cross Signals it is a collection of 3 conditions following an uptrend. https://read.cash/@Trading6677028/ichimoku-japan-31-the-signals-cross-80301dfb
1. The Tenkan sen breaks above the Kijun sen
2. Then the Chiko span breaks above the candlestick
3. And then, The price breaks out of the Kumo.
Be careful, that the price breaks out of the Kumo does not mean it is "Three Gold Cross Signals". It happens after the Tenkan sen breaks above the Kijun sen, the Chiko span breaks above the candlestick, and then, when the price breaks out of the Kumo, it’s called "Three Gold Cross Signals". When ''Three Gold Cross Signals" happens in the market, usually both the the Tenkan sen breaks above the Kijun sen and Chiko span breaks above the candlestick are already happening as below chart. But often times it's misunderstood that Kumo breakout itself is "Three Gold Cross Signals". In other words, even when the price breaks Kumo
Usually, Three Gold Cross Signals happens below order.
1. Gold cross of Kijun sen and Tenkan sen
2. Gold cross of Chiko span and Candles
3. Kumo breakout
This is the basic order when market changes the momentum from bear to bull. That means, if the order changes, you will know that's not in an ordinary price movement.
Next post we will continue with "Three Dead Cross Signals"
If you find it interesting, please support by liking the post.

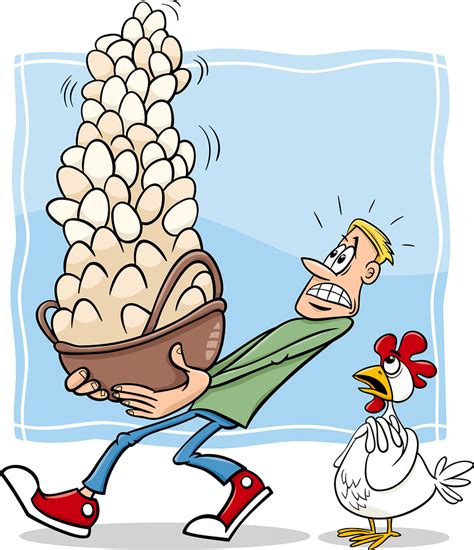
Forex: Solution "Don’t put all your eggs in one basket"
In Forex investment, To solve the "**Don’t put all your eggs in one basket**" problem we usually open accounts on 2 or 3 different brokers.
If with the same type of analysis to enter the order. When we need to enter an order, we have to open the trading platform of 2 or 3 brokers. That leads to complications when we enter, close orders or adjust stoploss, Take profit.
So our solution is: We use copy trade. That is, when we open an order on account 1, automatically on account 2,3 will automatically open an order. So we only open the trader platform of a Broker, other brokers will open orders accordingly. Then we can guarantee the "**Don’t put all your eggs in one basket**" factor.
Now which copy trading platform do we choose? For me, I chose Ctrader copy.
With ctrader copy we do not charge for Ctrade but we only pay fees between accounts.
If you have a better solution, please share it with me.
Thank you for reading the article.
Ichimoku japan: 3.1 The signals cross
In the previous post we learned about: The meaning of line cross. Today we will talk more about crossovers
Usually, when it comes to “signals” in Ichimoku Kinko Hyo, they are written in books or on the websites as below.
Buy signal
1. Buy when the Tenkan sen breaks above the Kijun sen (cross from bottom to top).
2. Buy when the Chiko span breaks out of the candlestick (cross from bottom to top).
3. Buy when the price breaks out of the Kumo (the price breaks through the upper Kumo).
Sell signal
1. Sell when the Tenkan sen breaks below the Kijun sen (cross from top to bottom).
2. Sell when the Chiko span falls below the candlestick (cross from top to bottom).
3. Sell when price breaks below the Kumo (price breaks through the lower resistance band).
Now, they are not wrong but the explanations are too short and therefore, you cannot use these signals correctly. For example, there are three buying signals but you may not know which one becomes trustable under certain market condition.
So to minimize false crossings, we have the concept: **Three Gold Cross Signals** and **Three Dead Cross Signals.**
To better understand these two concepts we will continue in the next article.

Ichimoku Japan: 2.4 The meaning of line cross
In the previous section we know about the formations of lines in ichimoku. Today we will continue with the next part. The Cross lines
Every time when price crosses each line, it has meanings, such as the price crosses the Tenkan sen, crosses the Kijun sen, crosses the Chiko span, crosses the Senko span 1, and crosses the Senko span 2. But not only that, when a line crosses the other line also has a significant meaning to know how the market sentiment is changing at a glance.
In Ichimoku Kinko Hyo, crosses of each line are significant.
For example, famous one is the crossover between the Tenkan sen and the Kijun sen. When the Tenkan sen crosses the Kijun sen upwards, it is called a sign of an uptrend (so-called buy signal), and if the Tenkan sen crosses the Kijun sen downwards, it is called a sign of a downtrend (so-called sell signal).
Now, there are many times where any two of the five lines cross on the market. In fact there are important crosses and non-important crosses, which I will explain step by step in later part. For now, just keep in mind two things as below.
• All lines become potential resistance and support lines.
Crossesofeachlineareimportantandhavedifferentmeanings

Why you should choose Ctrader copy?
Today there are many copy trader services. But which platform should you choose?
The cTrader copy service is a much-improved platform that allows traders to copy the successful strategies of other traders and one of the key benefits is that anybody can become a strategy provider and make money by sharing their trade signals. The copy service includes some very good risk management tools for commitment-free investing.
Strategy Providers
The strategy provider can be anybody who wishes to share their trading system and its performance by providing signals for other traders to follow, strategy providers can set the amount of commission they wish to charge to copy their trades and this is how they are remunerated for their hard work.
**Investors**
These are traders who wish to follow the trades of the strategy providers and hope to also gain winning trades, in return, they pay the strategy provider a small fee for the signals. Investors have the option to review each strategy providers historical performance and choose which one they feel is better, there is no time limit or contract and the investor can stop copying at any time.
**Is it a Scam?**
This type of trade copying is not a scam and can help investors create wealth quickly, but it does have risks for new traders who do not know what information to research before they start copying, follow the tips below so you do not get burned and lose your money.
**How to Choose a Strategy Provider**
If you are an investor and wish to start using the cTrader copying service then you need to make sure that the provider you are going to follow ticks the following boxes.
They have been providing signals for more than 6-months (look at **strategy creation date**).
In the past 6-months, there has been an increase in profits.
Make sure you are happy with the performance fee the provider charges to copy trades.
Do not risk more than you are willing to lose.
Unlike other social-trading. When you do copy trade on Ctrader. You do not have to pay fees to Ctrader.
Link **My account**: Pass: 7bvAIEhE5g https://t.co/wgSeGmVgkp?amp=1

Ichimoku Japan: 2.3 Ham-me
A new term used in Ichimoku that I learned from the course in Japan. That is Ham-me. So what is Ham-me, let's find out
As you learn the formulas, you can see that there are friends in lines of the Ichimoku Kinko Hyo. In fact, there are lines that are added and divided by 2.
Using the formula of adding the highest price and the lowest price of the past and divide it by 2, the lines are the Tenkan sen, Kijun sen, and two of the Senko span 2.
A sum of the highest price and the lowest price for the past fixed period, divided by 2, that is simply the middle price level for the past fixed period. This is called Ham-me, means half price in Japanese. Therefore, Tenkan sen, Kijun sen, and Senko span 2 are referred to as Ham-me lines.
In Ichimoku Kinko Hyo Ham-me represents "market level." The Tenkan sen indicates the market level for the past 9 candles, the Kijun sen indicates the market level for the past 26 candles, and the Senko span 2 indicates the market level for the past 52 candles.
And when the market level is moving up, it's the uptrend, and when the market level is moving down, it's the downtrend.
In uptrend the Ham-me line moves up. In downtrend the Ham-me line moves down. Under consolidation the Ham-me line goes flat, up, down in short cycle.
What can be identified by the Ham-me line
• In uptrend the Ham-me line moves up.
• In downtrend the Ham-me line moves down.
• Under consolidation the Ham-me line becomes flat or moves up and down in short cycle.
Hence, the angle of the Ham-me line indicates a trend. So, what I want you to understand in this chapter is that the Tenkan sen is a line that represents the short- term (9 candles) trend. The Kijun sen is a line that represents the mid-term (26 candles) trend. And the Senko span 2 is a line that represents a long-term (52 days) trend.

What platform are you using to trade?
We have many platforms to trade. Each platform has its own strengths. So which platform do we choose? For me, I chose the Ctrader platform. Because it has several advantages:
Access cTrader Trade – a premium charting and manual trading platform offering advanced charting tools, advanced order types, level II pricing, and ultra-fast execution.
View 54 different timeframes across a variety of chart types including Candlesticks, Bar, HLC, Line, Heikin Ashi, Dots, Renko, Range, and Tick charts.
Use more than 70+ technical trading indicators built into the platform and access customised indicators via cTrader Automate.
All-inclusive algorithmic trading solutions via cTrader Automate. Traders can use cTrader’s C# API to write code and create automated trading strategies and develop customised indicators.
Build your own trading applications via cTrader Open API, a free and secure publicly accessible API for everyone. Developers can use the cTrader platform’s web, desktop, and mobile infrastructure to build upon.
Access ultra-fast execution speeds with the cTrader FIX API which communicates directly with the cTrader server for low latency communication – completely free for traders using one of the right cTrader brokers.
Trade from cTrader Desktop, cTrader Web, cTrader Android, and cTrader iOS.
Access market sentiment, a live news feed, trade statistics, market depth, and advanced order protection among other features!
**Specially**, cTrader Copy investment service. This allows traders to become a Strategy Provider and broadcast their strategies, among others scalping, for other traders to follow for free or for a fee. I am also using this feature with my account. It is also working very well.
Link My account: Pass: 7bvAIEhE5g https://t.co/wgSeGmVgkp?amp=1
Or: link Myfxbook https://t.co/pSpUsNF99p?amp=1


Ichimoku Japan: 2.2 Formulas of each line
The main theme of this chapter is to master the formulas for each line of the Ichimoku Kinko Hyo. Below is my basic concept when studying any indicators.
1. Remember the formula for an indicator. (Better be able to recall it at any time.)
2. Understand the meaning of the formula and understand what the technical analysis is trying to look at within the market.
3. Understand why the buy / sell signals of the indicator become a buy chance or a sell chance. You cannot say you can “use” an indicator unless you understand it this way.
Now, no indicator is 100% accurate. The technical indicator is effective as a whole, including fakes. If so, you must think of technical analysis as a fight against fakes, meaning you need to understand under what condition the indicator tends to give fake signals and therefore, need to be careful to take trades so that when the fakes really happen, you can expect those potential fakes correctly. And when it turns out to be a fake, you can immediately deal with it. But if it turns out to be non-fake, then you can take trade and grow your profits as much as possible. I believe this is the secret to become a technical analysis expert as a pro trader.
In general, most of the traders try to know what buy signals and sell signals are without understanding the formula of a particular indicator, and there is no chance to succeed in that way because when the signals work, you can earn profit but when they don’t work, you cannot deal with it. Then novice traders will say “the signals don’t work” although the real problem is where they do not understand how to use them correctly.
So, it’s always important to remember the formula. And don’t use indicators if you don’t remember. Above all, the formula of the Ichimoku Kinko Hyo is simple, that as Ichimoku Sanjin states, “even elementary school students can understand.” So, traders, please discard the image that the Ichimoku Kinko Hyo is difficult. It’s actually really simple. At a glance, you can capture trend and range.
* All candles in the Ichimoku Kinko Hyo are counted INCLUDING the current candle. There is nothing so complicated, right?
If you simply shift the current close price to 26 candles back, you get Chiko span. There is no such simple thing. The Senko span 1, which would be the most difficult to remember, is that you only take mid price of the Tenkan sen and the Kijun sen and forward it to 26 candles.
The formulas are not difficult, but you may just feel difficult because you don’t know why they are delaying or forwarding.
Often times Ichimoku Kinko Hyo is used in daily timeframe analysis but it is valid even for bigger timeframes such as weekly or monthly. It is also effective for smaller timeframes such as 5 minutes or 1 hour. Also, not only forex, it’s effective to Stocks, commodities, and Cryptocurrencies (Originally Ichimoku Kinko Hyo was invented for Stock analysis but now we know it works on any markets).
Basically, the settings of Ichimoku Kinko Hyo is fixed at 9 or 26 or 52 as default unlike other indicators. That’s because the numbers 9, 26, 52, etc. are significant in the market, just like Fibonacci numbers, like 38.2 or 61.8. There are cases when you can change the settings and compare with the original, like Chiko span, however, 9, 26, and 52 are the defaults and there is no need for general trades to change them around as it’s already powerful by itself.

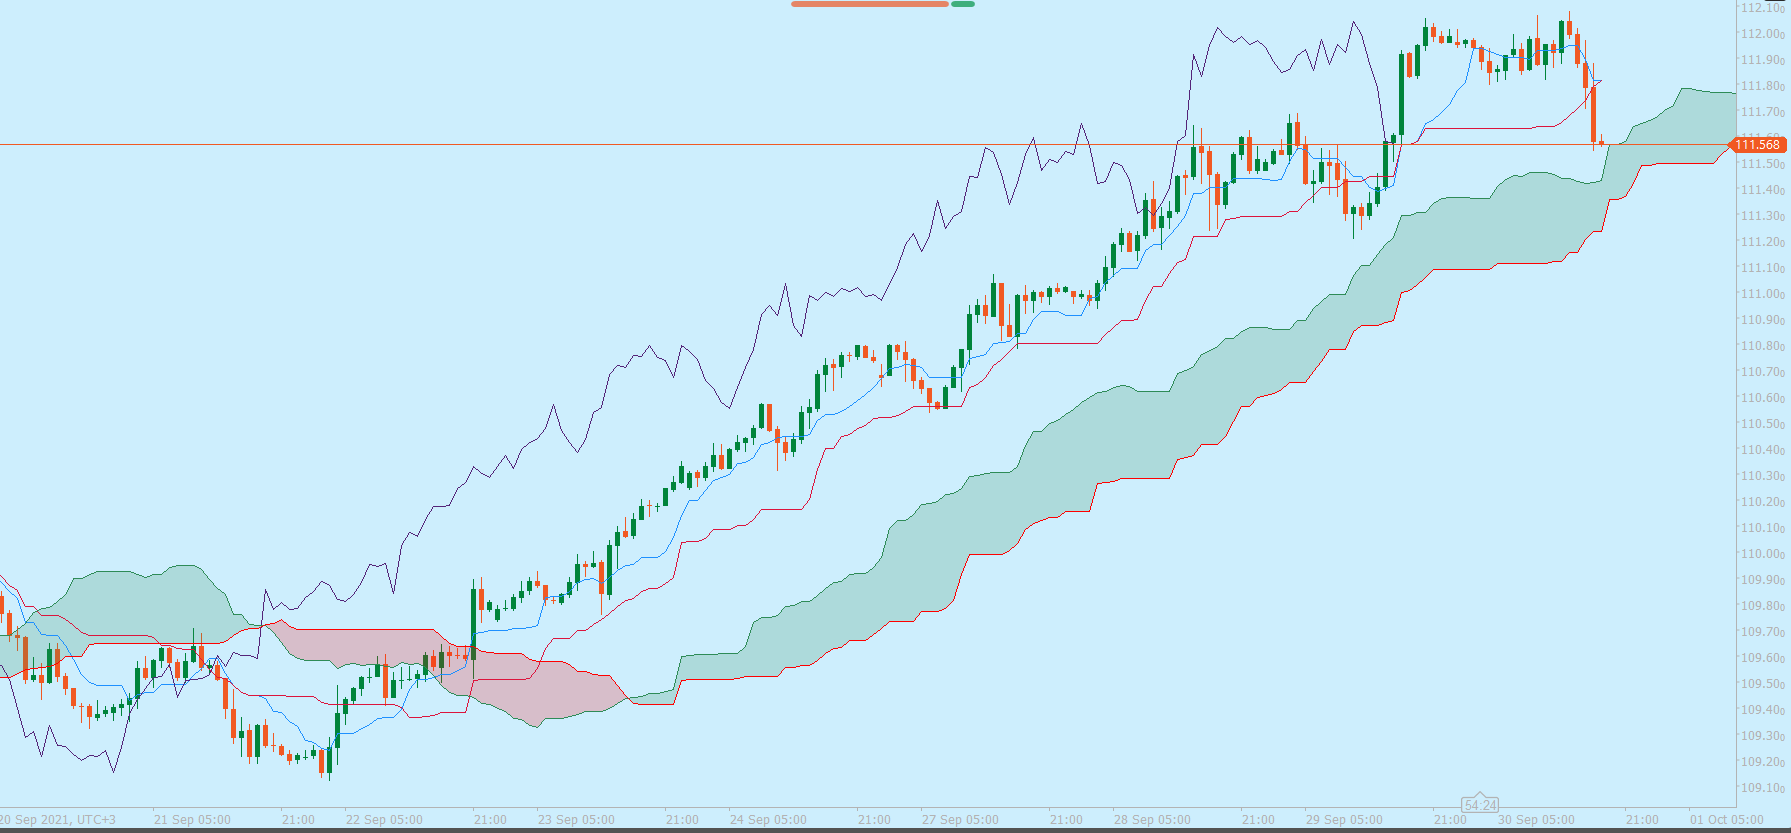
USDJPY
The opportunity to sell USDJPY continues. Target 112.00
Ichimoku Japan: 2.1 Mastering the calculation of 5 lines
The only line that’s delayed, the yellow line, is Chiko span. Of the green and blue lines that move along with the price, the blue is relatively closer to the price and the green is slightly away from the price, so the blue one is the Tenkan sen and the green one is the Kijun sen. And Senko span 1 and 2 are the ones that make up the Kumo. In up Kumo, the lower part is the Senko span 2 and upper part is the Senko span 1. When the Kumo is moving down, upper part becomes Senko span 2 and lower part becomes Senko span 1.
Now, remember the order in which the market is in a stable trend. The order of the five lines during the stable bullish is, from the upper left to the lower right, the alighment becomes Chiko span, Tenkan sen, Kijun sen, Senko span 1, and Senko span 2. And the price lies between the Chiko span and the Tenkan sen. Look at the attached chart.
In contrast when market is on a stable bear trend, from the upper right to the lower left the alignment becomes Senko Span 2, Senko Span 1, Kijun sen, Tenkan sen, and finally Chiko span. And the price should be again located between the Chiko span and the Tenkan sen.
It is very important to remember this order. When the order is changed by lines cross, it becomes a proof for retracement and/or trend change.
Also, all the lines in Ichimoku Kinko Hyo become potential resistance lines as well as support lines.
When the market is bullish and price retraces and gets close to one of the lines, for example, the Senko span 1, the price might be supported by Senko span 1. In contrast when price goes up towards Kijun sen while market is bearish, the price could be resisted by the Kijun sen and continue to go down. However, once it breaks through the Kijun sen, it can go further upwards to Senko span 1. Then, it might be next resisted by the Senko span 1 and may pushed back down from there.
And not only the lines work as resistance and support for price, but they also work as resistance and support for each line. For example, when the market is bullish, you can often see that the Chiko span is supported by the Senko span 1 and pushed back up. This means that the Senko span 1 works as a support line for the Chiko span. So it is important to keep in mind that all lines work as resistance and support for price as well as each line.


GBPUSD
When the price falls through 1.3600, the price can move towards 1.340
Ichimoku Japan: 1.3 How to distinguish 5 lines
- Tenkan sen: A line that moves closer to the candles
- Kijun sen: A line that moves far from candles than Tenkan sen. When the market is in a range, it moves more horizontal than Tenkan sen.
- Chiko Span: An only line that is delayed from the current candles
- Senko Span 1: A line that is ahead from the current candles. It moves up and down more often than Senko Span 2. When Kumo is moving down, Senko Span 1 becomes the lower part. When Kumo is up, it becomes the upper part.
- Senko Span 2: A line that is ahead from the current candles. Less active than Senko Span 1 and moves horizontal more often than Senko Span 1. When Kumo is moving down, Senko Span 2 becomes the upper part. When Kumo is moving up, it becomes the lower part.
If you want to master Ichimoku Kinko Hyo at a glance, you must be able to identify which line is which as soon as you see a chart.
Ichimoku Japan: 1.2 How to identify 5 lines
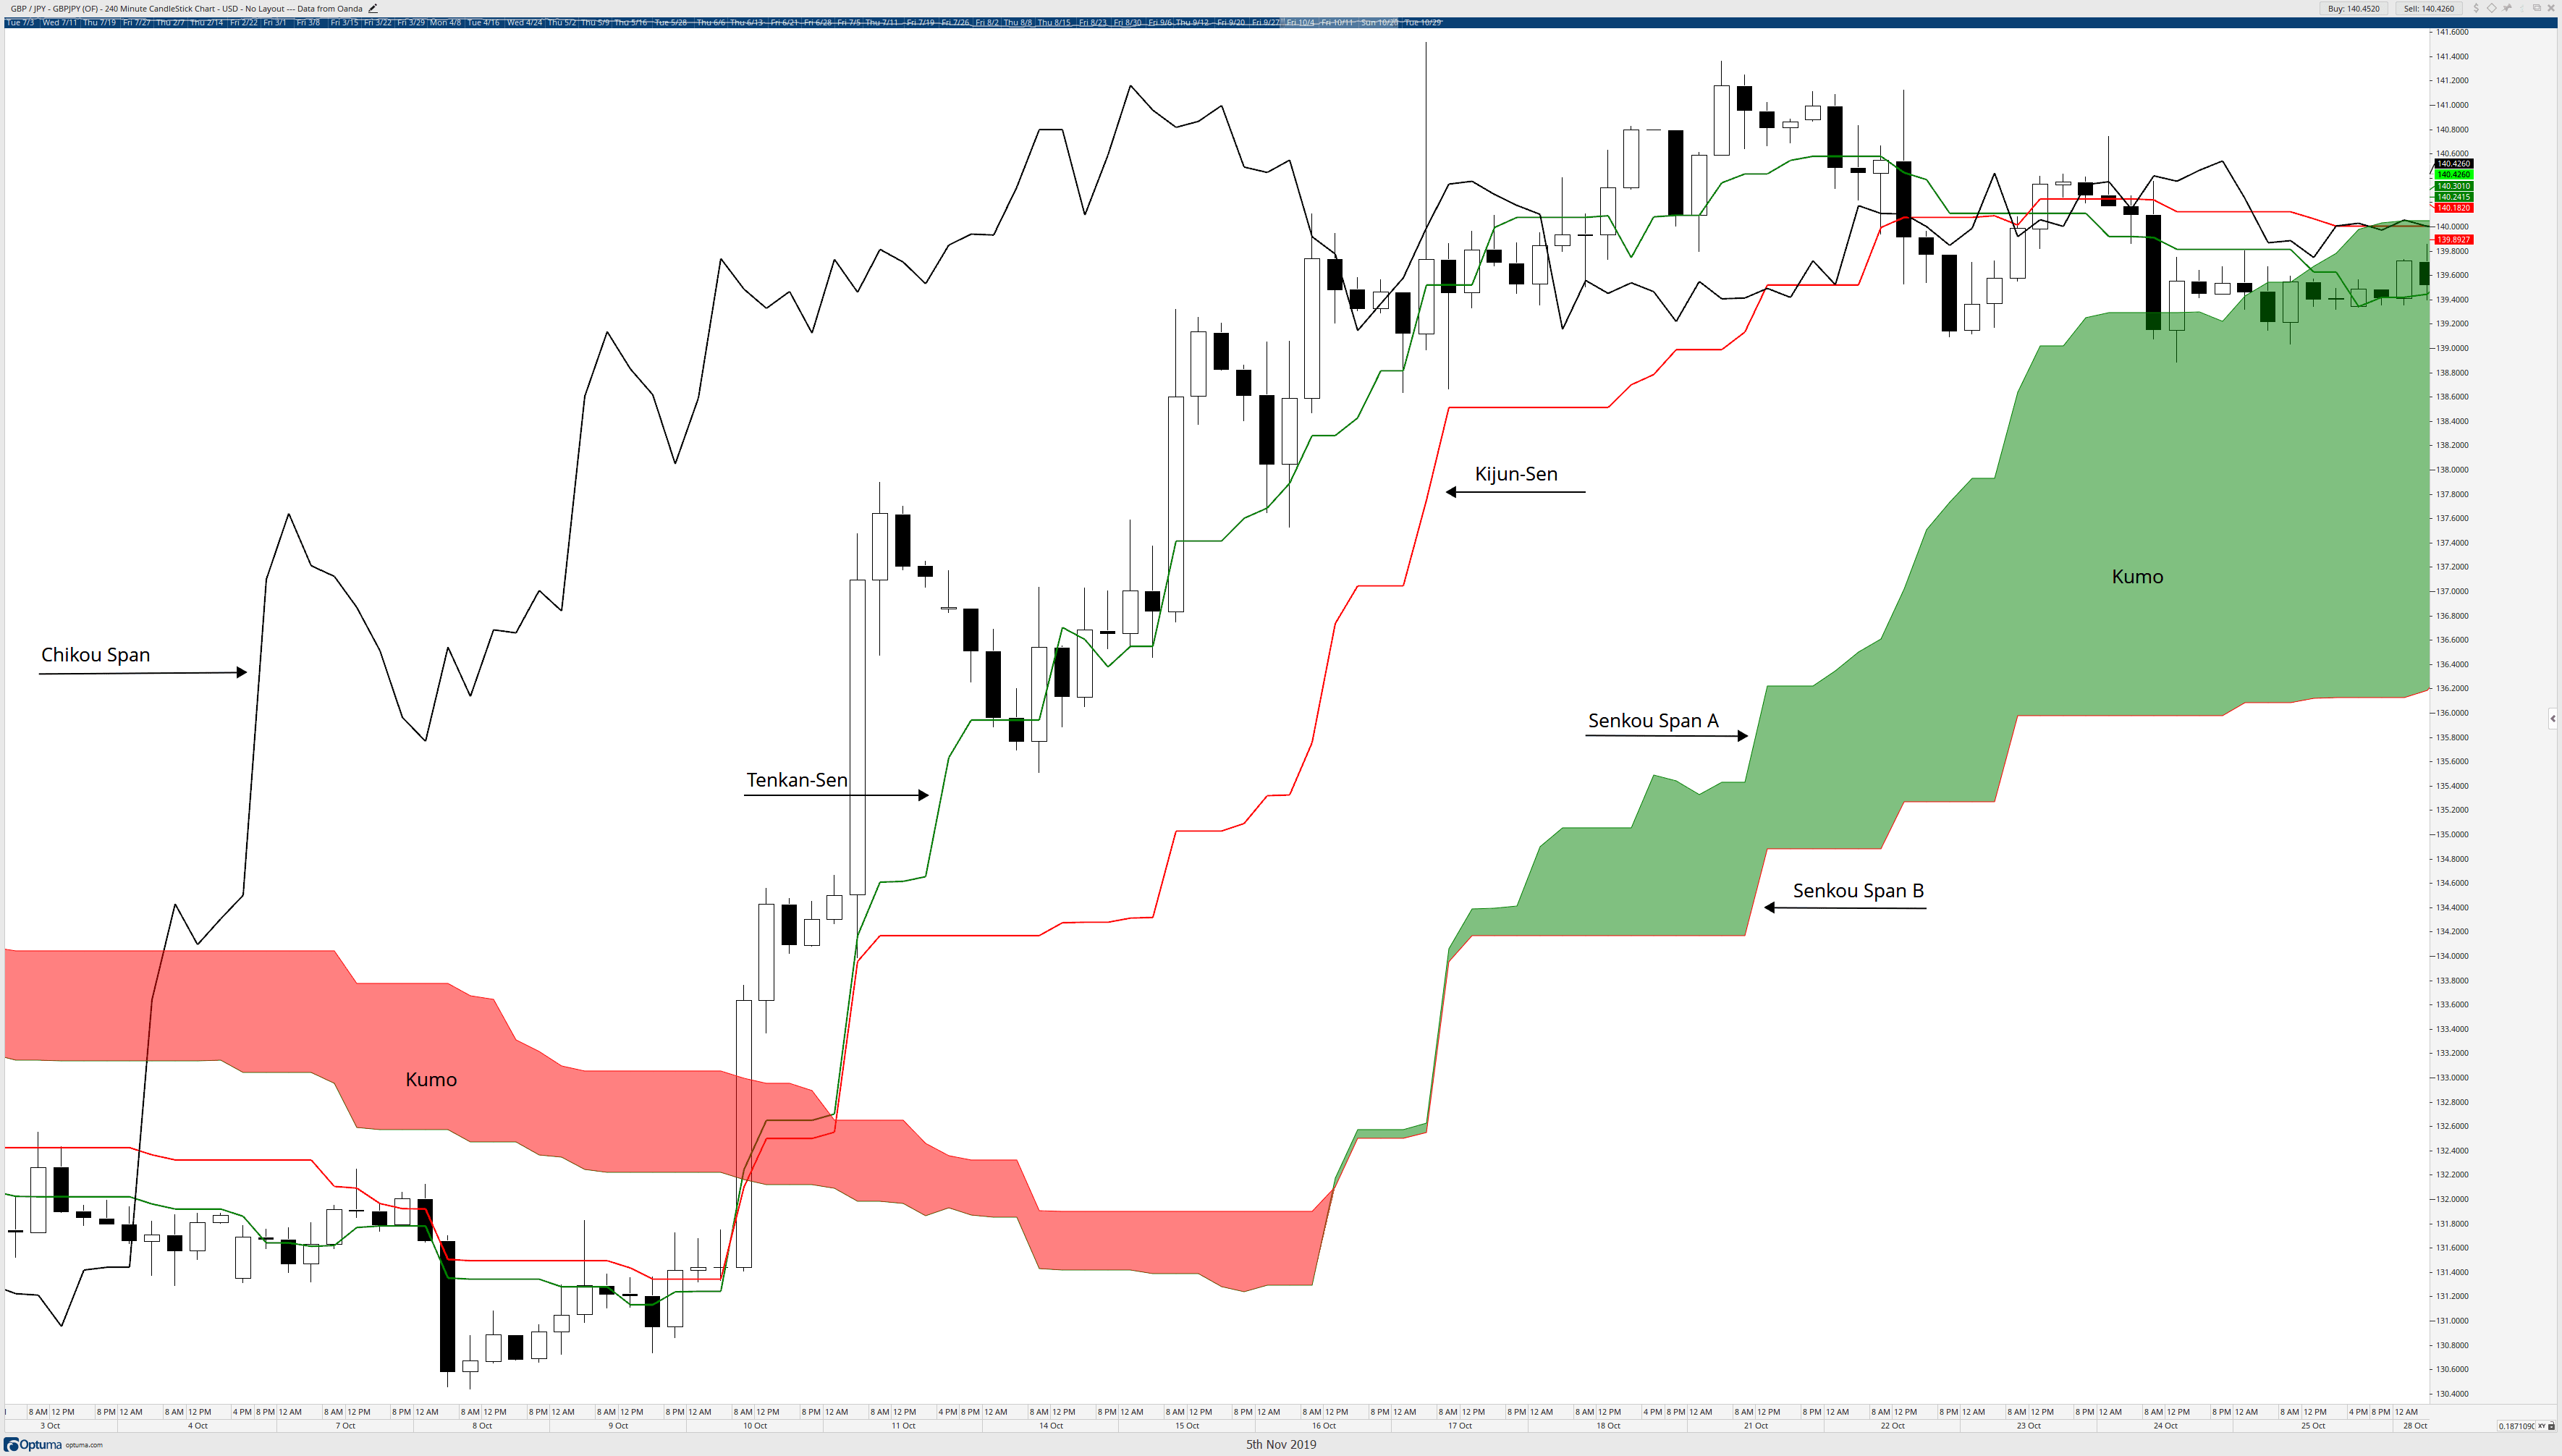
The above figure is a chart with Ichimoku Kinko Hyo. Ichimoku consists of five lines. The five lines are “Tenkan sen”, “Kijun sen”, “Chiko span”, “Senko Span 1”, and “Senko Span 2”. Then, the space between the Senko span 1 and 2 is colored, and the area is called a “resistance zone” or so-called Kumo (Cloud).
Among these 5 lines, first get used to the names of each lines so that you can quickly identify which line is the Kijun sen and which line is the Senko span 1 etc.
Now, let me tell you how to distinguish these lines.
First of all, you can easily identify the Chiko span, which is the only one that’s lagged or delayed. On the above diagram, the purple line is the Chiko span.
Next, look for the Senko spans 1(A) and 2(B). They create a zone called “Kumo” and it’s forwarded to the future, so you can easily identify that this is the Kumo, Senko spans. Now the question is, which one is the Senko span 1 and which one is the Senko span 2?
It might be a little tricky because sometimes the Senko span 1 comes on top of the Kumo, and sometimes the Senko Span 2 comes on top of the Kumo. Here is a simple way to identify them. Senko span 2 gets flatter than Senko span 1. Senko span 1 moves up and down more often as compared to Senko span 2. Also, when Kumo is moving up, the Senko span 1 is the upper part of Kumo and Senko span 2 is the lower part of Kumo. In contrast, when Kumo is moving down, Senko span 2 locates the upper part of Kumo and Senko span 1 becomes the lower part of Kumo.
Finally, let’s try to identify the Tenkan sen and Kijun sen. Simply, Tenkan sen is a line that is often close to candles. And the line that is usually far from the candles is the Kijun sen. Also, when the market is in a range, Kijun sen becomes flatter than Tenkan sen. (There are cases when Kijun sen comes closer to candles, like when price goes up and down rapidly. But in general, Tenkan sen gets closer to the candles than Kijun sen because it takes shorter period.)

Ichimoku Japan. 1.1: History
**Introduction**
Ichimoku Kinko Hyo is a technical analysis devised in the early Showa era (1930s) by Ichimoku Sanjin (Goichi Hosoda). He was a director of the commercial affairs department of the Miyako Newspaper, currently Tokyo Newspaper who was a talented stock analyst as well as a newspaper reporter. Back then the Miyako Newspaper was very much focused on market analysis than the current Nikkei Newspaper and his column was the most trusted by investors. However, he was not just a market analyst. Started his own analysis and trade since the age of 12, he was a real trader and has been pursuing market analysis for his entire life.
Ichimoku Sanjin set up a private research institute and devoted himself to study and research at the heart of the market. Later his first column was published from Miyako Newspaper in 1935 with the name of “Shinto Tenkan Sen”, but the drawings and calculations were kept secret.
Soon, traders started to ask him to reveal the art of Ichimoku Kinko Hyo and the techniques for correct analysis. In 1950, he taught his technique only to three people with 10-year confidentiality agreement. One of them was a president of a major securities company in Japan (The rest of two are unknown).
Nearly 20 years later in 1969, seven volumes of the Ichimoku Kinko Hyo were officially published one after another and the knowledge gradually started to be in public, causing a major Ichimoku boom. After being tested for decades, finally it came to the world.
Out of total seven volumes, only four volumes, Ichimoku Kinko Hyo, Ichimoku Kinko Hyo Complete, Ichimoku Kinko Hyo Weekly, and My best Keifu, are currently purchasable in public. The remaining three volumes are placed at National Diet Library in Tokyo which are also accessible but not purchasable.
Ichimoku Kinko Hyo was originally invented in 1935, and at that time, there are still little decent technical analysis in the world. For example, Stochastics was out in the 1950s, and Granville compiled moving average technique in 1960, and the rest technical tools are mainly 70s and 80s. So, Japan’s advanced in the development of such wonderful technical indicators were quite profound. For example, the candlesticks were developed in the Edo period (mid 1700s). And now, these indicators are used and favored among traders all over the world. Ichimoku Kinko Hyo is a technical analysis that has been validated in a long history and has proven its effectiveness in any market.
However, even in Japan, there are not so many books or websites with correct understanding because of wrong interpretations. For example,
“when price breaks out of the Kumo, it’s a signal for the beginning of a trend and therefore, it’s the best buying signal.” Or,”look for a gold cross or dead cross of Kijun sen and Tenkan sen and take trades.” “When Chiko span breaks out the candles, take trades towards the breakout direction,” and on and on.
You would often see those comments made by individual traders, even in some famous broker’s websites. However, I have to say that it’s the very “immature” way of understanding Ichimoku Kinko Hyo because it’s not always the case.
By looking at all the drawings, at first it may seem difficult to understand. However, I think it’s rare to find a technical indicator as simple as Ichimoku Kinko Hyo. When you see the five lines, Kumo, Kijun sen, and other lines moving and interacting, you might think they are profound. Actually Ichimoku Kinko Hyo is profound and deep, but not difficult to understand. Just think of it as a combination of simple things.
After you read this book, you’ll notice that it’s so easy at first glance.
The direct translation of Ichimoku Kinko Hyo would be “a diagram that shows the equilibrium at a glance.” Equilibrium is a state where the power relationship between the selling and buying powers is equally balanced. The price goes up when the buying power is stronger and goes down if the selling power is stronger but the basic idea is that the market moves towards the imbalanced direction. So if you know where the equilibrium point is, you can immediately determine whether the buying power is stronger or weaker, selling power is stronger or weaker in a current market situation. Many people do not understand the concept of “understanding the equilibrium at a glance”. Can you see where the equilibrium point is from the Ichimoku Kinko Hyo?
Ichimoku Kinko Hyo is just one of the many technical indicators in the world, and yet, one of the rare indicators that draws few lines ahead. In fact, the Senko spans 1 and 2 are drawn ahead from present candle stick. What is this for? A certain calculations are done and the values are drawn and shifted 26 days (candles) ahead. However, even if traders look at Ichimoku Kinko Hyo at a glance every day, only few traders understand and interpret its meaning correctly as to why it’s shifted 26 days ahead. Most traders just focus on whether the price goes through or bounces off the Kumo but never think of the true meaning of the shift.
In the original books Kumo is called the “resistance zone” and Goichi Hosoda never calls it as Kumo. So first of all, there seems to be some deviation to the meaning of “Kumo” among traders and the misalignment is growing in various places, misleading the nature of the Ichimoku Kinko Hyo. So in this Ichimoku Basic Master book, I will thoroughly explain the true meaning, probably the most detailed explanation about Ichimoku Kinko on the earth. And I hope after reading this book traders will get more interest in Ichimoku Kinko Hyo and eventually get to read the original Ichimoku books.


What do you think about Tang ping or lying flat
There's a movement right now called: "Tang ping" or "lying flat". So what do you think about it? Actually Tang ping it is: *when we work we stand up, but when we rest, we lie down.*
Essentially, kickstarted advocates for not overworking, being content with realistic achievements and allowing oneself time to unwind after a day's work.
Ichimoku Japan: Trading Courses
Hello all of you
From today, I will introduce to you the content of the course that I attended about Ichimoku.
This is the course I took from Japan.
I introduce it here, as I was reviewing what I learned in that course.
In that course, there is also a video tutorial, but because of copyright issues, I ask for permission not to share.
This is the course content
Myself
Hello friends I come from Vietnam. I also have a long time research Forex and I am also trading Forex. This is my account.
https://t.co/pSpUsNF99p?amp=1
I join Read.cash as a diary of my trading. I only trade some major pairs like EURUSD, GBPUSD, USDJPY, USDCHF, NZDUSD, EURGBP I often use Ichimoku for analysis as well as in my entry process I would love to interact with you guys to improve my skills. Thank you everyone for following me
With me! The time will answer all.
 @Trading6677028