GBP is a Great Britain currency while USD is a US based currency. Both currencies are used in the respective jurisdiction to conduct daily transactions. On Monday the 20th of September, one GBP started trading at around 1.37600. The price dropped to around 1.36400 the same day but later rose to around 1.36900 on Tuesday the same week. On Wednesday the same week, the price had managed to go as low as 1.36108 but later came to rise to around 1.37500 on Thursday the same week. This upwards and downwards movement is as a result of traders behaviour which can further be explained as from below;
Traders behaviour
Traders affect the way the GBPUSD market moves. When the market is moving upwards , that will be an indication that the sellers are more than the buyers while when it is moving downwards, that will be an indication that the buyers are more than the sellers. Therefore, since the market has indicated a bullish trend as from Wednesday after it experienced its bearish trend on Monday and Tuesday, we can therefore explain its bullish trend as follows;
1. bullish trend
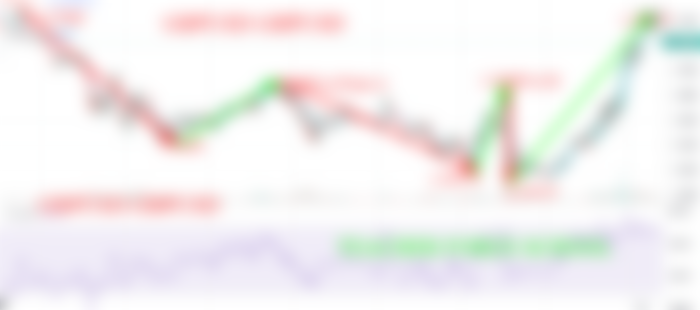
In a bullish trend , the GBPUSD market will be moving in aa upwards direction. On Monday the 20th of September, one GBP started trading at around 1.37600. The price went as low as 1.36400 the same day late rose to around 1.36900 on Tuesday the same week. By end of Wednesday the same week, the price had managed to go as low as 1.36125 but later came to rise to around 1.37120 on Thursday the same week. This is indicated as from the candle sticks chart below;

The above is the GBPUSD market. There is point A and point B. Before point A, the market can be seen to have moved as low as 1.3640 from its previous high of 1.3760. This downwards movement is as a result of the number of buyers being more than sellers thus creating a downwards pressure . At 1.3640, there are more sellers placing their short positions in the hope that the market will continue moving downwards. This again causes the sellers to exceed the buyers thus creating a support point over there thus forcing the market to slightly moves upward to point A at 1.3690. At point A, the buyers exceed the sellers again thus creating a resistance point there. This causes the market to reverse and moves downward at 1.36170. At 1.36170, many traders are closing their buy positions and beginning to open a sell position hoping the market to continue moving downwards. This again causes the market to gain support over there and moves upward to point B at around 1.36890. At point B, a resistance point is being experienced over there due to the buyers exceeding the sellers. This again causes the market to reverse and moves downward at around 1.36125. Over there, the market can be seen to have fallen below 30 RSI thus indicating another oversold condition there. This again causes the market to gain support over there and moves upward all the way to around 1.37152. If the sellers will continue exceeding the buyers, there is possibility of the market to continue moving upwards all to around 1.38000 while if the buyers will exceed the sellers, then the market can resist to continue moving upwards but instead reverse and moves downward . Make sure to apply risk management and strategy well so that the market does not punish you in the direction where you are holding your position in the event of the market reversal.
