RSI is an oscillator indicator while moving average is a trend following indicator. RSI enables traders to know of an overbought or oversold market condition while moving average enables traders to know the direction of the market through support and resistance. Today being on Monday the 9th of March 2020, the EUR/USD has been trending in an upwards direction and managed to go all the way to 1.1480. Many traders don't know whether the market will continue to move upwards or will reverse and starts moving in a downwards direction. Using RSI and moving average, we have managed to prepare this analysis today using these two indicators as follows;
1. Using RSI(relative strength indicator)
RSI which is an oscillator indicator helps traders to know whether the market has gained support or resistance. The market gains support when the RSI falls below 30 and resist upward movement when the RSI rises above 70. Having been moving in an upwards direction, the RSI has managed to rise above 70 at around 1.1480. This signifies the EUR/USD trader of an overbought market condition thus a possibility of a downwards reversal movement. The trader should close their previously bought position and opens a sell position . This is indicated as from the candle sticks chart below;
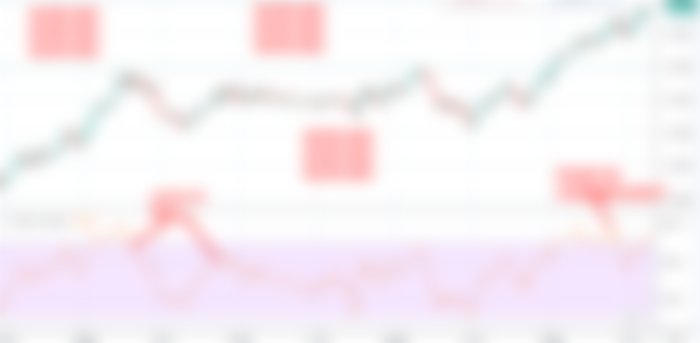

The above is the EUR/USD market. Two points are being indicated. There is point A and point B. Point A is the RSI while point B is the overbought point position. As indicated at point B, the RSI has risen above 70 at. a price of 1.1480. This signals the trader of an oversold condition at that point. This signals the trader to close their previously bought position and opens a sell position since the market is starting a downwards movement. He or she can open a sell position at around 1.1480.
2.Moving average
Moving average which is a trend following indicator helps traders to know whether the market has gained support or resistance thus enabling them
to know the direction if the market. When the price in the market rises above the previous highest high point of the moving average, that will be an indication of a resistance point while when it falls below the previous lowest low point of the moving average, that will be an indication of a support point. The price in the market has been moving in an upwards direction and managed to rise above the previous highest high point of the moving average at around 1.1480. This signals the EUR/USD trader of a resistance point over there thus signaling them to close their previously bought position and opens a sell position since the market will reverse and starts moving in a downwards direction. Their sell position can be opened at 1.1480. This is indicated as from the candlesticks chart below;
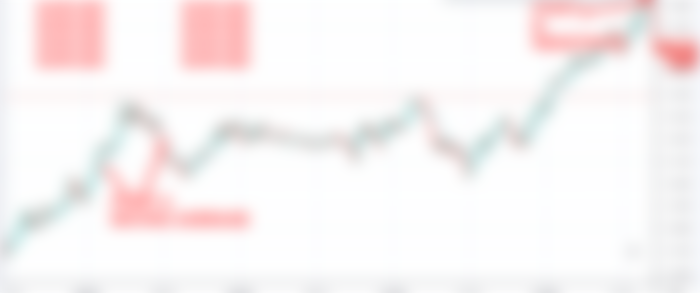

The above is the EUR/USD market. Two points are being indicated. There is point A and point B. Point A is the moving average while point B is the resistance point. At point B, the price in the market has managed to rise above the previous highest high point at around 1.1480. This signals the EUR /USD of a resistance point over there thus they should close their previously bought position and open a sell position since the market will reverse and starts moving in a downwards direction. The trader can open a sell position at around $1.1480. Here is our sell trading idea for EUR/USD pair today;
SELL: 1.1480 T/P: 1.1380. S/L: 1.1530
Recommendation: Make sure to apply risk management while opening your position since this is not an investment advice but only a trading idea