Whoever fights with monsters should see to it that he does not become one himself. And when you stare for a long time into an abyss, the abyss stares back into you.
- Friedrich Nietzsche, Beyond Good and Evil §146
The other day, I wrote up this article about Dogecoin, wherein I tried to instill some caution into Dogecoiners about the recent explosion in its price. This was also an attempt to reconcile how something that started as a light-hearted, meme project could be worth $17 billion.
I was trying to wrap my head around how Doge, a purposely inflationary cryptocurrency that creates 10,000 new coins every minute, could garner the price it does. Its tokenomics stand in stark contrast to Bitcoin’s, the latter of which is deflationary. What’s more, as an investment Dogecoin would have netted a return over 6,000% in the past year and more than 100% over the previous month.
Reflecting upon the article later that day, as I was staring at water circling the drain while I washed my hands, I had this thought, “I should compare Doge creation rates to the US dollar.”
Sigh… I didn’t plan on writing this one, but we live in weird times. Here it goes:
Measures of Money
There are a couple different ways the US money supply is measured. The Federal Reserve uses three main ones called M0, M1 and M2. Generally speaking, they can be thought of as follows:
M0: Physical money in the form of coins and paper plus central bank reserves
M1: Everything in M0 plus checking account balances (known as demand deposits)
M2: Everything in M1 plus savings & money market accounts (known as time deposits)
There’s some regulatory implications to the distinction between demand and time deposit accounts, but that’s neither here nor there for our purposes. Also, a couple other esoteric money supply measures exist, but they aren’t widely used or quoted in the financial press, so we’ll ignore them. This is a neat Venn diagram to help you visualize:


Now that we have our money measures defined, we can start comparing them to Doge. We’re going to go with M2 because it’s the broadest measure and encapsulates most of what the average person would consider money. If we chose M0, it would exclude every American’s checking account and if we only took M1, it would eude savings accounts.* M2 should capture most of what people generally consider money.
M2 Growth in the Age of Doge
There’s a couple historical epochs throughout Doge’s life. To make this comparison more straightforward, we’re going to start in March of 2015. This is because prior to Doge block 600,000, there was a variable block reward and rate of Doge creation. With that block the Dogecoin block reward was set at 10,000 and has stayed at that fixed rate since.
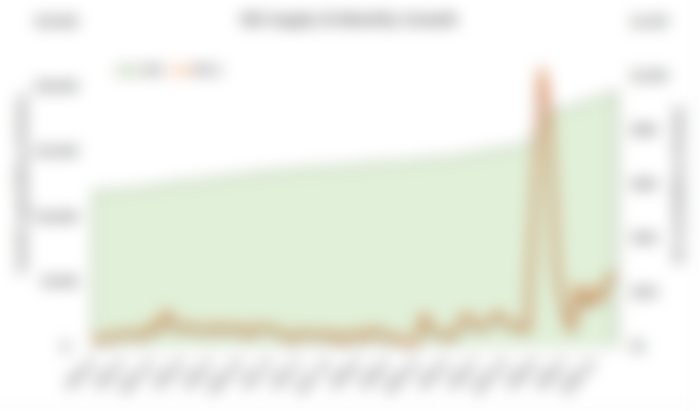

From the chart above, it is clear that M2 grows a little each month. It’s usually less than 1% of the supply outstanding, with some spikes here and there. The size of those spikes in the chart are muted by one big spike in April of 2020 following the stimulus done in reaction to the outbreak of COVID19. To put some numbers on this, the average monthly growth in M2 from March 2015 - December 2019 was $59.6 billion. In percentage terms, this works out to about 0.44% per month.
With the start of 2020 and COVID19, the money machine really started to go brrrrrrrr. The average monthly M2 growth was $310.1 billion. The average rate of money creation over this period was 1.8%. The largest monthly prints were in the four months from March 2020 - June 2020. Lest you think we somehow returned to “normal” with the rate of M2 growth, the average monthly growth in M2 following June 2020 was $186.3 billion, more than three times the amount it was prior to COVID19. This equates to just under 1% per month, which is still twice the pre-COVID19 rate. It’s also noteworthy that the data only goes through February 2021, which means this doesn’t even capture the most recent stimulus implemented in March of this year.
Modern Monetary Theory FTW, amiright? Yikes….
Doge Supply Growth
The growth in the Dogecoin supply is much more straightforward than that of the US dollar. It’s not subject to the whims of twelve people, economic shocks or presidential bullying. Ever since 25 February 2015, 10,000 fresh, cute, bright eyed and bushy-tailed Dogecoins have entered the world with each new block. New blocks are minted about once per minute, so 14.4 million Doge are made each day, and an average of a little less than 440 million are created each month. It all works out to about 5.3 billion per year.

M2 & Doge
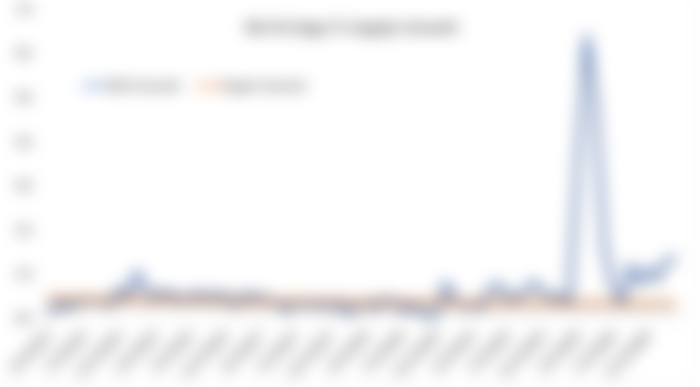
Now that we have all that out of the way, let’s compare Doge & M2 over some of the timeframes mentioned above:


As we can see, even at 10,000 Dogecoins being created every minute, this is far slower than the dollar. Doge was, is and for the foreseeable future will be rarer than the dollar. And it will be increasingly rarer at the rate we’re going. Over the March 2015 to February 2021 period, for every dollar printed, only 0.004 Dogecoins were created. Additionally, the rate of Dogecoin creation is fixed, predictable and easily modeled.
The dollar on the other hand - at least for the period March 2015 through February 2021 - grew at a rate of anywhere from $163K to $23.8 million per minute. Doge supply growth looks absolutely glacial in comparison, at least in absolute terms.
What about relative terms then? I don’t have historical data on circulating Doge supply, but since it’s created at a set rate and Coingecko tells me there’s 129 billion in circulation as of writing, we can work backwards to ballpark the numbers we need. When we do that and look at monthly growth rates between the dollar and Doge, it doesn’t help the dollar’s case:

While the dollar does seem to have some better months, it averaged 0.71% supply growth per month, versus 0.39% for Doge. Additionally, the growth rate of Doge as a percentage of its supply is shrinking over time and will continue to shrink. The dollar, on the other hand, seems to be growing at a faster rate. Even after the 2020 stimulus spikes, the dollar supply has grown at almost 1% per month, or almost three times that of Doge in relative terms.
DOGE > Dollar? So Wow. Much Maybe.
So should Doge be worth more than the dollar? Perhaps. What the dollar has that Doge doesn’t is mass adoption. Anywhere in the world, you can find someone to take your dollar. 80% of global trade is settled in dollars. What’s more, there’s a lot of big institutions and guns that are willing to back it up. Doge on the other hand, for all the mainstream press coverage you’ll see pop up here and there, lacks widespread adoption.
Put simply, what the dollar has working in its favor that Doge doesn’t is network effects. Metcalfe’s Law says that the value of a network is proportional to the square of the number of nodes in that network. Nodes in this case would mean users. The dollar is used by billions of people, whereas Doge has 3.5 million wallet addresses. It also suffers from being highly concentrated in a few wallets.
It’s also worth emphasizing: to arrive at value under Metcalfe’s Law, you have to square the users. Doge has a lot of ground to make up in that regard. (If you want a more in depth look at Metcalfe’s Law and how it applies to Bitcoin, this is a great article by Lyn Alden.)
However, we must ask: which one is sounder money? Well, and this really fucking hurts to say this, it’s Doge. In theory at least, based on the growth of the supply, Doge should be a better store of value than the dollar. Milton Friedman would agree - or should agree - and he won a Nobel Prize in economics.
Could the Fed and the US Government get their act in order and stabilize the money supply? It could happen, but there’s no signs of it in the immediate future. Trillion dollar infrastructure plans are being debated as I write this, and there’s no political will nor incentive to print less money.
For all you ardent Dogecoiners out there, a push for greater adoption should go a long way. Right now, with 129 billion Doge in circulation and 14.4 million being created each day, the daily supply growth rate currently stands at 0.011%. With 3.5 million wallets, we have a rough approximation of users. If you can get about 400 new users per day, your adoption rate will outpace the supply growth. Pair that with Metcalfe’s Law, and the result should bear fruit.
As for me, one meme coin is worth a response in kind:


*There was a Federal Reserve rule change on 24 April, 2020 that allowed some restrictions on time deposit accounts to be lifted which caused most of the M2 supply not in M1 to be reclassified as M1. All this just muddies the waters and means M1 across the timeframe we’re looking at to not be an apples to apples comparison throughout the data, which is another reason why M2 is the better measure to compare