Epidemiological estimates of viral hepatitis


Figure 1: Regional HBV Prevalence
Data Source: CDA, Countires, Schweitzer A, et al. LANCET 2015. Year varies.
Map Production: Information Technology, WHO Regional Office for the Western Pacific.


Table 1: Hepatitis B and C disease burden, by country in the WHO Western Pacific Region
Reliable epidemiological estimates for hepatitis B and C are not available for many countries in the Region. Presented in this table is estimated prevalence of chronic HBV and HCV in the Western Pacific Region.
NOTE: updated as of 23 July 2018
HBsAg - hepatitis B surface antigen
HCV RNA - hepatitis C RNA viral load
* refers to country validated data. The year to which the data apply varies based on date of publication. See citation below for year.
Source:
1. Schweitzer, A., Horn, J., Mikolajczyk, R. T., Krause, G. & Ott, J. J. 2015. Estimations of worldwide prevalence of chronic hepatitis B virus infection: a systematic review of data published between 1965 and 2013. Lancet, 386, 1546-55. 17 Oct 2015. (Unless otherwise noted).
2. The CDA Foundation. Hepatitis C country profiles. Lafayette, CO: CDA Foundation, 2017. Available from http://polarisobservatory.org/. Accessed on 30 October 2017. (Unless otherwise noted).
3. Kirby Institute. HIV, viral hepatitis and sexually transmissible infections in Australia: annual surveillance report 2017. Sydney: Kirby Institute, UNSW Sydney; 2017.
4. MOH Fiji, CDA, WHO. Estimates and Projection of Disease Burden for Hepatitis B Fiji, January 2017.
5. MOH Kiribati, CDA, WHO. Estimates and Projection of Disease Burden for Hepatitis B Kiribati, January 2017.
6. MOH Mongolia, July 2018
7. Department of Health Philippines, CDA, WHO. Estimated and projection of disease burden for hepatitis B and C in Philippines, November 2018.
8. MOH Viet Nam. CDA, WHO. Estimates and Projection of Disease Burden for Hepatitis B and C in Viet Nam, June 2017.


Figure 2: Regional HCV Prevalence
Data Source: CDA, Countires, Schweitzer A, et al. LANCET 2015. Year varies.
Map Production: Information Technology, WHO Regional Office for the Western Pacific
Cirrhosis and liver cancer cause most hepatitis-related deaths
Most (97%) deaths due to viral hepatitis in the WHO Western Pacific Region, are the result of chronic hepatitis B and C related cirrhosis or hepatocellular carcinoma (liver cancer). An estimated 3% of deaths in the region are attributed to acute hepatitis B and E related-complications.
In 2016, most deaths from chronic hepatitis occurred in China, followed by Japan and Viet Nam.
The WHO Western Pacific Region (WPRO) has a high burden of hepatitis B and C with high incidence rates of liver cancer in many countries.
Source: Global Health Estimates 2016: Deaths by Cause, Age, Sex, by Country and by Region, 2000-2016. Geneva, World Health Organization; 2018.
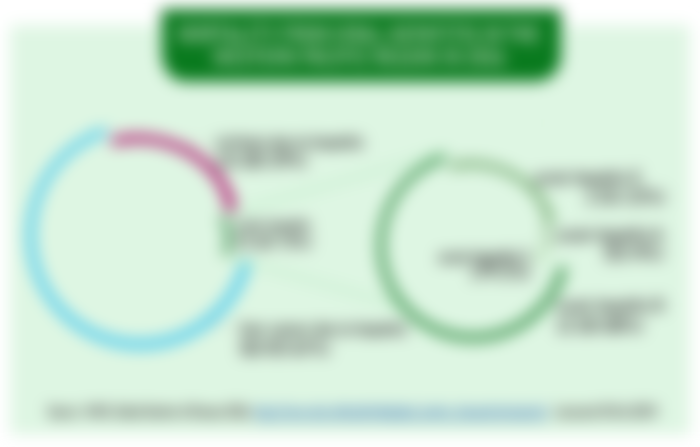

Figure 3: Mortality from Viral Hepatitis
Source: WHO. Global Burden of Disease 2016. https://www.who.int/healthinfo/global_burden_disease/estimates/en/.
(accessed 30 Oct 2019)
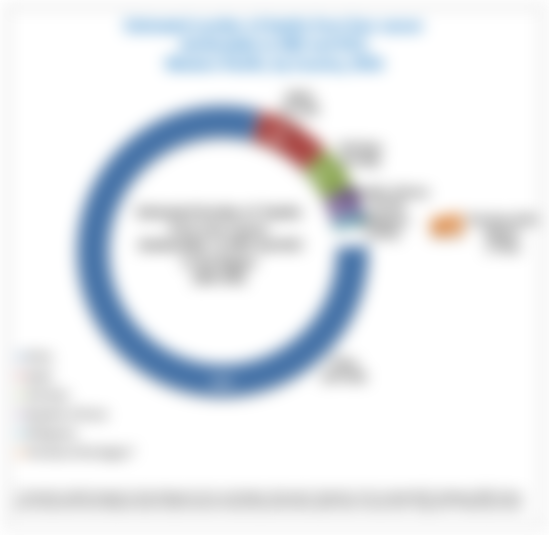

Figure 4: Estimated number of deaths from liver cancer attribute to HBV and HCV
Source: WHO. Global Burden of Disease 2016. https://www.who.int/healthinfo/global_burden_disease/estimates/en/.
(accessed 30 Oct 2019)


Table 2: Top 10 country ranking: age-standardized incidence rate of liver cancer
Source: Bray F, Ferlay J, Soerjomataram I, Siegel RL, Torre LA, Jermal A, Global Cancer Statistics 2018: GLOBOCAN Estimates of Incidence and Mortality Worldwide for 36 Cancers in 185 Countries, CA Cancer J Chin 2018;68(6):294-424.
Available from: http://gco.iarc.fr/today/online-analysis-table
(accessed 30 October 2018)