A recap:
In Aug 2019 I posted an article where I revealed that the priceline of Cardano was forming a shark pattern.
RSI had still some space to move in oversold zone and moving average convergence divergence ( MACD ) was still strong bearish , therefore there was more possibility that the price action will definitely complete the final leg of Shark which was being formed at that time below was the article:
Finally in December 2019 the Cardano took the bullish divergence and after producing more than 46% bullish rally the priceline of ADA retraced back again. It was expected that if the price action will cross up the 0.786 Fibonacci projection of C to D leg of this bullish Shark then it will be turned more bullish.
But unfortunately the price action went closer to 0.618 Fibonacci projection level and from this level the seller took over the charge and brought the priceline down again.
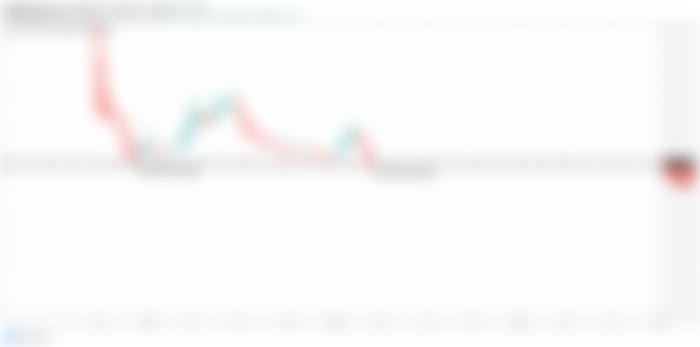
Hitting at last support:
In previous week we have witnessed a strong bearish rally that brought the price action down upto the last support at $0.027002. And the price action has hit a spike up to $0.018540. That is the new lowest price ever in the history of Cardano with US dollar pair as per Kraken exchange.

Harmonic move a sign of hope:
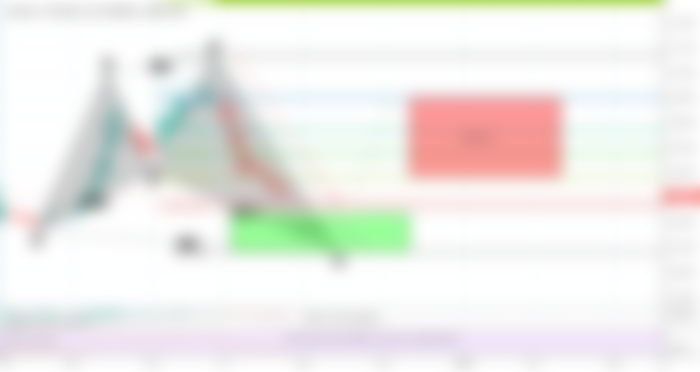
Now there is a strong hope appeared that on this last support the price action of ADA has completed formation of bullish pattern. It can be easily seen that a a bullish Crab has been formed. The initial leg of this pattern was started with the candle stick that was opened on 17 December 2019 and has been completed on 12 Feb 2020. After that the price action has been retraced back between 0.382 to 0.618 Fibonacci level. And then the price line projected between 0.382 to 0.886 Fibonacci projection of A to B leg.
Now from here the price action was suppose to be retraced between 1.27 to 1.618 Fibonacci level and this recent sell off has helped the priceline to move more down to complete the final leg. So far we can see the price line of ADA has only hit the spike in potential reversal zone area but soon we can expect that the price action will again move down to enter in this zone.
The range of potential reversal zone and Fibonacci projection area or buying and sell targets can be as follow:
Buy between: $0.019129 to $0.004567
Sell between: $0.030263 to $0.057737
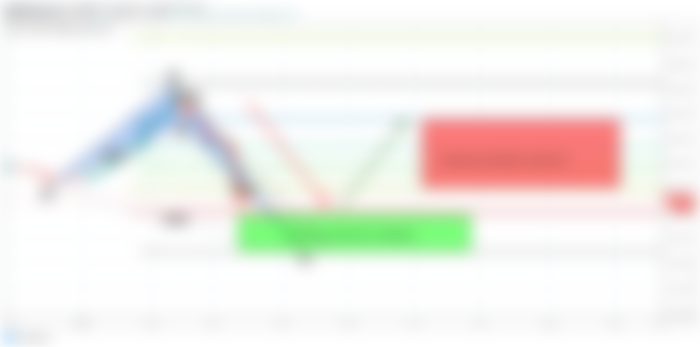
As you can see this potential reversal zone of 318% area therefore if for example the priceline hits the lowest pricelevel of this PRZ level and hits the highest Fibonacci projection or sell zone then it can be a 1164% really very massive move. This can be the same volatility as the NPXS normally shows. However In my opinion it is not possible that ADA would move as that much down therefore we should find the buying at the starting of potential reversal zone. This is the 1st positive sign I have found sofar if there will be more developments then I will definitely share with you.
Note: This idea is education purpose only and not intended to be investment advise, please seek a duly licensed professional and do you own research before any investment.