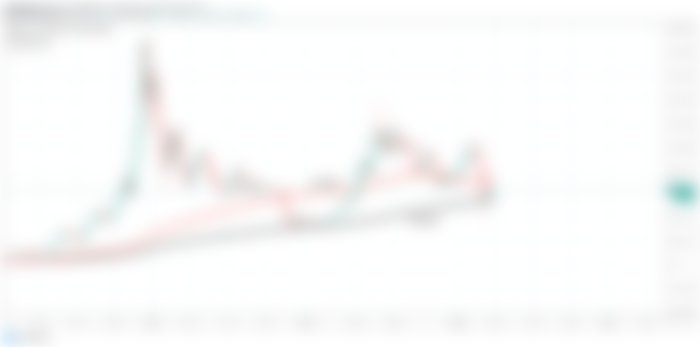
Since starting of March 2020 we are watching that the Bitcoin is holding very strong support of 200 simple moving average on weekly chart. Even though the candlesticks has hit the price beyond this support level but now the priceline is moving above this support. At this time we can see that we have third green candlestick signaling that the price action is turning bullish. We also have the 100 simple moving average resistance above the priceline. And at this time the Bitcoin is in a kind of sandwich situation. We have also witnessed such situation back in November 2018 to April 2019 when the priceline broke down the 100 simple moving average support and touched the 200 simple moving average support and the Bitcoin was moving between these two SMAs and eventually price action turned very strong bullish and moved up by more than 300%.

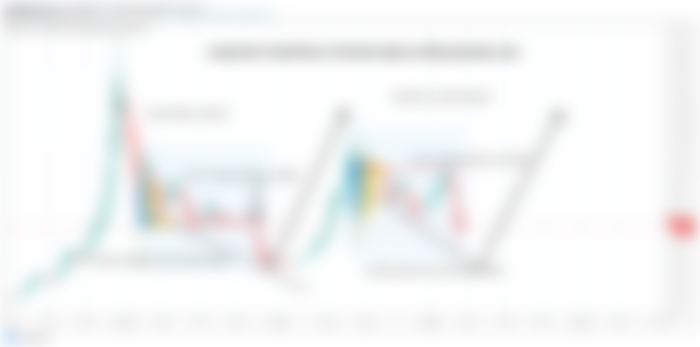
What happened when the priceline broke down 100SMA previously?
If we dig the situation more deeper back in November 2018 then it can be observed that when the price of Bitcoin broke down the 100 simple moving average support it also formed a downtrend line and the volume profile of the complete price action moving above that trend Line was showing that the trader’s interest was very low below 6000 dollars and the point of control of the volume profile was at $6500 therefore in the area that interest. Therefore when the priceline moved in the area where we had weak interest of the traders the priceline moved up. Same as like that down trendline another down trendline has been formed by the Bitcoin price action and the volume profile of the recent downtrend line is showing that interest of the traders is very weak below 7000 dollars and the volume profile is at $10,300 therefore there are strong chances that the priceline will take another bullish divergence from this level.

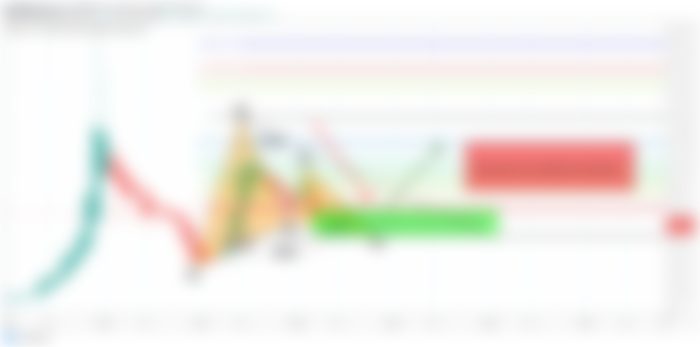
The big bullish Gartley will be executed soon:
Here I would like to again divert your attention to the very big bullish Gartley pattern that has been formed on monthly chart by the price line of Bitcoin. And we can see even the priceline has hit beyond the PRZ level or buying zone but now it is moving in the potential reversal zone. And very soon the next month candlestick will be started in this potential reversal zone. We need some price consolidation at this level and after that priceline will take another powerful bullish divergence to hit the Fibonacci projection of A to D leg. And as we have discussed earlier that potential reversal zone or buying zone of this pattern starts from $7231 and ends at $5424 and Fibonacci projection or sell zone starts from $8654 and ends at $12070. But if the price line will cross up 0.786 projection level then it can start more powerful bullish rally than the previous one.

Conclusion:
Bitcoin is likely to embrace strong support of 200 simple moving average on weekly chart and there are strong chances that it will be bounced up from here like it was bounced back in 2019.
The volume profile is also giving the bullish signal and the formation of bullish Gartley pattern is also giving bullish signals.
but this time the situation is also critical as well. If the people will panic and start dumping the Bitcoin and cryptocurrency then we can lose this support and in that situation the priceline may go for the formation of bullish butterfly pattern. Therefore we should use the potential personal zone of Gartley and 200 simple moving average of weekly chart as our stop loss.