Hi friends, hope you are well, and welcome to the new update on Verasity (VRA).
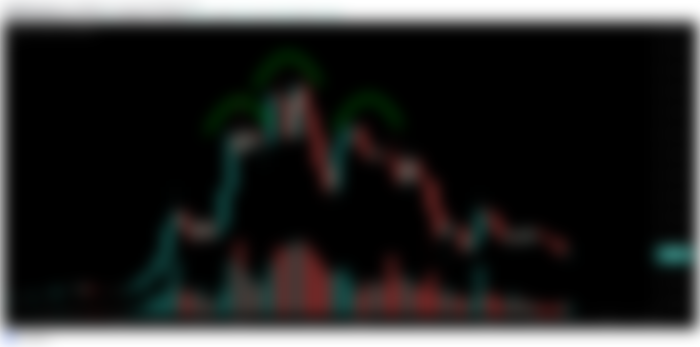
Head and Shoulder formation:
First, the price action was extremely bullish, it formed a higher high, then another higher high, and then a lower high which led to head and shoulder formation. Then the price action broke down the neckline and moved down.

Different support and resistance levels and volume:
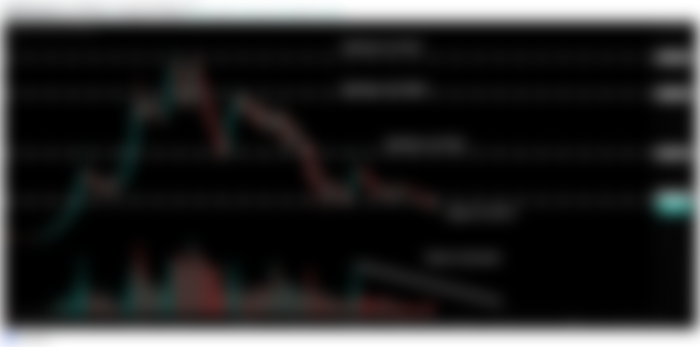
We have a final resistance at approximately $0.053 and second resistance at approximately $0.042 cents.
Then we have the next resistance for the price action that was previously working as a support which is approximately at $0.026. And now the price action at this time is moving at the support at $0.012. We can observe that the volume is getting decreased. There is a possibility that from this point, as shown in the chart, we have a buying volume and the price action can be moved up from this support.

Falling wedge:
At the daily timeframe chart, we have the resistance of the falling wedge. The price action is moving very well between the resistance and the support of this falling wedge. There is also a price level support at $0.012 as well therefore there’s a possibility that the price action will be moved up without hitting the support of wedge pattern.

EMA and Stochastic on long-term chart:
If we take a look at the long-term 2-week timeframe chart, then it can be noticed that the price action is at the support of the EMA 21. This time the stochastic is going to enter the oversold zone. Once it will be oversold then there will be a possibility that the price action will move sideways for some time, and then it will start moving to the upside because the stochastic is going to be oversold soon.
When the blue line of the stochastic will cross the redline to the upside, then it will be a buying signal then we can enter in the trade.

Big bullish BAT formation:
On the weekly time frame chart, the price action has formed a big bullish BAT pattern. There is also a 50 simple moving average support in the buying zone.

Buy and sell targets:
Buy between: $0.0123 to $0.0067
Sell between: $0.0255 to $0.0454
Stop loss:
The maximum extent of potential reversal zone $0.0067 can be used as stop loss.
Possible profit and loss ratio:
As per the above targets, this trade has a huge profit possibility of 577%, and the big loss possibility is 46%. However, in order to minimize the risk, we can use the 50 SMA weekly as a stop loss.
Conclusion:
In the short term, it is possible that the price action may move more down to 50 simple moving average weekly, but in the long-term, it has formed two powerful bullish reversal setups. One is the falling wedge and other one is a big bullish BAT. Therefore in the long-term VRA will be very strong bullish.
Note: Above idea is for educational purposes only. It is advised to diversify and strictly follow the stop loss, and don't get stuck with the trade.
In order to play and watch the current performance of the chart you need at least a free account on tradingview:
https://www.tradingview.com/gopro/?share_your_love=moon333
KuCoin is one of the best exchange to find crypto gems:
https://www.kucoin.com/ucenter/signup?rcode=rJSDVT3
Link for Binance exchange, to trade crypto:
https://www.binance.com/?ref=11256882
Note: Above idea is for educational purpose only. It is advised to diversify and strictly follow the stop loss, and don't get stuck with trade.


