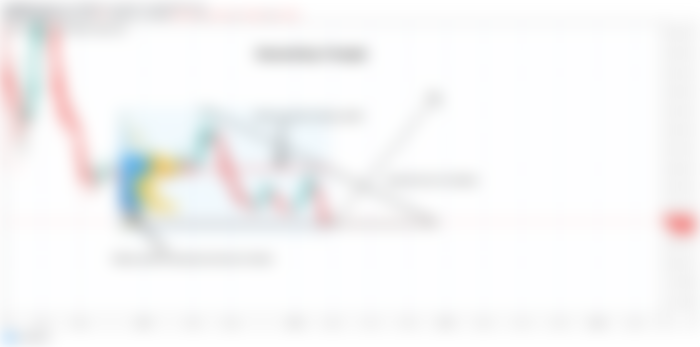
A big descending triangle move:
Since November 2018 the price line of phone is moving within a descending triangle. On weekly chart after the recent strong bearish trend the price line of TRX is again reached at the support of this triangle. And now we have third candlestick that is hitting at the support. The first candlestick that has touched the support of this triangle was very long strong bearish and it has even crossed beyond the support of the triangle but in very next candlestick the price action is retraced back and now Tron is above this support again.
I have also placed the volume profile on the complete price action moving within this triangle. And we can see that the trader’s interest is very low near the support level and even the point of control of this volume profile is $0.0246. Therefore we can expect the move up to the point of control soon.

Priceline did not breakdown the short term daily chart support:
In my previous post that I posted on 8th march 2020 I was expecting that the price action will hit at the support of $0.0127. This is short term daily chart support for Tron. And now we can see that the price action is hitting at this support and so far we don't have even a single candlestick that has been closed below the support level therefore this short term support is still valid.
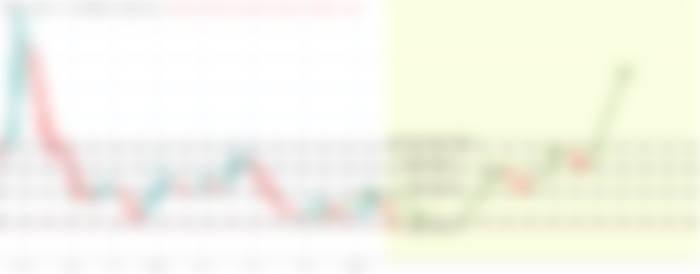
Before hitting the support:
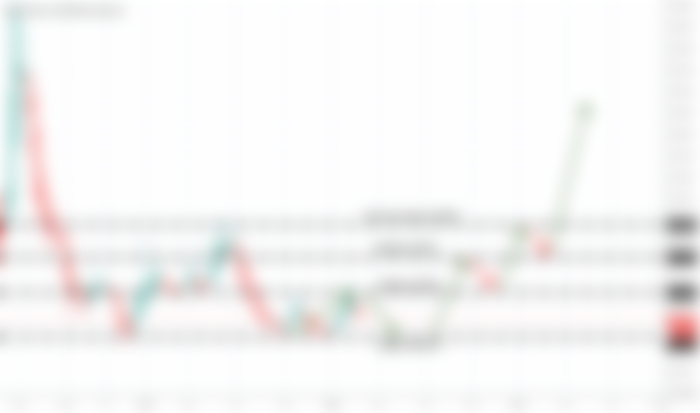

After hitting the support:

A bullish Shark is still in play:
In September 2019 I posted an article where I have revealed that the price action of Tron had formed a complete bullish Shark pattern. The formation of this pattern was started on November 2018 and completed on September 2019. Its mean when I posted this article then the price action just had completed this pattern. And in the month of February 2020 the priceline turned bullish and produced more than 114% profit and in very next candlestick the price line dropped down in the PRZ level again.
Before execution:
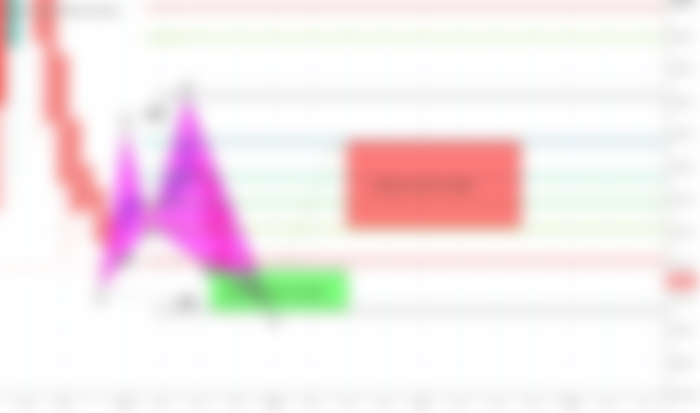
After hitting the sell target the pricline dropped in PRZ level again:

In case of bullish rally what should be the sell targets:
Now we have to two chart patterns one is the big descending triangle on weekly chart and other one is a very big bullish Shark pattern that is still in play therefore we can set our cell targets according to both patterns. Therefore now we have two types of cell targets.
1. Sell targets according to descending triangle: If we place the Fibonacci retracement tool from the tail of the triangle upto the support of the triangle then we receive the Fibonacci projection area between 0.382 to 0.786 Fib level at $0.0216 to $0.0343. Therefore we can set this bracket as sell targets.

2. Sell targets according o bullish Shark: If we place the Fibonacci retracement tool from C to D leg then we receive the Fibonacci projection area between $0.020628 to $0.033906 this is very close to the targets as mentioned above.


Conclusion:
The Tron likely to failed breaking down the support therefore we can accept a break out or bullish rally from this level. But the support level of triangle where the TRX is moving at the moment is very critical and this support is a market structure for the Tron. If it will be broken down then the situation can be more disastrous therefore we should use the support of descending triangle as our stop loss.