Hi friends hope you are well . welcome to the new update on Ethereum. Today I will show you guys the strongest signal being appeared second time in the history of Ethereum las time this signal produced more than 12000% profit but before moving to that signal I would like to present some midterm and short term analysis.
In previous post we have seen that the price action of Ethereum crossed up the $149.00 resistance and after a small correction rally the priceline moved up and broke out next resistance level t $224.

Simple Moving Averages And Golden Crosses And Oscillators:
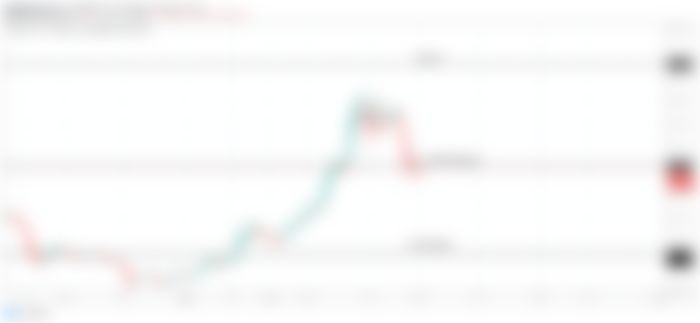
After crossing up $224 resistance level we have seen that the moving average convergence divergence (MACD) has turned weak bearish from strong bearish. Before this in previous days after crossing up the resistance the MACD has turned two times weak bearish but every time after a small bullish move the price action moved down. But this time we have better situation because this time the stochastic is in the oversold zone in relevant strength index (RSI) is also very close to the oversold zone therefore we can expect if stochastic will give bull cross from the oversold zone then the price action may take a powerful bullish divergence which can lead the Ethereum to the next resistance level at $310. We have another very positive signal and that is since the price action is retesting the support of $224 the candlesticks are being consolidated at this level and so far this level is not broken down.
Previously we have seen that the simple moving averages with the time period of 25, 50, 100 and 200 are forming golden crosses and only the golden cross between 100 in 200 simple moving averages was remained to be formed. Up till 27th Feb the price action was having a support of 25 simple moving average now the price action has broken down 25 simple moving average support and moving ahead towards 50 simple moving average if the price action will take the bullish divergence from this 50 moving average support and 200 and 100 simple moving averages will form a golden cross then we can see more powerful bullish move then the previous one. At this time the 100 in 200 simple moving averages are moving sideways and so far they are very close to each other and can form a golden cross at any time. But in case the price action breaks down the 50 SMA support then we may see the death cross between 50 and 200 simple moving averages that can lead the Ethereum to hit the previous support level at $149.


Bullish Butterfly Pattern:
Now I have received my favorite bullish signal and that is the formation of harmonic pattern and this time Ethereum has formed a bullish butterfly on 12 hour chart.
Let's dig this pattern deeper to see how perfect this pattern is formed.
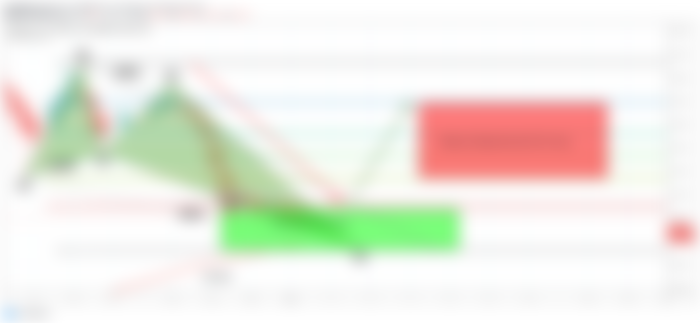

The initial leg was started from 16 Feb Up to 19 Feb then after this bullish move the price action started a correction rally and retraced between 0.618 to 0.786 Fibonacci levels then after having correction it moved up and projected between 0.382 to 0.886 Fibonacci projection of A to B leg after this projection move the price action started the formation of final leg that is C to D and this leg is retraced between 1.27 up to 1.618 Fibonacci levels as required for a perfect bullish butterfly pattern. Now from this potential reversal zone the price action is supposed to take the bullish divergence at least up to 0.382 to 0.786 Fibonacci projection of A to D leg. We have another very strong signal and that is the 100 simple moving average has entered in the potential reversal zone just beneath the priceline to provide a strong support.
When the price action will enter in the Fibonacci projection of A to D leg then 0.789 Fibonacci level will be a very strong resistance for the priceline once the Ethereum will cross up this resistance level of 0.786 Fibonacci then the price action of Ethereum can easily hit the next resistance level of $310.
The Most Powerful Bullish Signal By Ichimoku Cloud With Support Of Directional Movement:
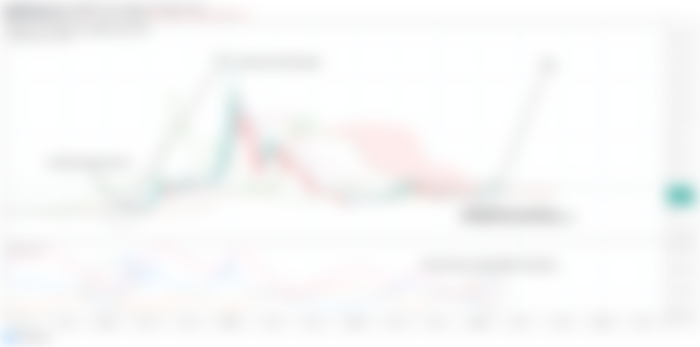
Now let's move to the weekly chart to see the most powerful bullish signal that is being appeared second time in the history of Ethereum and that is ichimoku cloud this indicator is very much important in chartings because Japanese took almost 30 years to develop or create this indicator.
We can see first on 20 Feb 2017 when the price of Ethereum was $12.23 the priceline crossed up the bullish cloud and turn very very strong bullish and from Feb 2017 to January 2018 the priceline achieved the highest price in the history of Ethereum and that was $1594 this was more than 12000 percentage massive profit.
Now this time the price action is again crossing up the ichimoku bullish cloud on week chart at this time almost half of candle sticks crossed up the cloud but sofar the price action is not closed above this cloud.
The conversion line has formed bull cross with base line just beneath the candlesticks and this is good bullish signal.
Lagging span has crossed up the candle sticks but did not cross up the cloud.
Once the candle sticks and lagging span will breakout the cloud and the cloud will be turned bullish again then we can see massive bullish rally by the priceline of Ethereum.
Here another important point is that in directional movement the +DI has formed bull cross with –DI and ADX is moving up like it happened in Feb 2017.
This bullish indication is also in favor of ichimoku bullish move and we can expect that soon the cloud will be turned completely bullish like back in Feb 2017.
And if the cloud will be turned completely bullish then maybe it won’t give more than 12000% like it has given in Feb 2017 but atleast it can hit the highest price ever at $1500 because this level is on at 578% away.

Great work. Thank you for the analysis