On 19 Aug 2019 I shared a post where I have explained that priceline of Decred Decred (DCR) / Bitcoin is moving within a very big pennant since June 2017.
Within the pennant the price action formed head & shoulder pattern and pushed the price action down to the support.
In Aug 2019 after hitting the support of the pennant and bollinger bands the MACD was turning turned weak bearish from strong bearish and RSI was in oversold.
The previous post:
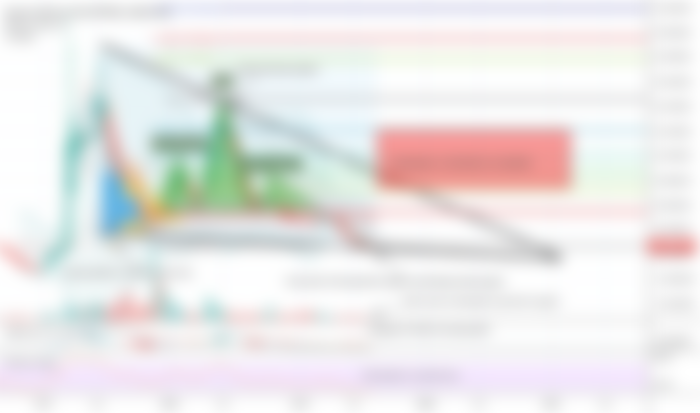

Now we can see that the Bollinger bands is squeezed indicating that there is breakout or breakdown can be possible at any time and moving average convergence divergence (MACD) is weak bullish. And the pricline is still at the support.
The current situation:

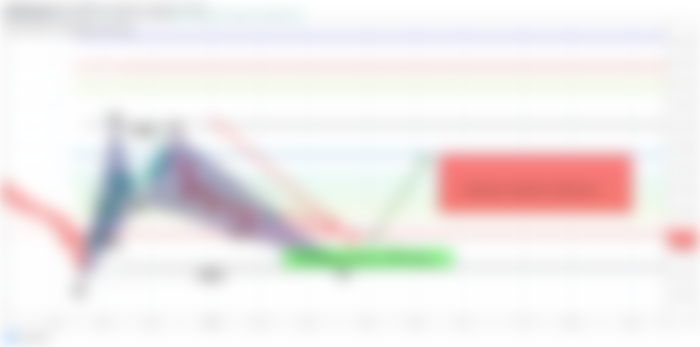
A bullish harmonic move:
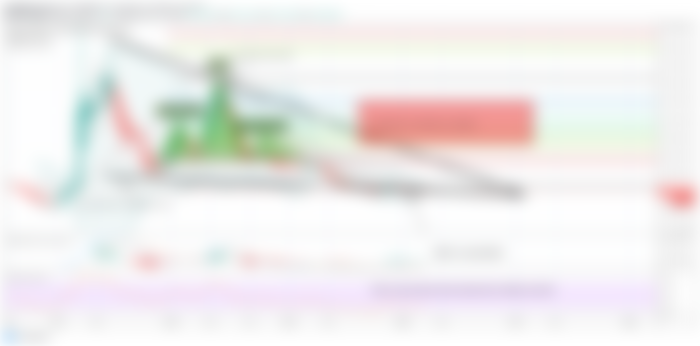
Now on this 2 week chart the priceline has formed a complete bullish BAT pattern the formation of this pattern was started with the candlstick that was opened and closed on 21st October 2019 and completed with the candlestick that was opened and closed on 11th November 2019. Then price action retraced between 0.382 to 0.50 Fibonacci and after getting retraced the price action projected between 0.382 to 0.886 Fibonacci projection of A to B leg after this Fibonacci projection from 16 December up till now the price action faced a strong bearish long-term trend and this strong bearish trend helped the price action to complete the last leg of this is BAT and the priceline of the DCR now has entered in the potential reversal zone of this bullish BAT pattern.

Buying and sell targets:
Now here I have defined two types of buying and sell targets.
1. Mid term
2. Long term
Midterm targets:
Midterm targets are as per bullish BAT pattern that has been formed at the support of big pennant. These targets are as per Fibonacci projection of A to D leg from 0.382 to 0.786 Fib level as below:
Buy between: 0.001823 to 0.001672 sats
Sell between: 0.002183 to 0.002728 sats
So as per these targets the Decred can produce upto 63% profit but if the price action manages to cross up 0.786 Fib projection then it can lead to hit the long term sell targets.
Long term targets:
Long term targets are as per big pennant on this 2 week chart and I have defined the sell targets using Fibonacci sequence from last highest upto the support of the pennant rather than from the tail up to the support for secure targets but the price action can even go higher than the targets I have defined.
Sell between: 0.00725349 to 0.01208048
As per these long term targets DCR can produce upto 510% huge profit.
Stop loss:
Here we can set the stop loss either the support of this pennant or the potential reversal zone of this bullish BAT pattern.