Emergence of Stellar:
As we have seen that the Stellar was started with the opening price of $0.0022 on Jan 2017 as per Kraken exchange and reached at $0.067 in a very short time period of 4 months on May 2017 that was more than 2800% massive bullish move that brought the Stellar in lime light and in a very short period of time the token came among the top cryptocurrenices list on coinmarketcap.
The market cap was increased from 17,173,226 to 585,609,334 which was more than 3300% change.
Then after May 2017 to July 2017 the XLM faced strong bearish trend and the it was dropped from $0.067 to $0.0122 and that was a really big loss of more than 80%.
For more than 3 months this bearish trend was continued and on weekly chart every candle stick was closing lower than the previous candle stick.
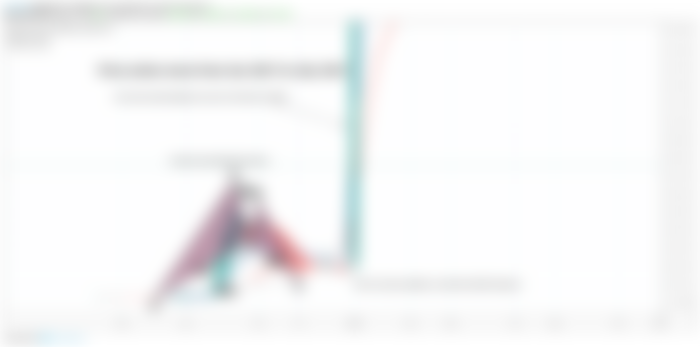
Formation of Harmonic BAT:
But in the meanwhile the nature was playing its role and the supply and demand of traders formed a harmonic pattern that was a bullish BAT harmonic pattern, then from July to Aug 2017 the consolidation period started and the price action moved sideways within the potential reversal zone of this pattern. Then at all of a sudden the exponential moving average 10 that was likely to cross down the EMA 20 to form a death cross, moved aggressively up and in very next week the price action had hit the 51 cents and that is the all time high sofar by Lumens as per Kraken exchange.

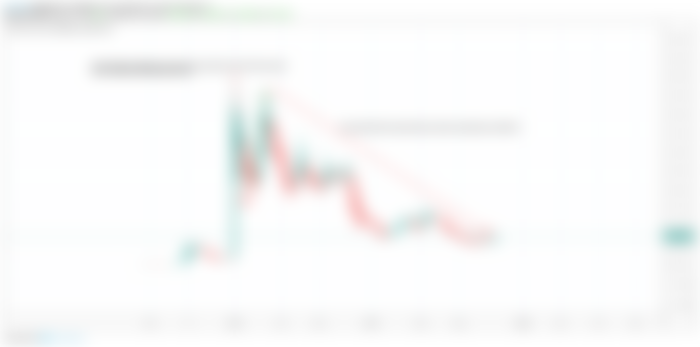
This time the Stellar is taking almost similar move and this move is bigger and broader than the previous action of 2017, and we also have more indicators and moving averages available to measure the priceline moves.
After Feb 2018 we had a strong bear move which leaded more than 69% loss then in the month of April 2018 the bulls took the charge again and brought the XLM price upto $0.462 and recovered more than 59% loss but this move was not for making another high therefore after hitting the $0.462 the bears again took the charge and leaded the price action upto $0.052 in Sep 2019 which was more than 89% loss from the highest ever price of $0.51.

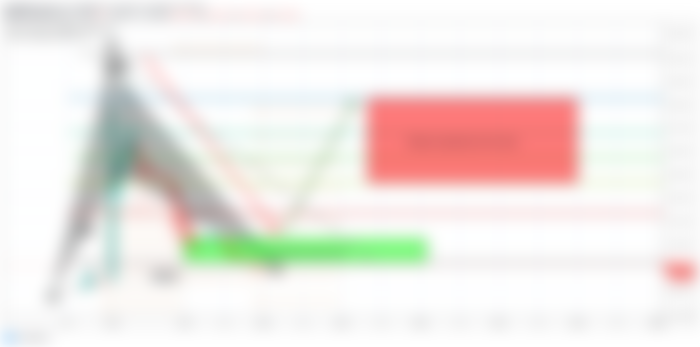
A very big bullish BAT is still in play:
I have been posting many trading ideas on XLM but I am following this pattern since September 2019 where the Lumens has formed a very big bullish BAT pattern on long term monthly chart.
After initial leg the A to B leg is almost retraced upto 0.50 Fibonacci (here I have ignored some extra spike because all legs are formed perfectly as required for BAT pattern) and B to C leg is moved the projection area of A to B leg between 0.382 to 0.886 Fibonacci and now again the last leg is retraced between 0.786 upto 0.886 Fibonacci And this time the Stellar price is again entered in potential reversal zone of BAT like it was in July 2017 and now we can expect another very strong bullish divergence which can lead the price action to achieve higher price ever in the history of XLM.

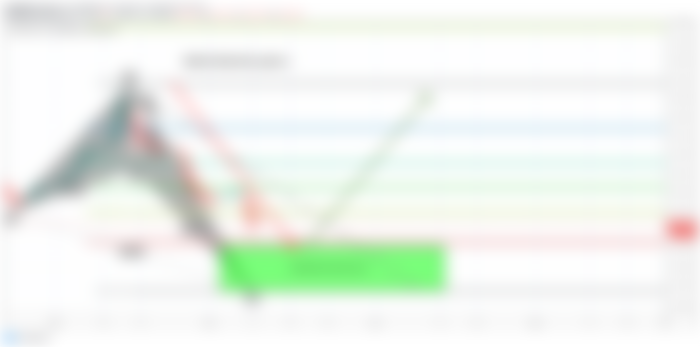
Bullish reversal signal A harmonic pattern:
On daily chart at this time the priceline of Stellar is moving at the bottom of this big BAT’s potential reversal zone and at this level the price action has hit several spikes even beyond this potential reversal zone but so far we don't have even a single candlestick that is closed below this potential reversal zone. Now at the bottom of this PRZ level we have received two more bullish patterns and these patterns can bring the price action up from this level. Here a bullish Butterfly pattern is formed the initial leg was started on 24th of January 2020 and completed on 15th of Feb 2020 then pricelince is retraced between 0.618 to 0.786 Fibonacci level then it has been projected between 0.382 to 0.886 Fibonacci projection of A to B leg. Now the price action should be retraced between 1.27 upto 1.618 Fibonacci level then it will be entered in the potential reversal zone. And from that potential reversal zone we can expect it will again take the bullish divergence and if it will cross up this 0.786 projection of A to D leg then it can turn more bullish towards the target area of bullish BAT pattern which is formed on monthly chart.

Inverse Head & Shoulder a bullish reversal signal:
On long term weekly chart an inverse Head and Shoulder bullish reversal pattern has been appeared sofar the left shoulder and head has been formed and now the right shoulder is being formed. Sofar both shoulders are not lower than the head therefore the pattern is valid. But if the right shoulder will move more lower than head then the pattern can be invalidated. And I am expecting that soon from this level it will take a powerful bullish divergence and soon it will cross the neck of Head & Shoulder pattern.

I will keep posting more updates on XLM when there will be more developments.
Note: This idea is education purpose only and not intended to be investment advise, please seek a duly licensed professional and do you own research before any investment.