Hey friends, hope you are well, and welcome to the new update on Solana (SOL) coin.
SMAs:
On the daily time frame chart, it can be observed that the 200 simple moving average is working as strong support. After the recent drop, the price action of Solana went very close to the 200 simple moving average and got bounced from here. Now it is breaking out the 100 simple moving average resistance. Then we have the 25 and 50 simple moving average resistance levels on the daily timeframe. These levels are can work as strong resistances. Once the price actions will be able to get out of these resistance levels then there can be a powerful move to the upside.


EMAs:
On the daily time frame chart, it can be also observed that the price action is breaking out the exponential moving averages with the time period of 10 and 21. After breaking out the EMA 21 the EMA 10 can cross up the EMA 21 and if it happens then it will be a bull cross, which is a buying signal. Then the price action of SOL coin will have good support of these two EMAs.

Descending triangle:
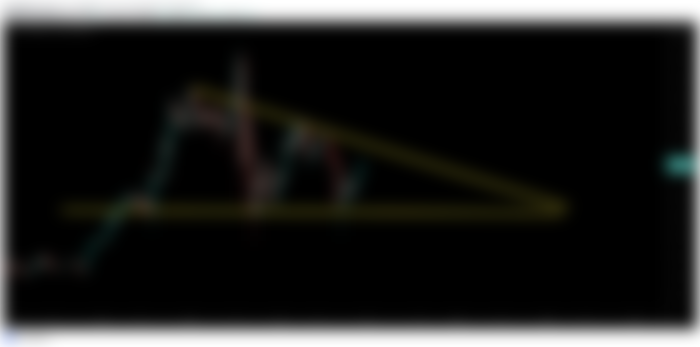
On the daily time frame chart, the price of Solana has also formed a descending triangle and moving between the resistance and the support of this triangle very well. Recently we had a long spike beyond the support of this descending triangle but the price action could not close below this support and bounced from here. Now it is moving towards the upside and can make a powerful attempt to break out the resistance of this pattern.

Oscillators:
If we take a look at the different indicators and oscillators on the daily time frame chart then we can observe that they are turning bullish. For example, in the below chart, I've placed the moving average convergence divergence ( MACD ) and the stochastic oscillators and we can see that the MACD has turned strong bullish and the stochastic is already strong bullish and also has visited the oversold zone as well.


Harmonic BAT pattern:
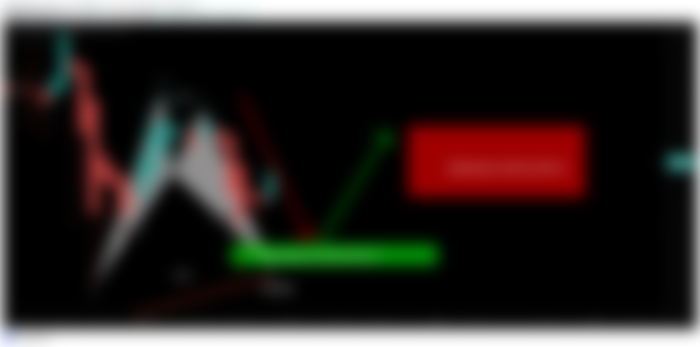
On the 2-day time frame chart, the price action has formed a big bullish BAT pattern. We are a bit late in catching this pattern coz it has already moved up after visiting the buying zone. The price action has reached the targets of the BAT pattern. However, after moving up from the potential reversal zone of this harmonic pattern we can expect that the price action will make a powerful attempt to break out the descending triangle.

In order to play and watch the current performance of the chart you need at least a free account on tradingview:
https://www.tradingview.com/gopro/?share_your_love=moon333
KuCoin is one of the best exchange to find crypto gems:
https://www.kucoin.com/ucenter/signup?rcode=rJSDVT3
Link for Binance exchange, to trade crypto: