Hi guys and gals hope you are well and welcome to the new update on Matic Network. The Matic token has almost completed a bullish setup with the US dollar and also with the Bitcoin pair as well. In today's article first, we will discuss with the US dollar pair then we will also discuss with the Bitcoin pair.
Matic network with US dollar pair:
After the mid of March 2020, the Matic network turned very strong bullish and surged more than 300%. At this time price action is being retraced and it has the strong support of 25 simple moving average in the 50 SMA on the weekly chart. Therefore the price action can take another bounce from the 25 moving average.

Formation of bullish Crab pattern:
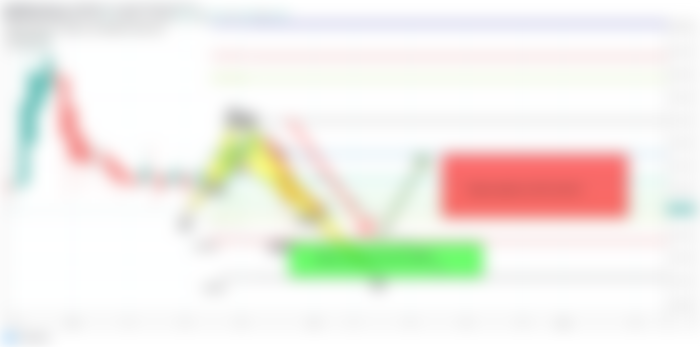
The price action of the Matic network with US dollar pair is completing the final leg of the bullish Crab pattern. The formation of this pattern was started on 15th of June 2020 and as per the Fibonacci sequence of this pattern the potential reversal zone and Fibonacci projection or buying and sell targets can be as below:
Potential reversal or buying zone: $0.0176 to $0.0161
Fibonacci projection or sell zone: $0.0187 to $0.0215

Matic network with Bitcoin pair:
Same as like Matic token with US dollar pair the Matic network with Bitcoin pair also turned very strong bullish. On a long-term weekly chart, it is retraced on the 25 simple moving average now the price action has the 25 and 50 simple moving averages as strong supports. Now it can take another bullish bounce at any time.


Formation of bullish Gartley pattern:
The price action of the Matic network with the Bitcoin pair has completed the final leg of the bullish Gartley pattern. The formation of this pattern was started on 10th of May 2020 and as per the Fibonacci sequence of this pattern the potential reversal zone and Fibonacci projection or buying and sell targets can be as below:
Potential reversal or buying zone: 0.00000217 to 0.00000194 sats
Fibonacci projection or sell zone: 0.00000236 to 0.00000280 sats


Formation of Very big Gartley on the Monthly chart:
The priceline also has completed the final leg of the bullish Gartley pattern in the Bitcoin market. As per Fibonacci sequence of this pattern the potential reversal zone and Fibonacci projection or buying and sell targets can be as below:
Potential reversal zone or buying zone: 0.00000249 to 0.00000161 sats
Fibonacci projection or sell zone: 0.00000320 to 0.00000485 sats


Conclusion:
From midterm to long term Matic token is moving to more bullish zones. However, the potential reversal zones of each pattern should be used as stop loss to minimize the risk factor.
Note: This idea is education purpose only and not intended to be investment advice, please seek a duly licensed professional and do you own research before any investment.