Hi friends, hope you are well, and welcome to the new update on Kusama ( KSM ) coin.
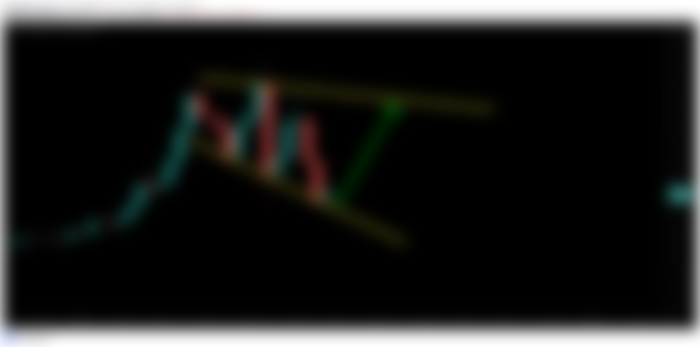
The broadening formation:
On the weekly time frame chart, the price action of the KSM coin has formed a broadening formation and now the price action is likely to have a very nice bounce from the support of this broadening formation. Once the priceline of Kusama will start a big move from here then the next touch at the resistance is expected at $500.

Ichimoku cloud:
On the daily timeframe chart, the priceline of the KSM coin has broken down the Ichimoku cloud, and now the conversion line is crossing down the price action to lift it up. Once the price action will cross up the conversion line then the conversion line can cross up the baseline as well which will be a buying signal. We can also observe that there is a bullish cloud above the candlesticks and if the price action is having a bullish cloud above it then it is easy for it to break out this cloud. Because the bullish cloud works as a weak resistance but strong support.


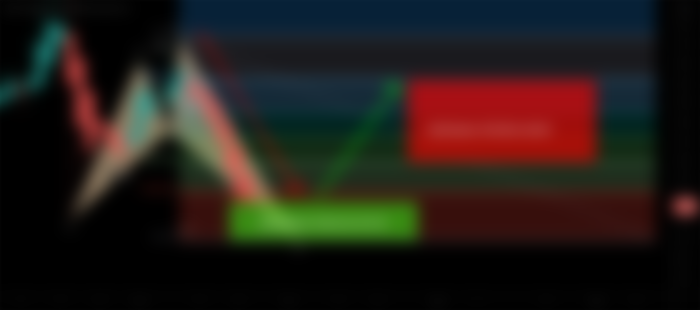
Harmonic bullish Shark pattern:
On the 2-day time frame chart, KSM has formed a bullish harmonic Shark pattern. I have already shared this pattern a few days back when the priceline was in the buying zone of this bullish harmonic move. The buying and sell targets of this pattern are as below:
Buy between: $196.26 to $115.97
Sell between: $276.80 to 446.89
Stop-loss of this pattern was as blow:
The maximum extent of the potential reversal zone of $115.97 can be used as stop loss.
The possible profit and loss ratio of the bullish harmonic Shark was as below:
As per the above targets, this trade has a big profit possibility up to 285% and a big loss possibility is 41%. Therefore try to buy it within the potential reversal zone as lower as possible.

Conclusion:
The price action of the KSM coin has already bounced from the support of the broadening formation and at the same time, it is taking a bullish divergence from the potential reversal zone of a bullish harmonic Shark pattern. Therefore, we can expect that soon the priceline will also reach the resistance of the broadening formation at the $500 level.
In order to play and watch the current performance of the chart you need at least a free account on tradingview:
https://www.tradingview.com/gopro/?share_your_love=moon333
KuCoin is one of the best exchange to find crypto gems:
https://www.kucoin.com/ucenter/signup?rcode=rJSDVT3
Link for Binance exchange, to trade crypto:
https://www.binance.com/?ref=11256882
Note: Above idea is for educational purpose only. It is advised to diversify and strictly follow the stop loss, and don't get stuck with trade.
Resources