Hi friends hope you are doing well. Today will do technical analysis on the Basic attention token and we will also see the reasons why the BAT token is turning more bullish than Bitcoin. Today's article will also help us understand whether to invest in Bitcoin is more profitable or in BAT token is more beneficial.
Harmonic move of BAT token:
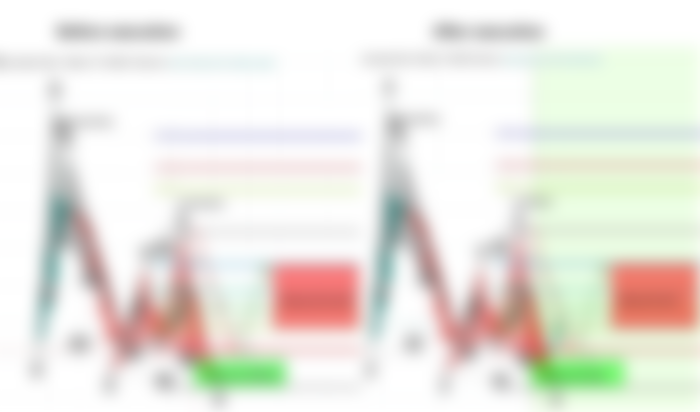
First of all I would like to recall the harmonic patterns that were formed by the BAT token and the Bitcoin on the long term charts. If we take a look at the Basic attention token then on 16th of March I published an article where I revealed that BAT token has formed a complete bullish Shark pattarn after the successful formation of BAT pattern. And as per Fibonacci sequence I predicted that the BAT token should move up between $0.193 to $0.28. And we have witnessed that price action took bullish divergence from the potential reversal zone and produced more than 124% profit.

Harmonic move of Bitcoin:
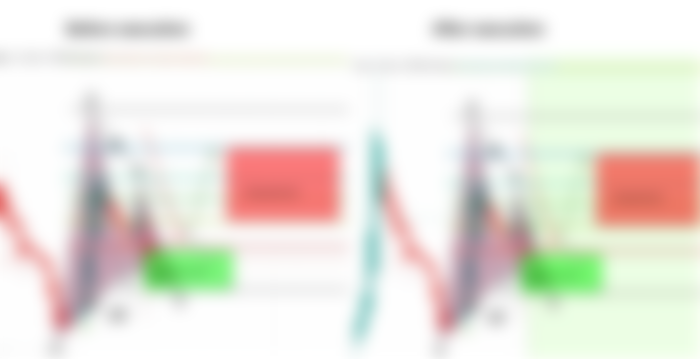
On the other hand I also posted an article on the Bitcoin as well where the Bitcoin had formed a very big bullish Gartley pattern on the monthly chart. And as per Fibnoacci sequence of Gartley I predicted that the BTC should move up between $8650 to $12000. And finally the price action took a powerful bullish divergence from the potential reversal zone and produced almost 50% profit. This profit ratio is almost less than have of the profit that the basic attention token has produced.

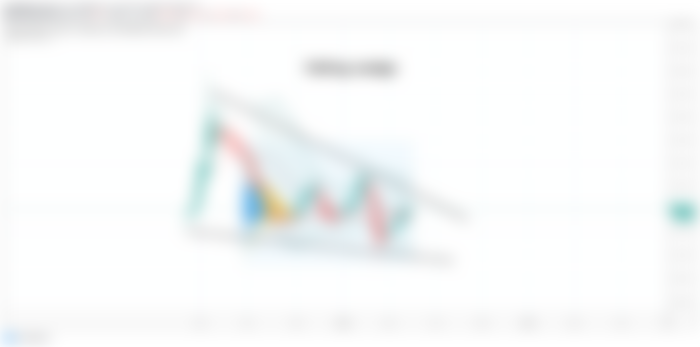
Falling wedge pattern of BAT token:Now if we switch to the weekly chart then we can see that the Basic attention token has formed a falling wedge pattern. After hitting the support of the wedge it has taken a very powerful bounce and reached up to the resistance. Here I have also placed the volume profile on the complete price action moving within this wedge and we can see that below $0.17 there is very e weak interest of the traders therefore when the price action moved down than this level It moved up again. There is another positive indication that the bollinger bands is above the resistance of this wedge pattern, therefore it will be easy for the priceline to break out the resistance of the wedge.

You can also watch below video for better understanding:
Down channel of Bitcoin:
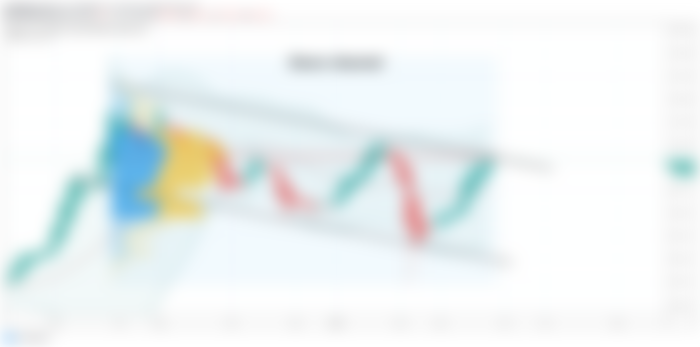
On the other hand the Bitcoin has also formed a down channel on the weekly chart. And when the basic attention token was getting bounced from the support of wedge at the same time the Bitcoin also got a strong bounce from the support of the channel and reached up to the resistance. I've also placed the volume profile on the complete price action within this channel and we can see that the traders interest is very low below $6800. Therefore when the price line moved below than this level it moved up again and reached at resistance. The bollinger bands on this chart is also above the channel resistance, therefore it will be easy for the priceline of Bitcoin to break out the resistance.

SMAs of BAT token on daily chart:
Now let's move to the daily chart and here 1st we will take a look at the basic attention token. Here I have paced the simple moving averages with the time period of 25, 50, 100 and 200 and we can see that the priceline has crossed up all these for simple moving averages. And now price action moving at the support of 200 SMA. The 50 simple moving average is moving up to form the golden cross with 100 then 200 SMAs. When the 50 SMA will form the golden cross with 200 simple moving average then many traders can be attracted to buy Basic attention. Because this golden cross between 50 and 200 SMAs is considered as a strong buying signal. Therefore after this golden cross we can expect more powerful bullish move.

SMAs of bitcoin daily chart:
On the other hand if we watch the Bitcoin daily chart then after crossing up all the simple moving averages the Bitcoin went at very far distance from simple moving averages. And at this time the price action of BTC has the support of 25 simple moving average. That is not as that much powerful support as the basic attention token has. Therefore there are chances that the BTC may breakdown the 25 simple moving average and drop at the 200 SMA support that is at $8000. However there is another possibility that the Bitcoin will turn bullish from the 25 SMA and move more up.
But we can have an idea that the moving averages on the BTC chart has formed more golden crosses than Basic attention token, so when the moving averages on BAT token chart will form the due golden cross then it can turn more bullish than Bitcoin.

The exponential moving averages:
If we watch the exponential moving averages then the BAT token dropped between EMAs 10 and 21 and at this time it is likely to take it bounce and moving above the exponential moving average 10. On the other hand if we watch the BTC chart that the Bitcoin is still moving between EMA 10 and EMA 21 and facing the resistance EMA 10. This is a significant because if price action of BTC will be broken down then Bitcoin can start bearish move upto $8000 where we have 200 simple moving average support. But if the Bitcoin will continue its sideways move between these two EMAs then soon the BAT token will ignore the Bitcoin’s sideways move and it will turn more bullish as it is already getting bounced from EMA 10 and 21.

Similar channels on daily chart:
On the daily chart the BAT token and the Bitcoin both have formed a similar up channels. Both currencies started this channel in March 2020. But at this time we can see that the Basic attention token is moving up after hitting at the support of the channel, but on the other hand the Bitcoin is still moving sideways with the support of earth channel. And again there is a possibility that if the Bitcoin will continue to move sideways with the support of the channel then Basic attention token can ignore this sideways move of the BTC. And it can reach up to the resistance of the channel very soon.

Let’s talk about the support and resistance:
Now I would like to show you different long-term support and resistance levels on the weekly chart. As have seen that after the recent strong bearish move the BAT token got bounced from the lowest support of 15 cents. Now the price action is stuck at the resistance of $0.20. This is not very powerful resistance as we can see that when in August 2019 the price action breakdown $0.20 support level then only 5 candlesticks moved sideways then the BAT broke out this resistance level very easily then we have also witnessed in the month of December only four candlesticks moved sideways and finally the price action broke out this resistance level again. And this is for the 3rd time we are having sideways candlesticks at this resistance level. Therefore I am expecting that the priceline can break out this resistance very soon as it has been doing in the past. Then Basic attention token has next resistance level at $0.28. That is not broken out since after it has broken down this level in the month of July 2019. Once this resistance level will be broken out then we will have a final key level resistance at 43 cents. And once this ki level resistance will be broken out then the Baton can try to achieve the highest price ever in the history of basic attention token that can be up to $2 or beyond on long term.

Conclusion:
Even though the Basic attention token is embracing the bullish and bearish signals of the Bitcoin. But after receiving the bullish signals it is turning more bullish than Bitcoin, even if the BTC moves sideways the BAT token is making upward moves. Therefore if the BTC will be not dropped then Basic attention token can produce more profit than Bitcoin on the short-term and on the midterm charts.
