Hi friends hope you are doing well and welcome to the new update on Cardano. In today's article we will try to understand why the ADA has surged more than other top cryptocurrencies. And in order to understand this we will try to watch the different chart patterns, moving averages, oscillator and different indicator is well.
Before moving to the technical analysis I would like to draw your attention towards an upcoming event and that is the Cardano is going to enlisted on crypto.com exchange. We can find this announcement at their twitter handle and they have also announced it on their blog and we can also watch this update on their exchange as well.
Twitter handle:

Blog:


Announcement on Exchange:


There will be 50% off for Cardano. And the crypto.com coin (CRO) stackers will be able to participate in this discounted sale event therefore the price of CRO is also surged. For detailed information about this sale you can visit the twitter, blog or exchange i have shared the links above.
Harmonic moves gave advance bullish signals for this surge:
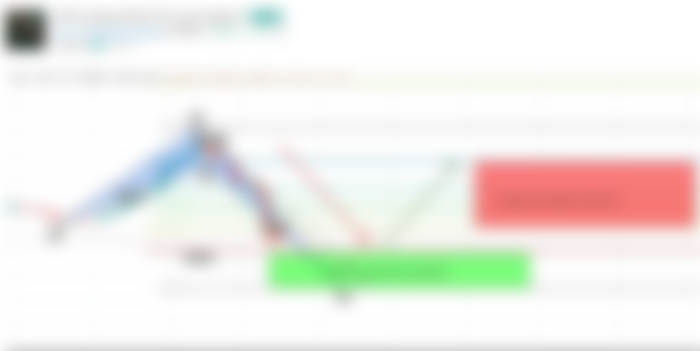
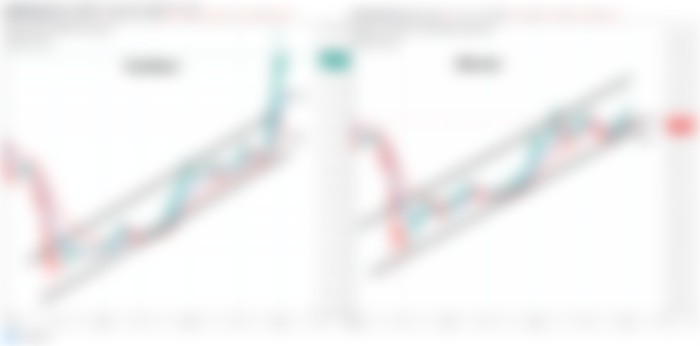
Now before moving to analysis. I would like to show you to harmonic patterns that were formed during the strong bearish trend of March 2020. And while moving down the Cardano formed a harmonic Crab pattern on two day chart and in the meanwhile the price action also formed a very big bullish Butterfly pattern on the monthly chart as well. Therefore as per Fibonacci sequence I predicted that the price action will take bullish divergence from the potential reversal zone of Crab and along with that it will also start a bullish rally from the potential reversal zone of bullish Butterfly pattern on monthly chart. And the this move would be like a chain reaction. And we have witnessed that finally the priceline of ADA started a bullish move after the mid of March. And sofa it has produced more than 300% rally.
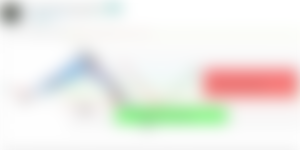
Bullish Crab before execution:
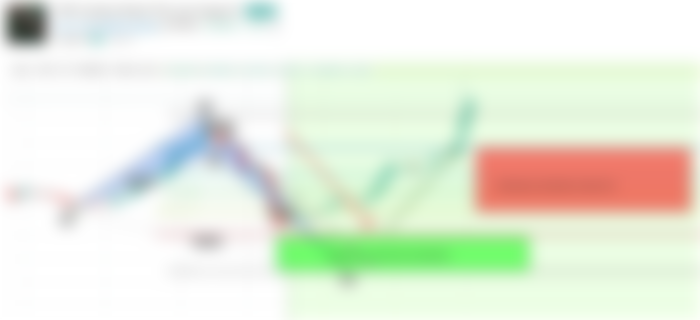
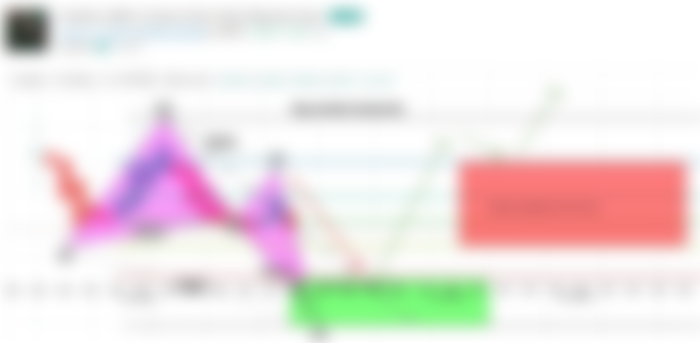
Bullish Crab after execution:
Bullish Butterfly before execution:
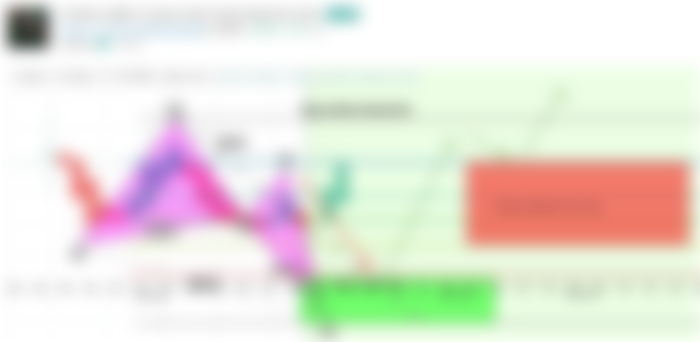
Bullish Butterfly after execution:
You can also watch this video for better understanding
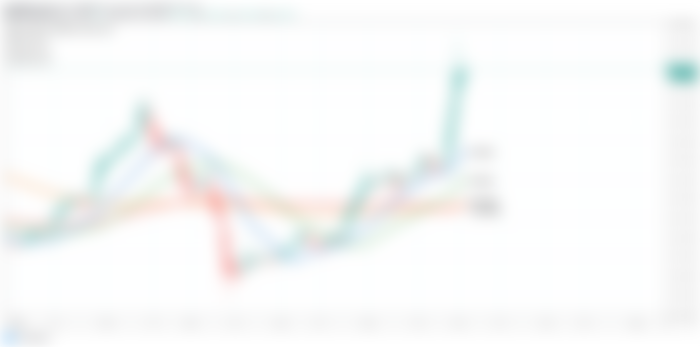
The simple moving averages:
In order to observe the power of bullish or bearish trend it is very important to watch moving averages. Therefore I always watch the position of the moving averages. Now on daily chart if we watch the position of the simple moving averages with time period of 25 50 100 and 200 then it is very strong bullish. There is only one move is due and that is the 100 simple moving average should form a bull cross with 200 SMA. And then a complete opened alligator mouth will be formed that can lead the price action to turn more bullish. But there is also a critical point and that is the price action has turned so much bullish and it went very far above the moving averages. And there is a big distance between the moving averages and the price action. Therefore if the priceline will start a correction rally then it can move down up to the first available nearest moving average and at this time it is 25 SMA. Therefore that will be a drastic drop however if the moving averages will be moved up and remove this distance then the price action will have strong support of the SMAs just below the tail of the candlesticks.

Up channel has been broken out exceptionally and EMAs are strong bullish:
On the same daily chart the Cardano has formed an up channel like every top cryptocurrency. But exceptionally the ADA turned very strong bullish and it has broken out the resistance of the channel. On the other side if we watch the Bitcoin and all other cryptocurrencies then those are still moving within the channel. For example at this time the Bitcoin is near support of that channel. And if we watch the exponential moving averages 10 and 21 then again Cardano went very far from the support of exponential moving averages and on the other side the Bitcoin is using the exponential moving averages EMA 10 and 21 as support.

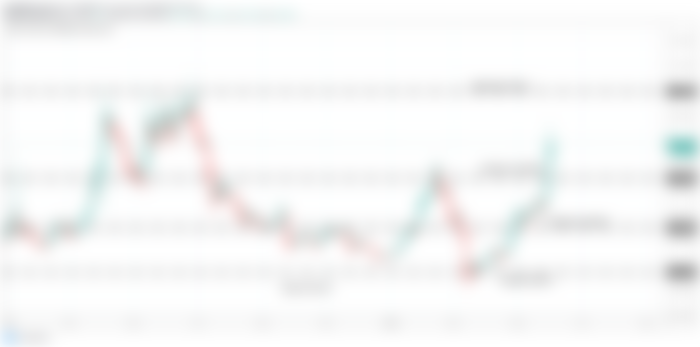
Support and resistance levels:
During the previous strong drop the priceline of ADA has re-tested the support of $0.027. Then it moved up and crossed the $0.45 resistance. And after crossing up this resistance the price action re-tested it as a support and then Cardano turned very strong bullish and crossed up $0.065 resistance level. This time the priceline was very strong bullish as it did not re-tested the previous resistance of $0.065 as a support. However there is still possibility that price action will start correction rally and re-test the previous resistance as support before next bullish rally. Now the next resistance level for Cardano is $0.10. Amd this level in very strong key level resistance as it is not broken out since April 2019 even after several attempts by the ADA. Therefore the next bullish move is very important for Cardano. If this $0.10 resistance level will be broken out then the price action can start stronger than the previous bullish rally to achieve the higher than previous highest price ever in the history of ADA.

Conclusion:
In the month of Jun 2020 The ADA can behave different as compare to other cryptocurrencies including Bitcoin. And it can show more powerful bullish moves in coming days. However we should be careful about the stop loss because the price action went very far and away from the support of the moving averages. Therefore if price action will move down to retest the support of any moving average then the drop can be severe.
I simply love ADA. Even though the mainnet has been delayed multiple times I believe it will make up for all the delays once the staking is available