Failed in breaking out the resistance:
Hi guys and gals hope you are well, welcome to the new update on Ethereum, the Ethereum was going very good and after crossing the $224 resistance it was expected that it will use this resistance as support and move up to hit the next resistance level but the price action has failed to retest the resistance of $224 and dropped down at previous resistance level at $149 and even now hitting at the next support level at $122. Before breaking down the $244 the support the price action went very close to $310 resistance $290.
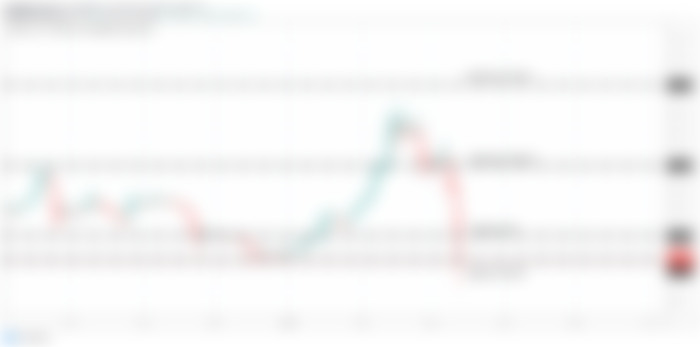

Simple moving averages are broken down:
On daily chart the priceline of Ethereum was moving above 100 and 200 simple moving averages and it was expected that these moving averages will work as strong support for the priceline but the bearish move was very strong and now we can see that the candlesticks has broken down the both simple moving averages on daily.
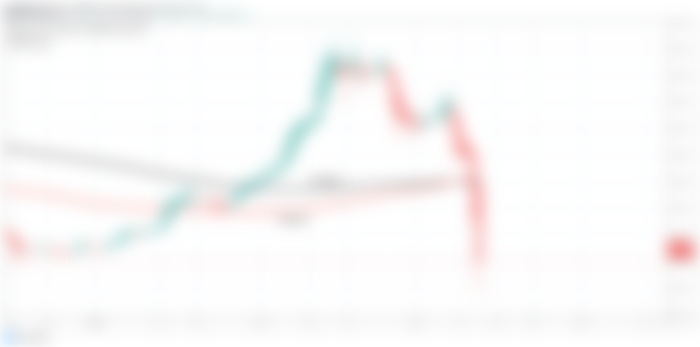

Ichimoku cloud:
In my previous article we have discussed that the on weekly chart priceline was likely to cross the ichimoku bullish cloud and conversion line had formed bull cross with the baseline just below the priceline of ethereum and Ethereum achieved highest price by moving up 12933% bullish move. This time the price line of Ethereum was moving below this cloud since July 2018 and the current during current bull rally it was expected that candle sticks will cross up the bullish cloud. Unfortunately this time the priceline of Ethereum did not cross the bullish cloud and dropped down. Once the priceline will be successful in crossing up the bullish cloud then we can expect a really very big bullish move like it has taken in 2017. No one can say anything that this time the priceline of Ethereum will produce 12933% or more or less profit but it can make really very big bullish move.


Harmonic move:
If we see on monthly chart then the strong bearish move has completed the final and last leg of bullish Gartley pattern which was being formed. It was started on December 2018 and the first leg was completed on June 2019 then the price action retraced upto 0.786 level here I have ignored some extra spike. From here the price action was suppose to be projected between the projection area of A to B leg from 0.382 to 0.886 Fibonacci level and after being projected in this area the Ethereum was suppose to be retraced between 0.618 to 0.786 Fibonacci level. After this retracement now the price action is suppose to be projected between 0.382 to 0.786 Fibonacci level and this is the projection of A to D leg.
Now we can see the priceline of Ethereum even has hit the spike even beyond the potential reversal zone of this big bullish Gartley pattern but unless the candle sticks will be not closed below the potential reversal zone it cannot be considered that this PRZ level has been broken down.
Now from this potential reversal zone the candlesticks are suppose are to be projected between the projection area of A to D leg and this bullish divergence can also lead the price action of Ethereum to breakout the ichimoku cloud as well and we have discussed earlier once the pipeline will cross up to cloud on weekly chart then it can turn more bullish to produce very big profit gains.


The range of potential reversal zone and Fibonacci projection area:
And as per bullish Gartley the potential reversal zone of this pattern starts from $188 and ends at $141. And the Fibonacci projection starts from $225 and ends up to $315 this is the level where we also have key level resistance of Ethereum $310.
Stop loss:
Maximum extent of potential reversal on should be used as stop loss point in case if the candle sticks will be closed below this area because once the priceline will break down this PRZ level then the price action may go for bullish Butterfly and can retrace more down between 1.27 upto 1.618 Fibonacci level.
Note: This idea is education purpose only and not intended to be investment advise, please seek a duly licensed professional and do you own research before any investment.