Hi folks, hope you are doing good. In my previous post on Ethereum with Bitcoin pair we have seen that the Ethereum had completed the formation of bullish Crab pattern. This chart was based on long term 2 weeks time period and as per Fibonacci sequence of Crab I predicted that the price action should move up from the potential reversal zone of this pattern to enter in the Fibonacci projection area of A to D leg from 0.382 to 0.786 Fib projection level.
Then we have witnessed that the price action moved up and entered in the target sell zone and produced more than 68% gains.
Before execution:
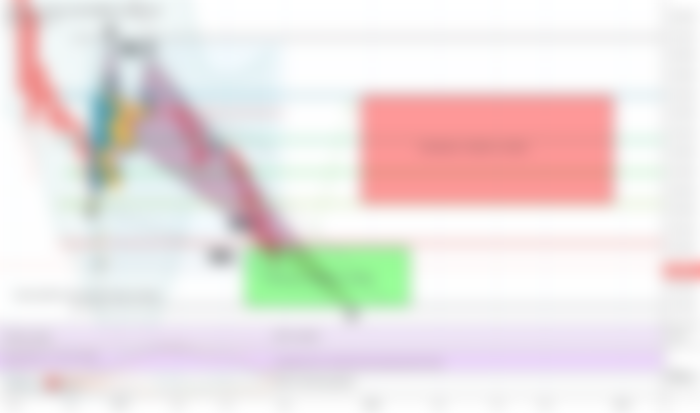

After execution:


A new harmonic BAT pattern:
This time again on daily chart Ethereum has formed another harmonic bullish BAT pattern and entered in potential reversal zone. And giving another chance to earn more gains.
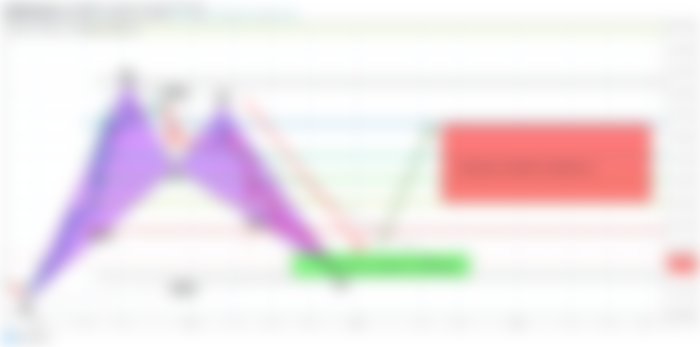

Let’s dig the pattern deeper to see how perfect it has been formed.
After initial leg (X to A) the A to B leg is retraced between 0.382 to 0.50 Fibonacci and then B to C leg is projected between 0.328 to 0.886 Fib of A to B Fibonacci projection area and last leg (C to D) is retraced between 0.786 to 0.886 Fibonacci level.
Buying And Sell Targets:
The buying and sell targets according to harmonic BAT pattern and its Fibonacci sequence should be:
Buy between: 0.020644 to 0.019644 sats
Sell between: 0.023027 to 0.026581 sats
So this short term trade can has capacity to produce upto 35% profit.
Stop Loss:
The potential reversal zone area that is up to 0.019644 sats can be used as stop loss in case of complete candle stick opens and closes below this level.
Note: This idea is education purpose only and not intended to be investment advise, please seek a duly licensed professional and do you own research before any investment.