Recap:
Very warm welcome on Ethereum’s price action update.
First of all I would like to have some recap below was the chart I published on January 2020 and here we have seen that the price action had form a bullish Shark pattern and it was expected that it will produce up to 123% profit and so far it has produced almost 104% and since then the price action of Ethereum is in uptrend.

Long Term Resistance:
In previous post we have seen the long term analysis and as per that analysis the next long term resistance level is $742 dollars.

Mid Term And Short Term Analysis:
In this post we will see the midterm and short term analysis. And our next midterm and short term resistance level is $310.
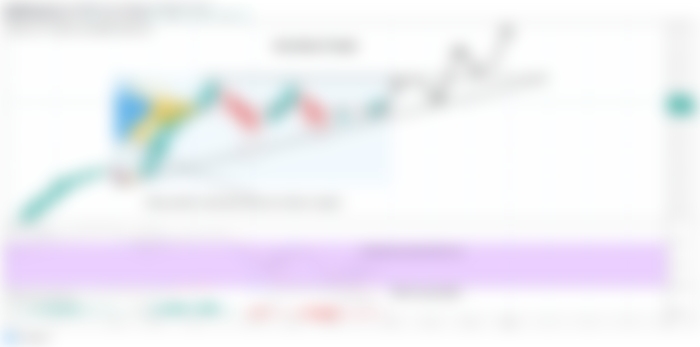
At this time we are above the resistance level of $234 which was recently broken by the price action of Ethereum and now the price action is likely to form a bull flag but here is a difference at this time in the movement of the price action if we compare this movement with the previous bull rally of Ethereum.
Which was started since Feb to June 2019 at that time after breaking out at the first resistance level at $149 the price action retested the previous resistance as support and then using that support the price action move to the next resistance level then again the priceline of Etherum broke out the next resistance level of $224 and retested the previous resistance as support.
But this time the price action is behaving differently since the recent bull rally is started first the price action broke out the resistance of $149 and without retesting the resistance as a support the price action formed a bull flag and moved to next resistance level t $224 and after breaking out this resistance level the price action again did not retest the previous resistance of $224 as a support and formed another bull flag and at this time the candlesticks are being consolidated within that bull flag.
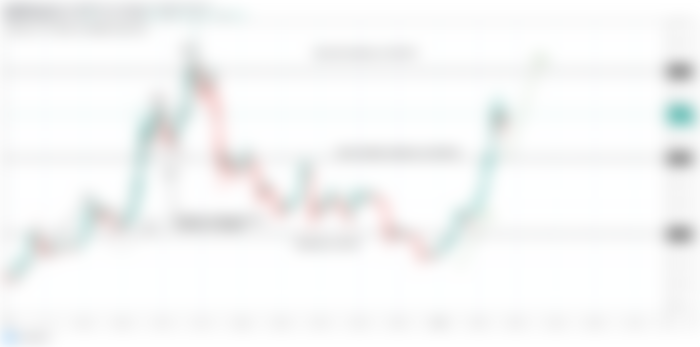

There are some certain reasons behind this move that the price action could not retest the previous resistance as a support and moving up in a more bullish manner then the previous Bull rally.
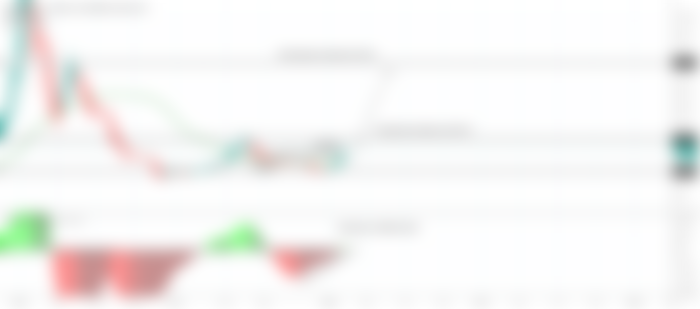
Simple Moving Averages Are Forming Golden Crosses:
This is the first reason I found which is not letting the price action moving down to retest the support, whenever price action is breaking out the resistance levels the simple moving averages with the time period of 25, 50, 100, and 200 are forming golden crosses beneath the priceline. For example when the price action broke out the first resistance level at $149 the 25 simple moving average formed a golden cross with 50 moving average which produced the bullish divergence and after that 25 moving average formed a golden cross with 100 moving average which produced more powerful bullish divergence then 25 moving average formed golden Cross with 200 moving average and this golden cross pushed the price action beyond the next resistance level of $224.
Now after breaking out the $224 resistance level the 50 simple moving average has formed a golden cross with 200 simple moving average and this golden cross is the most popular among the traders community the professional traders always seek for this golden cross between 200 SMA and 50 simple moving average to buy any asset. Now when the candlesticks are being consolidated within the bull flag there is another golden cross expected between 100 simple moving average and 200 SMA, and so far they have come very close to each other to form this golden cross and this cross can produce more powerful bullish divergence that the price action may break the next resistance level at $310.

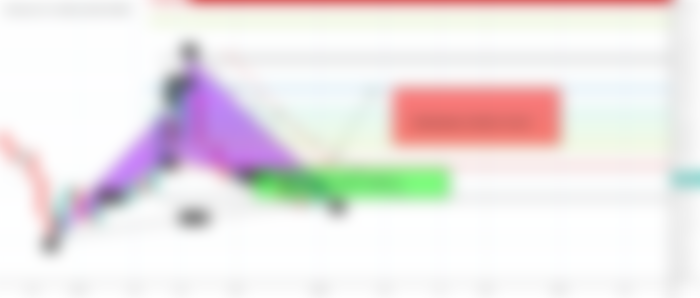
Ascending Triangle:
If we dig the current bull flag more deeper then on 12 hour chart we can see that the price action of Ethereum is caught in an ascending triangle and the ascending triangle is known as continuation pattern and we already know that the price action of Ethereum is in uptrend therefore there are more chances that this uptrend will be continue. I have placed the volume profile on the complete triangle and as a result we can see that the traders interest is very low at the support of this triangle therefore there are less chances that the price action will break down the support of this triangle. The movement of priceline within this triangle is very much synchronized with stochastic and moving average convergence divergence (MACD) indicator, whenever the price action hits at the support of ascending triangle and stochastic gives bull cross and MACD turns bullish the price action moves up and hits the resistance of the triangle. At this time we can see again after hitting the support of the triangle we have received a bull cross from the stochastic on 31st of Feb and MACD turned weak bearish from strong bearish which is a bull signal and now the price action is moving up towards the resistance. The price action may break out the resistance of the triangle or hits this the resistance and move down again to hit the support but now the price action cannot move within this triangle for more time as the end of this pattern is reached at the end of the triangle it is getting more squeezed.
So the price action may take the decision for breakout or breakdown very soon.

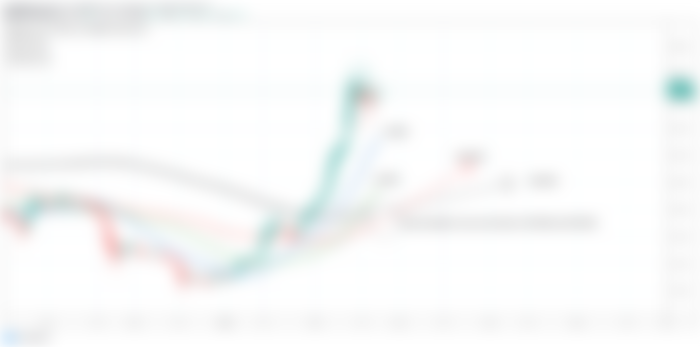
Bill William Three Lines And Alligator Mouth:
The Bill William 3 lines and the alligator’s mouth strategy is playing very much important role in this bullish rally like it has performed in the previous bullish rally. Bill William lines comprises of 3 simple moving averages blue one is simple moving average with time period of 13 and this is called Jaw and red one is simple moving average 8 this moving average is called teeth and green one is simple moving average 5 and this moving average is called lips of alligator.
In previous bull rally the price action moved up from Feb 2019 to April 2019 and formed bull flag then Bill William lines opened the alligator’s mouth by crossing the 5 SMA above all moving averages then 8 SMA which is also called teeth crossed the Jaw (the SMA 13) and the price action moved up to the next bull flag. Then the candlesticks consolidated in that bull flag and again the Bill William’s three lines opened the alligator’s mouth and the price action achieved the most recent high in June 2019 which was $363.29. Then the alligator’s mouth of Bill William three lines was closed and the price action turned into complete down trend from July 2019 up to Dec 2019.
Now we can see that we are again in uptrend and bill Williams 3 lines have again opened an alligator’s mouth the first bull flag was formed on 19th of January 2020 then green line crossed up the red line and moved above all moving averages then teeth or simple moving average 8 moved up and came in the center of both moving averages and the blue one which is also called jaw moved up and it was moving below the other two moving averages and a complete alligator is mouth opened and the price action has entered in the recent bull flag.
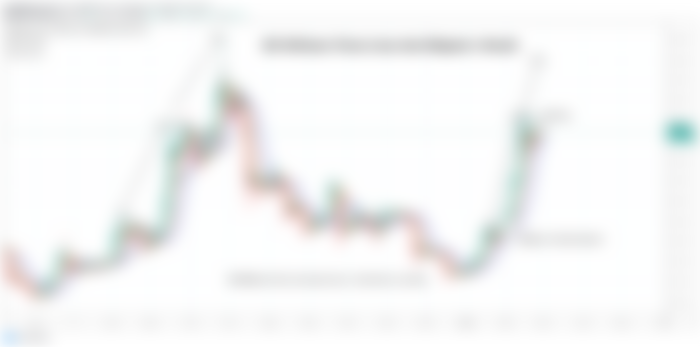

Now I am expecting that again the simple moving average 5 will cross up the simple moving average 8 and a complete alligator’s mouth will be opened and soon the price action will hit the next resistance level AT $310.