Hey, friends hope you are wel and welcome to the new update on the Digibyte coin. Previously we have seen that Digibyte was moving in an up-channel since April 2020. Recently the price action has broken down the support of this up channel. The price action gave two major signals before this drop. The 1st signal was if we place the volume profile indicator on the complete price action moving within this channel then we can easily observe that it was showing that there was a strong interest of the traders even below the support of the channel, and if we place the moon phases indicator then it can be clearly seen that the new dark moon was a appeared below the support of this channel. Both these indicators were giving clear indications that the price action is going to break down the support of the channel.


Click to join adclickxpress for passive income and get $10 free as a startup balance
(Note above link will lead you to the adclickxpress)
What can be the best exchange or place to buy or trade Digibyte:
Well at this time Binance is ranked at No: 2 for Digibyte trading with 100% confidence of traders and highest liquidity rate and the largest trading volume as well, therefore I would suggest you to buy or trade DGB on Binance. If you don't have an account on Binance then click on the link or copy and paste it in your browser to create an account:


https://www.binance.com/en?ref=11256882
Cup & Handle pattern:
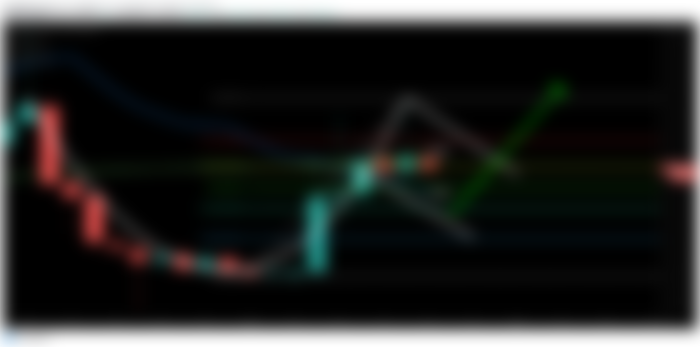
Now if we switch to the monthly chart to see what's happening in the bigger time period. The price action of DGB has completed the formation of a Cup & Handle pattern and the resistance of the cup is at 0.00000318 btc. After completion of the cup now the price action is moving within the handle. If we place the simple moving averages with the time period of 50 and 25 then we can also observe that the priceline is now moving between the two simple moving averages. At the moment the priceline of DGB has hit the resistance of 50 simple moving average and moving down to the support of 25 simple moving average. I have also placed the Fibonacci tool from the support of this cup up to the resistance. After placing this tool it is very clear that the price action of the DGB has retraced between 0.383 to 0.50 Fibonacci retracement level. At 0.50 Fibonacci retracement level, we also have the 25 simple moving average support on the monthly chart. That is very strong support and it will be very difficult for the priceline of Digibyte to break down this SMA. Therefore I am not expecting that the price action will move more down than the 25 simple moving average. But if the 25 simple moving average will be broken down then we can expect that the cup and handle formation will be invalidated and we can witness a huge drop because if we switch on the weekly chart then price action is also completing the formation of a bullish Shark harmonic pattern.

Bullish Shark move:
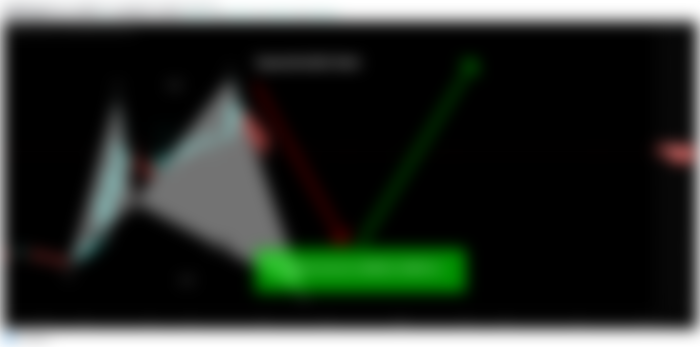
On the weekly chart, it can be clearly seen that the price action has retraced between 0.382 to 0.618 Fibonacci retracement level after the completion of the initial X to A leg. Then priceline has projected between 1.13 to 1.618 Fibonacci projection of A to B leg and here we have received 2nd confirmation for the bullish Shark. Now as per the Fibonacci sequence of this pattern the priceline of Digibyte can retrace between 0.886 to 1.13 Fibonacci level for the completion of the final leg. But the completion of the final leg depends on the breakdown of 25 simple moving average on the monthly chart that is very difficult.

Click here to create free account on tradingview to watch and play the chart on realtime
Conclusion:
Now at one side on the bigger time period monthly chart have a complete Cup & Handle formation and on the other side on the smaller time period weekly chart we are expecting the completion of the final leg of the bullish Shark pattern. In my opinion, the bigger time period pattern is stronger and unless the 25 simple moving average would be not broken down we can expect a bullish move up to the resistance of the cup. But if the 25 simple moving average on the monthly chart will be broken down then we can witness a very massive sell-off until the price action will not complete the final leg of the Shark. And from the potential reversal zone of the Shark pattern we will see a powerful bullish rally. Therefore in any case we should use the 25 SMA of monthly chart as stop loss.
I appreciate your work.Thank you so much for sharing such an attractive article like this.hope you will be success very soon in this platform. Your every writing is also so attractive,,,,,,,,,,,,,,well done bro,, I always try to support you.Best of luck dear https://read.cash/@moli/the-shadow-of-death-always-hangs-over-every-human-being-7a641f8f here sub and visit mine .only if you wish.thank you so much.