Hi guys and gals hope you are well and welcome to the new update on Digibyte coin. The DGB has surged more than 450%. Therefore in today's article, we will try to understand how this coin completed its bullish setup before this bullish move and what the price action can do next.
As per the announcement of Digifinex exchange on the 30th of June, the Digibyte with Bitcoin pair trade has been opened. It was expected that this event will trigger some major Movement in the price action but so far the price action did not show any big move since yesterday.

The big harmonic bearish Shark move:
On June 25 2019 almost a year ago I posted an article on the tradingview where I predicted that the price action of digibyte coin is forming a bearish shark pattern. And soon it can start the formation of the final leg of this pattern. It was a very long time monthly chart at that time the priceline of DGB just entered the potential reversal zone. Finally, the price action starred bullish rally in April 2020. And so far it has surged more than 450%. And started the completion of the final leg.
The previous idea before execution:


The previous idea after 450% move:


I defined buying and sell ranges as per Fibonacci sequence of Shark as below:
Buy between: 0.00000168 to 0.00000001 sats
Sell targets:
Secure sell targets:
Sell between: 0.00000338 to 0.00000694 sats
Aggressive targets:
Sell between: 0.00000808 to 0.00000969 sats
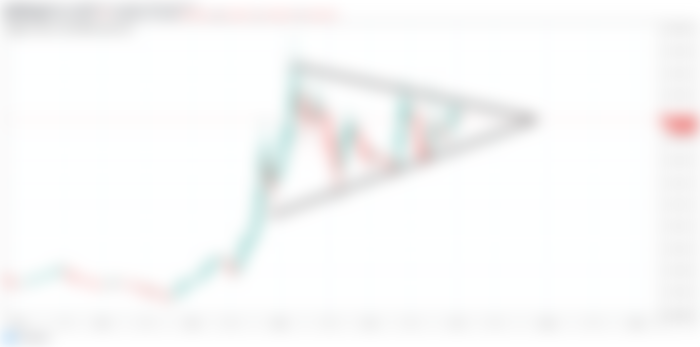
A symmetrical triangle:
Now in order to understand the movement of the price action more closely will need to switch to the small time period chart. And if we watch on the daily chart then the price action has formed a symmetrical triangle. At this time the price action is almost at the end of this triangle as the pattern is getting squeezed. After hitting the resistance the priceline is moving down towards the support. Therefore we can expect another touch at the support level then the price action may start another bullish rally to make another attempt to breakout the resistance of this triangle.

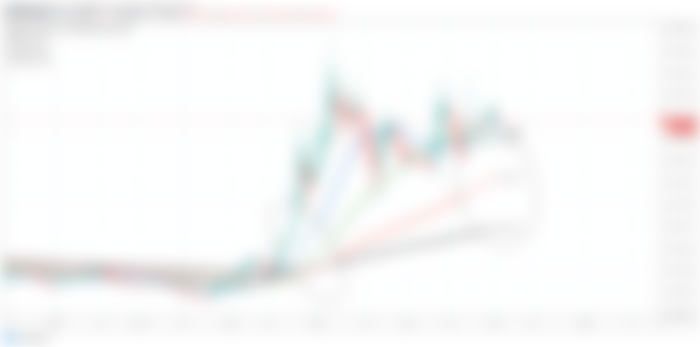
The simple moving averages are in bullish order:
Now if we watch the different simple moving averages on the daily chart with the time period of 25, 50, 100 and 200 then it can be observed that the smallest time period moving average is above all then we have the 50 then 100 and the biggest time period moving average is below all the other moving averages. This order of the moving averages is considered a very strong bullish signal. The Digibyte gave this signal previous in the month of April when the price action started its powerful rally for more than 450% gains. Therefore we can expect that the price action has the strong support of these SMAs and it can start the next bullish move soon.

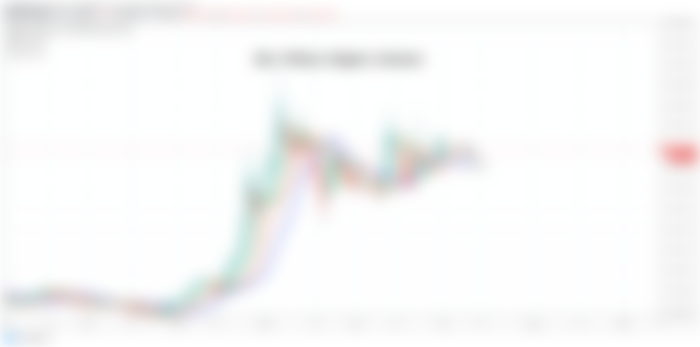
Now for the people who have bought Digibyte following my pattern that I posted it last year and they are seeking a suitable exit point or for the people who want to buy Digibyte now I would like to give two pieces of advice. First is for the people who want to buy digibyte then they should try to buy it at the support of the pennant. And if someone wants to find a suitable exit point then he can use Billl Williams 3 lines that is also called Bill Williams's alligator indicator. This is the combination of three moving averages the smallest one is 5 that is called lips the middle one is 8 that is called teeth and the biggest time period moving average is 13 that is called jaw.
when the smallest moving average (lips) is above all the moving averages that is called that the alligator mouth is opened and that is considered as a strong buying a bullish signal. But if the smallest time period moving average moves below all other moving averages and the biggest time period moving average moves above all. Then it is called that the alligator’s mouth is closed and that is considered as bearish or sell signal. But these are very small time period moving average is, therefore, some time they can give false signals. Therefore in order to avoid false signals we can use a support of the Other bigger time period simple moving averages with the time period of 25,50, 100 and 200. For example, if the alligator mouth gets closed then we should see that if we have any support of any of the bigger time period moving averages then we should wait for the next available moving average to be broken down. If the next moving average would be broken down then we can consider that our stop loss is triggered and we can exit from the trade, otherwise we can wait for the bigger time period moving average to be broken down. This method can save us from any kind of false signals by the Bill William alligator indicator.

Click here to create free account on tradingview to watch and play the chart on realtime
This is the strategy that I use to catch the bearish or bullish rallies. If you have any effective strategy then you can also use it and also share it with us in the comment section.
Conclusion:
On short term we can expect a bearish move up to the support of the triangle. However, on the long-term, the price action is very strong bullish as it has started the formation of final leg of bullish shark and as per the above-mentioned targets it can produce up to 6000% big gains.
Note: This idea is education purpose only and not intended to be investment advice, please seek a duly licensed professional and do you own research before any investment.